
Purchasing Managers’ Index for September 2026
Department of Service Statistics of NBS of China
China Federation of Logistics & Purchasing (CFLP)
I. Manufacturing Purchasing Managers’ Index
In September, the purchasing managers’ index (PMI) of China’s manufacturing industry was 50.1%, an increase of 0.3 percentage points from the previous month to the expansionary range.
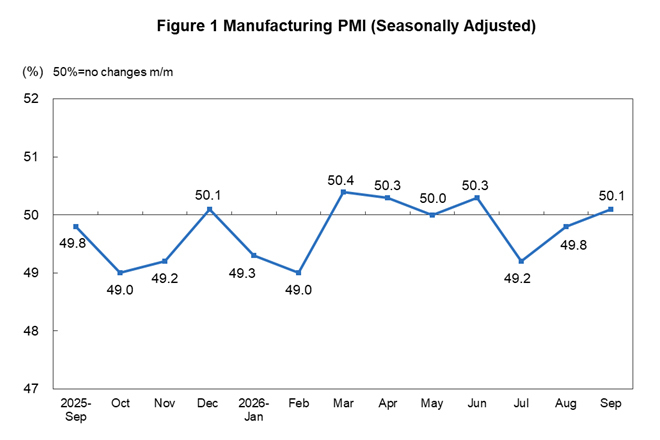
By enterprise size, the PMI for large enterprises was 50.6%, unchanged from the previous month, which was above the threshold; the PMI for medium and small-sized enterprises stood at 49.7% and 48.9%, respectively, an increase of 0.3 percentage points and 1.0 percentage point from the previous month, which were both below the threshold.
By sub-index, among the five sub-indexes that constitute the manufacturing PMI, the production index, the new order index, and the supplier delivery time index were all above the threshold; the raw materials inventory index and the employment index were both below the threshold.
The production index was 51.7%, an increase of 1.3 percentage points from the previous month, indicating an accelerated expansion in production activities in the manufacturing industry.
The new order index was 50.5%, a decrease of 0.1 percentage points from the previous month. The figure was above the threshold, indicating a continued improvement in the market demand of the manufacturing industry.
The raw materials inventory index was 48.2%, an increase of 0.1 percentage points from the previous month, indicating that the decline in the inventories of main raw materials in the manufacturing industry narrowed slightly.
The employment index was 48.4%, a decrease of 0.3 percentage points from the previous month, indicating a decline in the employment climate of the manufacturing industry.
The supplier delivery time index was 50.1%, unchanged from the previous month. The figure was above the threshold, indicating that the delivery time of raw material suppliers in the manufacturing industry continues to shorten.
Table 1 China’s Manufacturing PMI and Sub-indexes (Seasonally Adjusted)
|
Unit: % | ||||||
|
|
PMI |
| ||||
|
Production Index |
New Order Index |
Raw Materials Inventory Index |
Employment Index |
Supplier Delivery Time Index | ||
|
2025-September |
49.8 |
51.9 |
49.7 |
48.5 |
48.5 |
50.8 |
|
October |
49.0 |
49.7 |
48.8 |
47.3 |
48.3 |
50.0 |
|
November |
49.2 |
50.0 |
49.2 |
47.3 |
48.4 |
50.1 |
|
December |
50.1 |
51.7 |
50.8 |
47.8 |
48.2 |
50.2 |
|
2026-January |
49.3 |
50.6 |
49.2 |
47.4 |
48.1 |
50.1 |
|
February |
49.0 |
49.6 |
48.6 |
47.5 |
48.0 |
49.1 |
|
March |
50.4 |
51.4 |
51.6 |
47.7 |
48.6 |
49.5 |
|
April |
50.3 |
51.5 |
50.6 |
49.3 |
48.8 |
49.5 |
|
May |
50.0 |
51.2 |
49.9 |
48.6 |
48.6 |
49.2 |
|
June |
50.3 |
51.4 |
51.2 |
48.4 |
48.5 |
49.9 |
|
July |
49.2 |
49.9 |
48.5 |
48.3 |
49.0 |
49.5 |
|
August |
49.8 |
50.4 |
50.6 |
48.1 |
48.7 |
50.1 |
|
September |
50.1 |
51.7 |
50.5 |
48.2 |
48.4 |
50.1 |
Table 2 Other Related Indexes of China’s Manufacturing PMI (Seasonally Adjusted)
|
Unit: % | ||||||||
|
|
New Export Order Index |
Import Index |
Purchase Quantity Index |
Main Raw Materials Purchase Price Index |
Producer Price Index |
Finished Goods Inventory Index |
Existing Order Index |
Production and Operation Expectation Index |
|
2025-September |
47.8 |
48.1 |
51.6 |
53.2 |
48.2 |
48.2 |
45.2 |
54.1 |
|
October |
45.9 |
46.8 |
49.0 |
52.5 |
47.5 |
48.1 |
44.5 |
52.8 |
|
November |
47.6 |
47.0 |
49.5 |
53.6 |
48.2 |
47.3 |
45.5 |
53.1 |
|
December |
49.0 |
47.0 |
51.1 |
53.1 |
48.9 |
48.2 |
46.0 |
55.5 |
|
2026-January |
47.8 |
47.3 |
48.7 |
56.1 |
50.6 |
48.6 |
45.1 |
52.6 |
|
February |
45.0 |
45.6 |
48.2 |
54.8 |
50.6 |
45.8 |
44.0 |
53.2 |
|
March |
49.1 |
49.8 |
50.9 |
63.9 |
55.4 |
46.7 |
47.1 |
53.4 |
|
April |
50.3 |
50.1 |
51.1 |
63.7 |
55.1 |
47.5 |
46.2 |
54.5 |
|
May |
48.6 |
48.8 |
49.8 |
60.5 |
51.9 |
49.3 |
46.8 |
53.9 |
|
June |
50.1 |
49.6 |
51.4 |
54.2 |
48.2 |
47.7 |
47.1 |
54.3 |
|
July |
49.6 |
47.5 |
49.4 |
53.2 |
47.8 |
48.6 |
45.8 |
54.1 |
|
August |
50.1 |
48.6 |
50.5 |
56.6 |
50.4 |
48.4 |
46.7 |
53.8 |
|
September |
50.0 |
49.2 |
51.0 |
60.8 |
54.0 |
47.6 |
46.0 |
53.8 |
II. Non-manufacturing Purchasing Managers’ Index
In September, the non-manufacturing business activity index was 50.2%, an increase of 1.2 percentage points from the previous month, indicating a significant recovery in the climate of non-manufacturing industries.
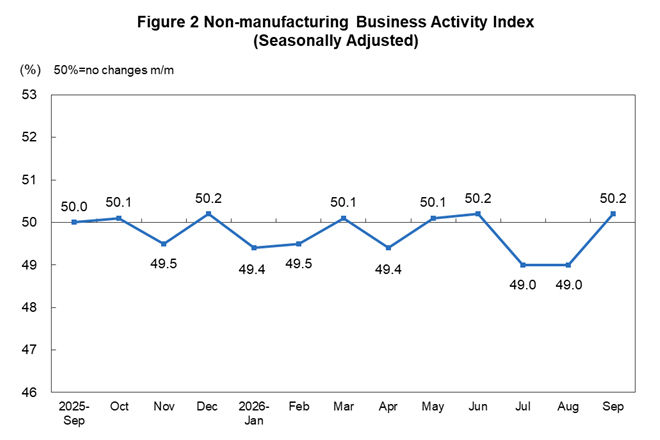
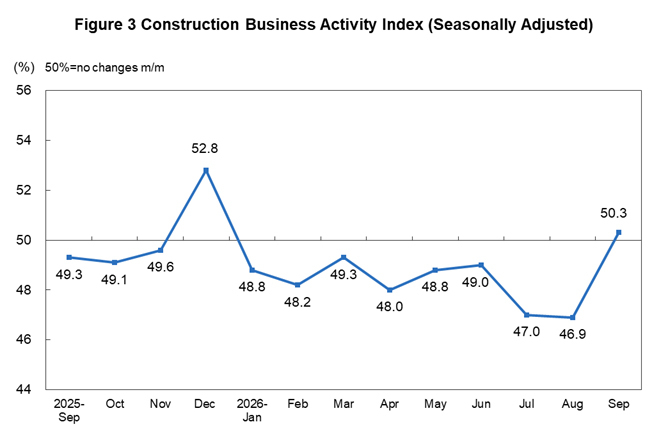
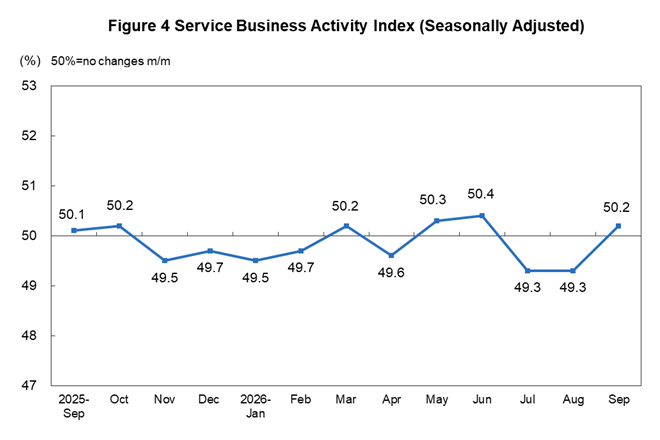
By industry, the business activity index for the construction industry was 50.3%, an increase of 3.4 percentage points from the previous month; that for the service industry was 50.2%, an increase of 0.9 percentage points from the previous month. In terms of the service industry, the business activity indexes for telecommunication, radio, television and satellite transmission services, monetary and financial services and insurance were all in the relatively high climate range of above 55.0%; those for capital market services and real estate were all below the threshold.
The new order index was 46.5%, an increase of 2.4 percentage points from the previous month, indicating a recovery in the market demand climate of the non-manufacturing industry. By industry, the new order index for the construction industry was 45.7%, an increase of 3.3 percentage points from the previous month; that for the service industry was 46.7%, an increase of 2.2 percentage points from the previous month.
The input price index was 52.5%, an increase of 1.4 percentage points from the previous month, indicating a continued increase in overall input prices for business operations among non-manufacturing enterprises. By industry, the input price index for the construction industry was 54.0%, an increase of 2.8 percentage points from the previous month; that for the service industry was 52.2%, an increase of 1.1 percentage points from the previous month.
The sales price index was 50.3%, an increase of 1.0 percentage point from the previous month, indicating a recovery in overall sales prices of non-manufacturing enterprises. By industry, the sales price index for the construction industry was 48.5%, a decrease of 1.3 percentage points from the previous month; that for the service industry was 50.6%, an increase of 1.4 percentage points from the previous month.
The employment index was 45.9%, an increase of 0.5 percentage points from the previous month, indicating an improvement in the employment climate among non-manufacturing enterprises. By industry, the employment index for the construction industry was 44.3%, an increase of 1.3 percentage points from the previous month; that for the service industry was 46.2%, an increase of 0.4 percentage points from the previous month.
The business activity expectation index was 55.5%, an increase of 0.5 percentage points from the previous month, indicating that non-manufacturing enterprises became more confident about market development. By industry, the business activity expectation index for the construction industry was 55.4%, an increase of 3.6 percentage points from the previous month; that for the service industry was 55.5%, unchanged from the previous month.
Table 3 Main Sub-indexes of China’s Non-manufacturing PMI (Seasonally Adjusted)
|
Unit: % | ||||||
|
|
Business Activity Index |
New Order Index |
Input Price Index |
Sales Price Index |
Employment Index |
Business Activity Expectation Index |
|
2025-September |
50.0 |
46.0 |
49.0 |
47.3 |
45.0 |
55.7 |
|
October |
50.1 |
46.0 |
49.4 |
47.8 |
45.2 |
56.1 |
|
November |
49.5 |
45.7 |
50.4 |
49.1 |
45.3 |
56.2 |
|
December |
50.2 |
47.3 |
50.2 |
48.0 |
46.1 |
56.5 |
|
2026-January |
49.4 |
46.1 |
50.0 |
48.8 |
46.1 |
56.0 |
|
February |
49.5 |
45.2 |
50.9 |
48.8 |
46.0 |
55.0 |
|
March |
50.1 |
45.0 |
52.3 |
49.9 |
45.2 |
54.2 |
|
April |
49.4 |
44.3 |
51.7 |
48.1 |
45.5 |
54.7 |
|
May |
50.1 |
45.0 |
52.2 |
48.8 |
45.6 |
54.8 |
|
June |
50.2 |
48.0 |
49.7 |
48.4 |
45.8 |
55.3 |
|
July |
49.0 |
44.4 |
49.7 |
47.9 |
45.4 |
55.4 |
|
August |
49.0 |
44.1 |
51.1 |
49.3 |
45.4 |
55.0 |
|
September |
50.2 |
46.5 |
52.5 |
50.3 |
45.9 |
55.5 |
Table 4 Other Sub-indexes of China’s Non-manufacturing PMI (Seasonally Adjusted)
|
Unit: % | ||||
|
|
New Export Order Index |
Existing Order Index |
Inventory Index |
Supplier Delivery Time Index |
|
2025-September |
49.8 |
44.4 |
44.9 |
51.1 |
|
October |
46.2 |
43.6 |
46.0 |
50.9 |
|
November |
47.9 |
43.6 |
44.8 |
51.2 |
|
December |
47.5 |
43.5 |
45.2 |
51.3 |
|
2026-January |
46.9 |
42.5 |
44.8 |
51.1 |
|
February |
44.7 |
42.3 |
45.4 |
50.5 |
|
March |
48.8 |
43.2 |
43.5 |
51.5 |
|
April |
47.3 |
42.4 |
45.3 |
50.9 |
|
May |
48.1 |
43.8 |
45.1 |
51.2 |
|
June |
47.9 |
44.2 |
45.3 |
51.3 |
|
July |
47.0 |
43.3 |
45.1 |
50.9 |
|
August |
47.0 |
42.8 |
45.6 |
51.2 |
|
September |
48.5 |
43.8 |
46.3 |
51.3 |
III. Composite PMI Output Index
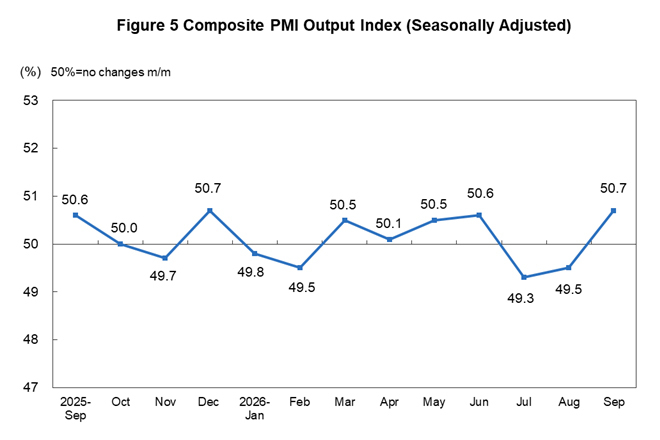
In September, the composite PMI output index was 50.7%, an increase of 1.2 percentage points from the previous month. The figure was above the threshold, indicating that the overall production and operational activities of Chinese enterprises expanded compared to the previous month.
Annotations:
1. Notes on Main Indicators
Purchasing Managers’ Index (PMI) is a composite index based on the results of the monthly survey of purchasing managers in enterprises. It encompasses various aspects, including procurement, production, and distribution, across both the manufacturing and non-manufacturing industries. It is one of the internationally recognized leading indicators for monitoring macroeconomic trends, with strong predictive and early warning functions. Composite PMI Output Index is a comprehensive indicator within the PMI indicator system that reflects the overall changes in output across all industries (manufacturing and non-manufacturing) during the current period. A PMI reading above 50% indicates an expansion in the overall economy compared to the previous month, while a reading below 50% reflects a contraction.
2. Statistical Coverage
The survey involves 3,200 samples from 31 manufacturing industries and 4,300 samples from 43 non-manufacturing industries, as classified in the Industrial Classification for National Economic Activities (GB/T 4754-2017).
3. Survey Method
The PPS (Probability Proportional to Size) sampling method is adopted in the purchasing managers’ survey, with the manufacturing and non-manufacturing industries serving as strata. The sample size for each industry is determined in proportion to its share of value added in the total value added of manufacturing or non-manufacturing industries. Within each stratum, samples are selected with probabilities proportional to the enterprises’ principal business revenue.
The survey was organized and implemented by survey teams directly affiliated with the NBS of China. The Online Reporting System of the NBS of China was used to conduct monthly survey questionnaires among the purchasing managers of the selected enterprises.
4. Calculation Methods
(1) Calculation Method of Sub-indexes. The index system of the manufacturing purchasing managers’ survey includes 13 sub-indexes, namely production, new orders, new export orders, existing orders, finished goods inventory, purchase quantity, import, main raw materials purchase price, producer price, raw materials inventory, employment, supplier delivery time, and production and operation expectation indexes. The index system of the non-manufacturing purchasing managers’ survey includes 10 sub-indexes, namely business activities, new orders, new export orders, existing orders, inventory, input price, sales price, employment, supplier delivery time, and business activity expectation indexes. Sub-indexes adopt the diffusion index calculation method, i.e., the percentage of enterprises with positive answers plus half of the percentage of those with the same answers. Since there is no composite index for the non-manufacturing industry, the business activity index is generally adopted internationally to reflect the overall changes in non-manufacturing economic development.
(2) Calculation Method of Manufacturing PMI. Manufacturing PMI is a weighted composite index calculated from five diffusion indexes (sub-indexes). Five sub-indexes and their weights are determined in accordance with their leading impact on the economy. Specifically, the new order index weights 30%; the production index weights 25%; the employment index weights 20%; the supplier delivery time index weights 15%; the raw materials inventory index weights 10%. Among them, the supplier delivery time index is an inverted index, which is inversely calculated when compiling the manufacturing PMI.
(3) Calculation Method of Composite PMI Output Index. Composite PMI Output Index is calculated as a weighted sum of the manufacturing production index and the non-manufacturing business activity index. Their weights are respectively determined by the proportion of manufacturing and non-manufacturing industries in GDP.
5. Seasonal Adjustments
The purchasing managers’ survey is conducted on a monthly basis. Due to the influence of seasonal factors, the data may fluctuate significantly. All released indexes have been seasonally adjusted.