
Energy Production in July 2026
In July, the raw coal production by industrial enterprises above the designated size fell year on year, the crude oil production shifted from decline to growth, the natural gas production remained stable, and the electricity generation remained stable and orderly.
I. Raw Coal, Crude Oil and Natural Gas Production and Related Information
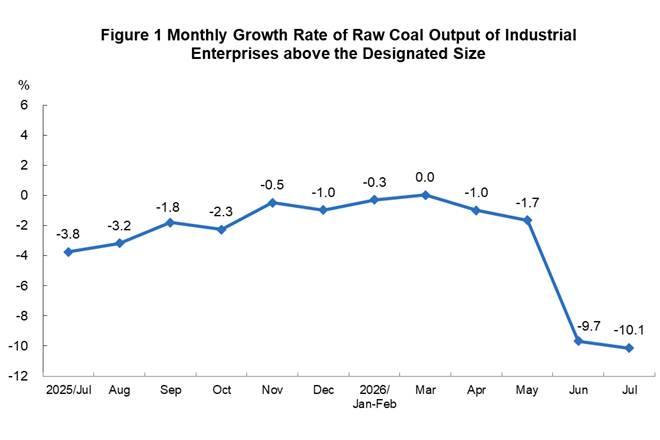
Raw coal production fell year on year. In July, the raw coal production by industrial enterprises above the designated size was 340 million tons, down by 10.1% year on year; the average daily output was 11.07 million tons.
From January to July, the raw coal production by industrial enterprises above the designated size was 2.70 billion tons, a year-on-year decrease of 2.9%.
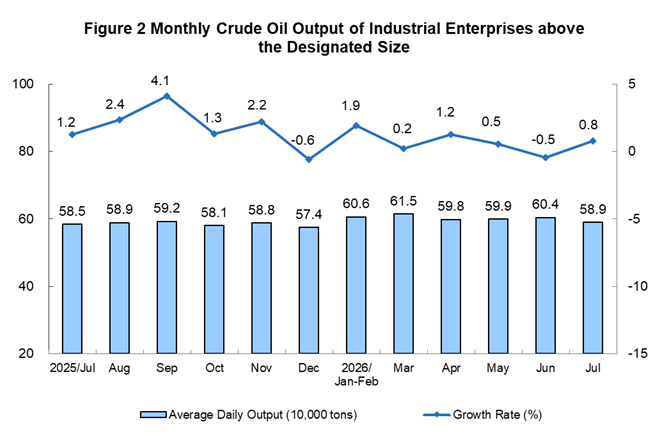
The crude oil production shifted from decline to growth. In July, the crude oil production by industrial enterprises above the designated size was 18.27 million tons, a year-on-year increase of 0.8%, compared with a 0.5% decline in June; the average daily output was 589 thousand tons.
From January to July, the crude oil production by industrial enterprises above the designated size was 127.69 million tons, a year-on-year increase of 0.9%.
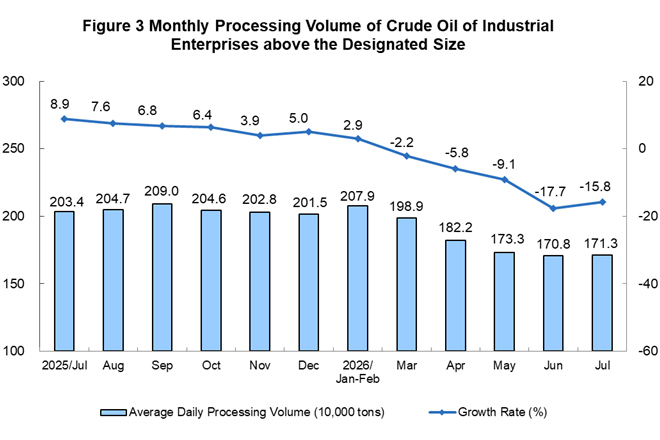
The decline in the processing volume of crude oil narrowed. In July, the processing volume of crude oil by industrial enterprises above the designated size was 53.11 million tons, a year-on-year decrease of 15.8%, with the decline narrowing by 1.9 percentage points from June; the average daily processing volume was 1.713 million tons.
From January to July, the processing volume of crude oil by industrial enterprises above the designated size was 396.96 million tons, a year-on-year decrease of 6.5%.
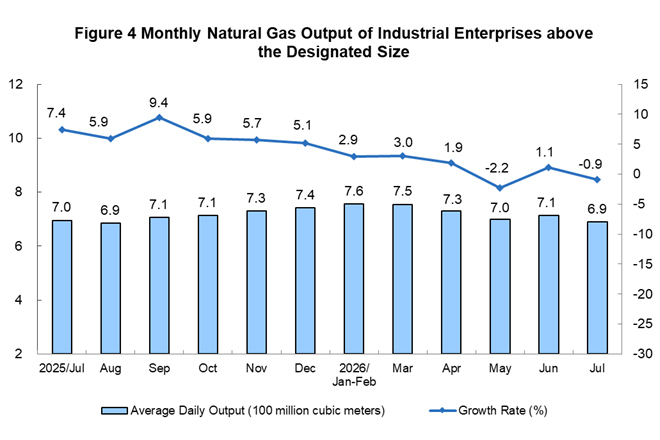
Natural gas production remained stable. In July, the production of natural gas by industrial enterprises above the designated size was 21.4 billion cubic meters, a year-on-year decrease of 0.9%; the average daily output was 690 million cubic meters.
From January to July, the production of natural gas by industrial enterprises above the designated size was 154.3 billion cubic meters, a year-on-year increase of 1.2%.
II. Electricity Generation
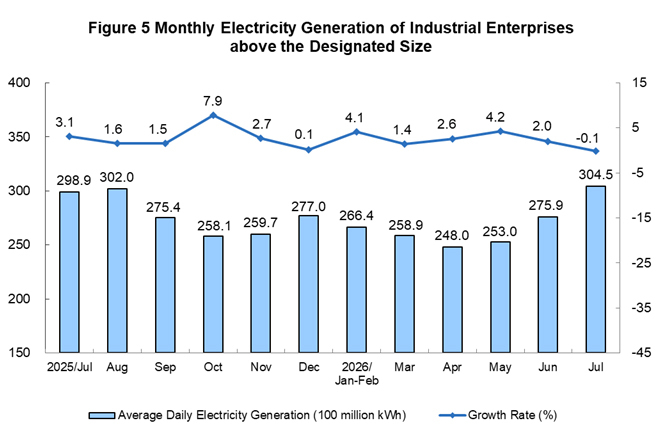
Electricity generation by industrial enterprises above the designated size remained generally stable. In July, electricity generation by industrial enterprises above the designated size was 943.9 billion kWh, down slightly by 0.1%; the average daily electricity generation was 30.45 billion kWh. From January to July, electricity generation by industrial enterprises above the designated size was 5,698.5 billion kWh, a year-on-year increase of 3.0%.
By category, in July, the growth of thermal power by industrial enterprises above the designated size shifted from growth to decline, while that of hydropower generation accelerated; the growth of nuclear power and solar power generation slowed down; and that of wind power generation shifted from decline to growth. Among them, thermal power generation by industrial enterprises above the designated size decreased by 3.5% year on year, compared with a 0.5% growth in June; hydropower generation increased by 6.7%, with the growth rate 1.9 percentage points higher than that in June; nuclear power generation increased by 6.6%, with the growth rate 1.9 percentage points lower than that in June; wind power generation increased by 4.5%, compared with a 5.6% decline in June; solar power generation increased by 5.6%, with the growth rate 8.6 percentage points lower than that in June.
Annotations:
1. Notes on Indicators
Average daily output is calculated by dividing the total output of industrial enterprises above the designated size announced in the current month by the number of calendar days in that month.
2. Statistical Coverage
The output data in this report are compiled on the basis of industrial enterprises above the designated size, which refer to industrial enterprises with an annual main business revenue of 20 million yuan or above.
As the scope of industrial enterprises above the designated size changes every year, to ensure comparability between the data of the current year and those of the previous year, the year-on-year growth rates of product output and other indicators are calculated based on the same statistical coverage of enterprises as in the current period, which is different from the coverage of data published last year.