
Total Retail Sales of Consumer Goods from January to July 2026
From January to July 2026, the total retail sales of consumer goods reached 28,774.4 billion yuan, up by 1.2% year on year. Specifically, the retail sales of consumer goods excluding automobiles reached 26,514.2 billion yuan, up by 2.7%. In July, the total retail sales of consumer goods reached 3,902.2 billion yuan, up by 0.6% year on year. Specifically, the retail sales of consumer goods excluding automobiles reached 3,589.2 billion yuan, up by 2.5%.
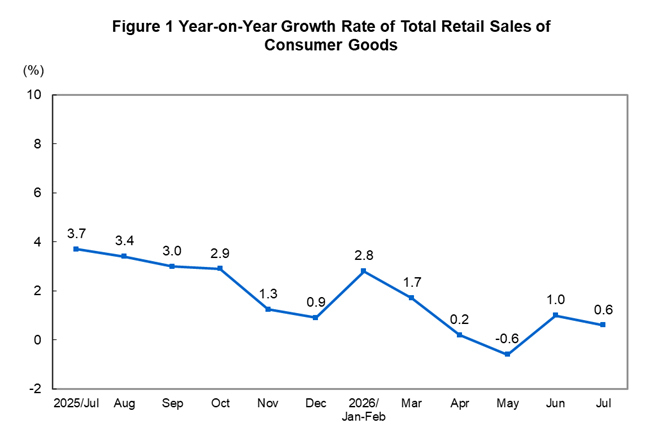
By business area, from January to July 2026, the retail sales of consumer goods in urban areas reached 24,928.5 billion yuan, up by 1.1% year on year; those in rural areas were 3,845.9 billion yuan, up by 2.4%. In July, the retail sales of consumer goods in urban areas reached 3,378.0 billion yuan, up by 0.5% year on year; those in rural areas were 524.2 billion yuan, up by 1.6%.
By consumption pattern, from January to July 2026, the retail sales of goods were 25,492.2 billion yuan, up by 1.1% year on year; the income of the catering industry was 3,282.2 billion yuan, up by 2.6%. In July, the retail sales of goods were 3,445.5 billion yuan, up by 0.5% year on year; the income of the catering industry was 456.7 billion yuan, up by 1.4%.
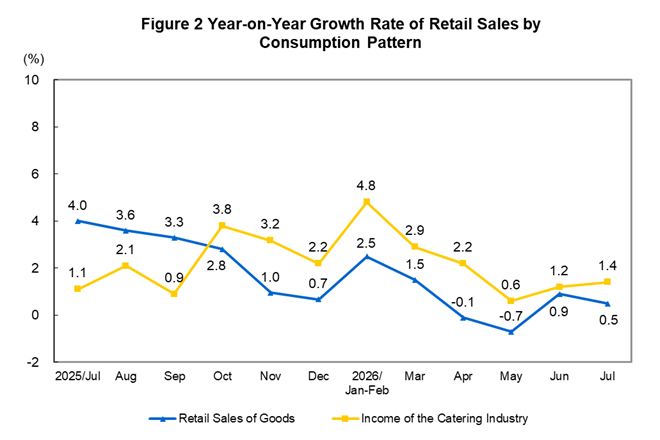
By retail format, from January to July 2026, the retail sales of convenience stores and supermarkets among retail enterprises (units) above the designated size increased by 6.1% and 3.8% year on year, respectively; those of specialty stores, department stores and brand-exclusive stores decreased by 1.8%, 2.4% and 9.3%, respectively.
From January to July 2026, China’s online retail sales of goods and services reached 11,721.4 billion yuan, up by 4.8% year on year. Specifically, the online retail sales of goods were 7,396.5 billion yuan, up by 4.6%; among the online retail sales of goods, those of food, clothing, and daily necessities increased by 16.9%, 5.8%, and 1.1%, respectively. The online retail sales of services were 4,324.9 billion yuan, up by 5.2%.
Total Retail Sales of Consumer Goods in July 2026
|
Indicator |
July |
January - July | ||
|
Absolute Value (100 million yuan) |
Growth Rate Y/Y (%) |
Absolute Value (100 million yuan) |
Growth Rate Y/Y (%) | |
|
Total retail sales of consumer goods |
39022 |
0.6 |
287744 |
1.2 |
|
Of which: Retail sales of consumer goods excluding automobiles |
35892 |
2.5 |
265142 |
2.7 |
|
Of which: Retail sales of enterprises (units) above the designated size |
14308 |
-3.4 |
108935 |
-1.1 |
|
Of which: Online retail sales of goods |
- |
- |
73965 |
4.6 |
|
By area |
|
|
|
|
|
Urban |
33780 |
0.5 |
249285 |
1.1 |
|
Rural |
5242 |
1.6 |
38459 |
2.4 |
|
By consumption pattern |
|
|
|
|
|
Income of the catering industry |
4567 |
1.4 |
32822 |
2.6 |
|
Of which: Income of the catering industry by enterprises (units) above the designated size |
1352 |
0.0 |
9678 |
1.5 |
|
Retail sales of goods |
34455 |
0.5 |
254922 |
1.1 |
|
Of which: Retail sales of goods by enterprises (units) above the designated size |
12956 |
-3.8 |
99257 |
-1.4 |
|
Of which: Grain, oil and food |
1794 |
5.3 |
13813 |
7.2 |
|
Beverage |
278 |
3.5 |
1866 |
5.6 |
|
Tobacco and liquor |
431 |
6.0 |
3966 |
12.4 |
|
Clothes, shoes, hats and textiles |
922 |
-1.0 |
8628 |
5.8 |
|
Cosmetics |
285 |
6.8 |
2723 |
6.3 |
|
Gold, silver and jewelry |
189 |
-10.1 |
2123 |
0.7 |
|
Daily necessities |
652 |
1.8 |
4973 |
4.1 |
|
Sports & recreational articles |
125 |
-10.6 |
996 |
-3.5 |
|
Household appliances and audio-video equipment |
946 |
-1.9 |
6372 |
-6.6 |
|
Traditional Chinese and Western medicines |
577 |
6.7 |
4179 |
3.8 |
|
Cultural and office appliances |
393 |
7.4 |
2834 |
6.0 |
|
Furniture |
145 |
-8.8 |
1004 |
-4.5 |
|
Telecommunication equipment |
787 |
20.4 |
6310 |
15.1 |
|
Petroleum and petroleum products |
1701 |
-7.6 |
12326 |
-5.9 |
|
Motor vehicles |
3130 |
-17.0 |
22602 |
-13.2 |
|
Building and decoration materials |
94 |
-14.2 |
690 |
-9.5 |
|
Note: The growth rates in this table are not adjusted for price factors. | ||||
Annotations:
1. Notes on Indicators
Total retail sales of consumer goods refer to the revenue of enterprises (units or self-employed individuals) from sales of non-production and non-business physical goods to individuals and social groups, as well as the income obtained from providing catering services.
Online retail sales of goods and services refer to the total retail sales of goods and services through public online trading platforms (including self-built websites and third-party platforms).
2. Statistical Coverage
Legal entities, industrial activity units, and self-employed individuals engaged in goods retail activities or providing catering services. Specifically, enterprises (units) above the designated size refer to wholesale enterprises (units or self-employed individuals) with an annual main business revenue of 20 million yuan or above, retail enterprises (units or self-employed individuals) with an annual main business revenue of 5 million yuan or above, and enterprises (units or self-employed individuals) providing accommodation and catering services with an annual main business revenue of 2 million yuan or above.
3. Survey Method
A comprehensive survey is conducted for enterprises (units) above the designated size, while a sampling survey is carried out for enterprises (units) below the designated size.
4. Statistical Standard
As the coverage of enterprises above the designated size (units or self-employed individuals) engaged in wholesale and retail trades, accommodation, and the catering industry changes every year, to ensure comparability between the data of the current year and those of the previous year, the year-on-year growth rates of the retail sales of consumer goods and other indicators for enterprises above the designated size are calculated based on the same statistical coverage of enterprises (units or self-employed individuals) as in the current period, which is different from the coverage of data published last year. The main reason is that each year, some enterprises (units or self-employed individuals) are included in the survey after reaching the designated standard, while others are excluded from the survey due to their smaller scale and failure to meet the designated standard. There are also influences from enterprises (units or self-employed individuals) that are newly established, bankrupt, and have their business licenses canceled (revoked).
As the coverage of key online platforms included in the statistics on online retail sales of goods and services changes every year, to ensure comparability between the data of the current year and those of the previous year, the year-on-year growth rate of online retail sales of goods and services is calculated based on the same statistical coverage of platforms as in the current period, which is different from the coverage of data published last year. The main reason is that every year, some platforms are included in the survey, while others are excluded due to failure to meet the requirements of statistical rules.
5. Revision of Month-on-Month Data
In accordance with the automatic correction results based on the seasonal adjustment model, the month-on-month growth rates of total retail sales of consumer goods since July 2025 have been revised. The revised results and the month-on-month data of July 2026 are as follows:
|
Year |
Month |
Growth Rate M/M (%) |
|
2025 |
July |
0.01 |
|
August |
0.18 | |
|
September |
-0.08 | |
|
October |
0.15 | |
|
November |
-0.10 | |
|
December |
-0.01 | |
|
2026 |
January |
0.18 |
|
February |
0.23 | |
|
March |
0.10 | |
|
April |
-0.27 | |
|
May |
-0.15 | |
|
June |
0.35 | |
|
July |
0.06 |
6. Explanation of Adjustments to Indicators
To reflect the development of the online consumption market in a more comprehensive way, the statistical indicators for online consumption have been improved, with the coverage of the online service platforms expanded to strengthen the measurement of the online services retail sales in line with the evolving momentum of online consumption. Accordingly, the original indicator “online retail sales” has been adjusted to “online retail sales of goods and services”, with the definition unchanged and the statistical coverage expanded. The indicator “online retail sales of physical goods” has been adjusted to “online retail sales of goods,” with the definition and statistical coverage unchanged, and the indicator “online retail sales of services” has been introduced as a new indicator. The online retail sales of goods and services are not comparable with the online retail sales.