
Profits of Industrial Enterprises above the Designated Size from January to June in 2026
From January to June, the total profits of industrial enterprises above the designated size nationwide reached 3,947.99 billion yuan, a year-on-year increase of 18.7% (calculated on a comparable basis, see Annotation 2 for details).
From January to June, among industrial enterprises above the designated size, state-holding enterprises realized a total profit of 1,307.74 billion yuan, a year-on-year increase of 17.9%; share-holding enterprises realized a total profit of 3,044.32 billion yuan, an increase of 24.7%; enterprises funded by foreign investors and investors from Hong Kong, Macao and Taiwan realized a total profit of 887.32 billion yuan, an increase of 2.6%; private enterprises realized a total profit of 965.56 billion yuan, an increase of 13.0%.
From January to June, the mining industry realized a total profit of 574.50 billion yuan, a year-on-year increase of 33.5%; the manufacturing industry realized a total profit of 2,971.21 billion yuan, an increase of 20.1%; the production and supply of electricity, heat power, gas and water realized a total profit of 402.27 billion yuan, a decrease of 4.2%.
From January to June, the profits of main industries were as follows: the profit of the smelting and pressing of non-ferrous metals increased by 99.4% year on year, that of the manufacture of computers, communication equipment and other electronic equipment increased by 96.9%, that of the manufacture of raw chemical materials and chemical products increased by 67.8%, that of the mining and washing of coal increased by 41.1%, that of the extraction of petroleum and natural gas increased by 16.6%, that of the textile industry increased by 16.6%, that of the manufacture of general-purpose machinery increased by 1.5%, that of the manufacture of special-purpose machinery decreased by 0.1%, that of the production and supply of electricity and heat power decreased by 6.2%, that of the manufacture of electrical machinery and apparatus decreased by 8.6%, that of the processing of food from agricultural and sideline products decreased by 12.0%, that of the manufacture of automobiles decreased by 19.5%, that of the smelting and pressing of ferrous metals decreased by 25.0%, that of the manufacture of non-metallic mineral products decreased by 47.8%, and the processing of petroleum, coal and other fuels turned from loss to profit.
From January to June, industrial enterprises above the designated size achieved a business revenue of 69.26 trillion yuan, a year-on-year increase of 6.5%; the operating costs incurred were 58.80 trillion yuan, an increase of 5.9%; the profit rate of business revenue was 5.70%, a year-on-year increase of 0.59 percentage points.
At the end of June, the assets of industrial enterprises above the designated size totaled 194.60 trillion yuan, a year-on-year increase of 6.1%; the liabilities totaled 113.52 trillion yuan, an increase of 6.6%; the owners’ equity totaled 81.08 trillion yuan, an increase of 5.4%; the asset-liability ratio was 58.3%, a year-on-year increase of 0.3 percentage points.
At the end of June, the accounts receivable of industrial enterprises above the designated size totaled 28.60 trillion yuan, a year-on-year increase of 8.1%; the inventory of finished goods was 7.11 trillion yuan, an increase of 9.5%.
From January to June, the costs for per-hundred-yuan business revenue of industrial enterprises above the designated size were 84.89 yuan, a year-on-year decrease of 0.55 yuan; the expenses for per-hundred-yuan business revenue were 8.45 yuan, a year-on-year decrease of 0.06 yuan.
At the end of June, the business revenue brought by per-hundred-yuan assets of industrial enterprises above the designated size was 72.3 yuan, a year-on-year increase of 0.5 yuan; the per capita business revenue was 1.913 million yuan, a year-on-year increase of 127 thousand yuan; the turnover days of finished goods inventory were 21.1 days, a year-on-year increase of 0.4 days; the average collection period for accounts receivable was 71.7 days, a year-on-year increase of 0.8 days.
In June, the profits of industrial enterprises above the designated size increased by 15.1% year on year.
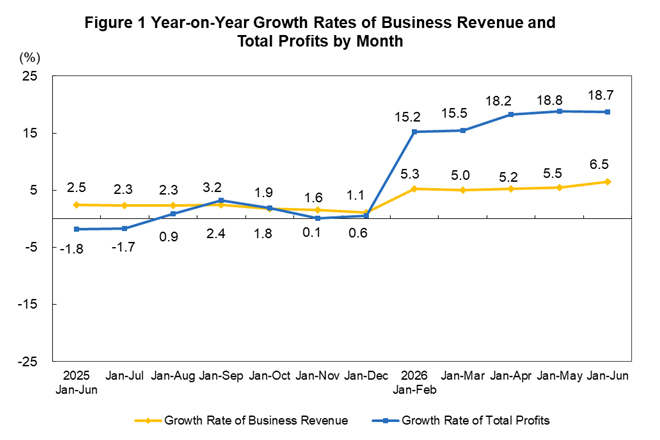
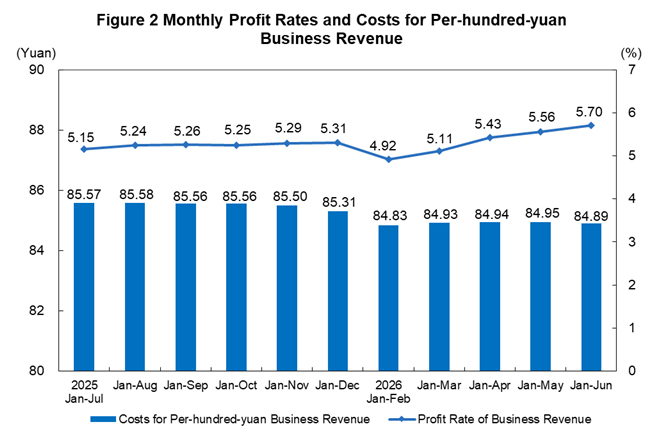
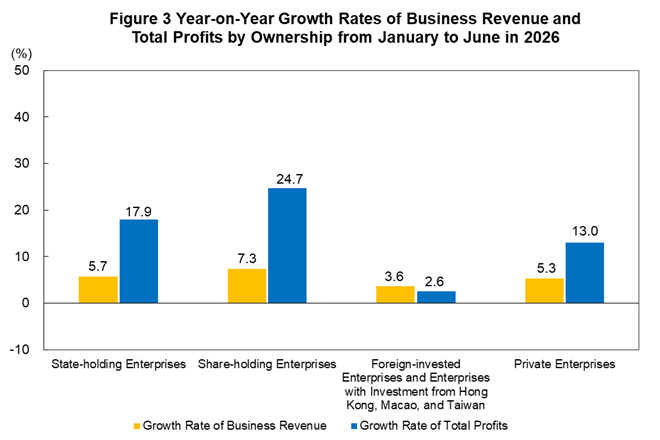
Table 1 Key Financial Indicators of Industrial Enterprises above the Designated Size from January to June in 2026
|
Category |
Business Revenue |
Operating Costs |
Total Profits | |||
|
Amount (100 million yuan) |
Growth Rate Y/Y (%) |
Amount (100 million yuan) |
Growth Rate Y/Y (%) |
Amount (100 million yuan) |
Growth Rate Y/Y (%) | |
|
Total |
692614.2 |
6.5 |
587953.3 |
5.9 |
39479.9 |
18.7 |
|
Of which: Mining |
27304.0 |
8.5 |
17725.8 |
2.6 |
5745.0 |
33.5 |
|
Manufacturing |
603279.2 |
7.1 |
514712.9 |
6.4 |
29712.1 |
20.1 |
|
Production and supply of electricity, heat power, gas and water |
62031.0 |
1.0 |
55514.5 |
1.8 |
4022.7 |
-4.2 |
|
Of which: State-holding enterprises |
191657.4 |
5.7 |
159866.3 |
5.0 |
13077.4 |
17.9 |
|
Of which: Share-holding enterprises |
562635.6 |
7.3 |
479158.5 |
6.5 |
30443.2 |
24.7 |
|
Enterprises funded by foreign investors and investors from Hong Kong, Macao and Taiwan |
127016.6 |
3.6 |
106289.9 |
3.4 |
8873.2 |
2.6 |
|
Of which: Private enterprises |
241468.4 |
5.3 |
208112.9 |
5.0 |
9655.6 |
13.0 |
|
Notes: 1. Due to overlap between ownership categories, the sum of sub-items is greater than the total. 2. Due to rounding and without mechanical adjustment, the sub-items may not add up to the total. | ||||||
Table 2 Performance Indicators of Industrial Enterprises above the Designated Size from January to June in 2026
|
Category |
Profit Rate of Business Revenue |
Costs for per-hundred-yuan Business Revenue |
Expenses for per-hundred-yuan Business Revenue |
Business Revenue Brought by per-hundred-yuan Assets |
Per Capita Business Revenue |
Asset-Liability Ratio |
Turnover Days of Finished Goods Inventory |
Average Collection Period for Accounts Receivable |
|
Jan-Jun |
Jan-Jun |
Jan-Jun |
By the end of June |
By the end of June |
By the end of June |
By the end of June |
By the end of June | |
|
(%) |
(yuan) |
(yuan) |
(yuan) |
(10 thousand yuan/person) |
(%) |
(days) |
(days) | |
|
Total |
5.70 |
84.89 |
8.45 |
72.3 |
191.3 |
58.3 |
21.1 |
71.7 |
|
Of which: Mining |
21.04 |
64.92 |
9.43 |
36.7 |
143.3 |
57.1 |
15.5 |
53.5 |
|
Manufacturing |
4.93 |
85.32 |
8.74 |
85.1 |
184.8 |
58.0 |
23.5 |
73.3 |
|
Production and supply of electricity, heat power, gas and water |
6.48 |
89.49 |
5.18 |
35.6 |
374.7 |
60.4 |
1.2 |
63.4 |
|
Of which: State-holding enterprises |
6.82 |
83.41 |
5.86 |
53.8 |
328.0 |
57.7 |
12.6 |
55.6 |
|
Of which: Share-holding enterprises |
5.41 |
85.16 |
8.23 |
71.0 |
190.5 |
59.4 |
21.3 |
69.5 |
|
Enterprises funded by foreign investors and investors from Hong Kong, Macao and Taiwan |
6.99 |
83.68 |
9.44 |
79.0 |
198.5 |
53.0 |
19.9 |
81.3 |
|
Of which: Private enterprises |
4.00 |
86.19 |
9.95 |
90.7 |
139.7 |
59.8 |
26.6 |
75.6 |
Table 3 Key Financial Indicators of Industrial Enterprises above the Designated Size from January to June in 2026 (By Industry)
|
Industry |
Business Revenue |
Operating Costs |
Total Profits | |||
|
Amount |
Growth Rate Y/Y |
Amount |
Growth Rate Y/Y |
Amount |
Growth Rate Y/Y | |
|
(100 million yuan) |
(%) |
(100 million yuan) |
(%) |
(100 million yuan) |
(%) | |
|
Total |
692614.2 |
6.5 |
587953.3 |
5.9 |
39479.9 |
18.7 |
|
Mining and washing of coal |
13598.0 |
9.3 |
9474.0 |
4.7 |
2107.2 |
41.1 |
|
Extraction of petroleum and natural gas |
6535.0 |
12.8 |
3422.5 |
8.7 |
2115.9 |
16.6 |
|
Mining and processing of ferrous metal ores |
2147.1 |
-6.1 |
1692.8 |
-7.0 |
255.8 |
4.7 |
|
Mining and processing of non-ferrous metal ores |
2648.2 |
34.2 |
1230.4 |
8.7 |
1074.7 |
80.0 |
|
Mining and processing of non-metal ores |
1402.1 |
-10.3 |
1007.2 |
-9.4 |
149.3 |
10.1 |
|
Professional and support activities for mining |
972.4 |
-11.4 |
897.9 |
-12.0 |
42.0 |
136.0 |
|
Mining of other ores |
1.2 |
-20.0 |
0.9 |
-18.2 |
0.1 |
0.0 |
|
Processing of food from agricultural and sideline products |
25046.4 |
3.3 |
23270.5 |
3.5 |
479.6 |
-12.0 |
|
Manufacture of foods |
10955.8 |
5.4 |
8603.2 |
5.4 |
865.9 |
4.6 |
|
Manufacture of liquor, beverages and refined tea |
6954.9 |
-7.0 |
4534.6 |
-4.6 |
1113.3 |
-17.7 |
|
Manufacture of tobacco |
8481.6 |
2.5 |
2356.9 |
2.8 |
1149.7 |
-0.4 |
|
Textile industry |
10594.5 |
2.6 |
9435.9 |
2.2 |
288.4 |
16.6 |
|
Manufacture of textile, wearing apparel and accessories |
4771.0 |
-2.8 |
4030.0 |
-3.6 |
122.1 |
-28.0 |
|
Manufacture of leather, fur, feather and related products and footwear |
3233.3 |
-3.8 |
2799.5 |
-3.8 |
108.4 |
-15.2 |
|
Processing of timber, manufacture of wood, bamboo, rattan, palm and straw products |
3103.9 |
-13.9 |
2853.0 |
-13.6 |
51.7 |
-33.7 |
|
Manufacture of furniture |
2576.1 |
-8.6 |
2142.5 |
-8.1 |
45.7 |
-52.7 |
|
Manufacture of paper and paper products |
6897.9 |
5.5 |
6077.3 |
5.2 |
196.1 |
27.5 |
|
Printing and reproduction of recording media |
2971.2 |
0.9 |
2482.1 |
1.1 |
119.8 |
-13.8 |
|
Manufacture of articles for culture, education, arts and crafts, sport and entertainment activities |
5991.5 |
-5.5 |
5262.6 |
-6.2 |
164.6 |
-13.8 |
|
Processing of petroleum, coal and other fuels |
26510.7 |
4.6 |
22155.9 |
2.0 |
432.9 |
(Note 1) |
|
Manufacture of raw chemical materials and chemical products |
47072.7 |
10.0 |
40140.1 |
7.8 |
2880.9 |
67.8 |
|
Manufacture of medicines |
11717.8 |
0.0 |
6704.3 |
0.8 |
1773.2 |
4.2 |
|
Manufacture of chemical fibers |
5078.5 |
0.2 |
4572.4 |
-2.7 |
222.0 |
102.0 |
|
Manufacture of rubber and plastic products |
15033.9 |
3.0 |
12692.0 |
2.5 |
692.4 |
-1.1 |
|
Manufacture of non-metallic mineral products |
19111.8 |
-9.1 |
16449.2 |
-8.7 |
296.7 |
-47.8 |
|
Smelting and pressing of ferrous metals |
36770.2 |
-0.6 |
35007.0 |
-0.4 |
317.7 |
-25.0 |
|
Smelting and pressing of non-ferrous metals |
55049.0 |
21.2 |
50711.3 |
18.4 |
3109.1 |
99.4 |
|
Manufacture of metal products |
22885.1 |
4.1 |
20372.5 |
4.3 |
605.1 |
-10.0 |
|
Manufacture of general-purpose machinery |
25430.1 |
5.7 |
20677.9 |
5.7 |
1626.1 |
1.5 |
|
Manufacture of special-purpose machinery |
19103.3 |
7.0 |
14895.3 |
7.2 |
1242.5 |
-0.1 |
|
Manufacture of automobiles |
51893.2 |
1.8 |
46100.3 |
2.8 |
1953.5 |
-19.5 |
|
Manufacture of railway, ship, aerospace and other transport equipment |
9065.2 |
12.4 |
7486.3 |
11.6 |
737.7 |
13.2 |
|
Manufacture of electrical machinery and apparatus |
59365.1 |
9.7 |
51603.7 |
10.4 |
2598.3 |
-8.6 |
|
Manufacture of computers, communication equipment and other electronic equipment |
94078.2 |
18.5 |
79832.0 |
15.4 |
5777.1 |
96.9 |
|
Manufacture of measuring instruments and machinery |
5357.2 |
6.2 |
3975.9 |
6.2 |
461.7 |
-5.1 |
|
Other manufacture |
1046.7 |
6.6 |
857.5 |
6.2 |
52.3 |
-1.9 |
|
Utilization of waste resources |
5705.0 |
3.2 |
5411.0 |
1.9 |
127.4 |
104.5 |
|
Repair service of metal products, machinery and equipment |
1427.5 |
12.8 |
1220.2 |
13.7 |
100.3 |
26.3 |
|
Production and supply of electricity and heat power |
48134.1 |
0.9 |
43006.1 |
1.9 |
3352.8 |
-6.2 |
|
Production and supply of gas |
11643.2 |
2.0 |
10867.3 |
2.0 |
480.0 |
8.9 |
|
Production and supply of water |
2253.7 |
-0.3 |
1641.1 |
-0.2 |
190.0 |
4.2 |
|
Notes: 1. As the processing of petroleum, coal and other fuels recorded losses in the same period last year, the year-on-year growth rate cannot be calculated. 2. Due to rounding and without mechanical adjustments, the sub-items may not add up to the total. | ||||||
Annotations:
I. Notes on Indicators
1. Total profits: refer to the surplus of total revenue after deducting total costs and expenses from the production and operation of enterprises, reflecting the overall profit and loss of enterprises during the reporting period.
2. Business revenue: refers to the inflow of economic benefits from the production and operation of enterprises, such as selling goods, providing labor services and transferring the right to use assets. It includes the revenue from the main business and other business operations.
3. Operating costs: refer to the actual costs from the production and operation of enterprises, such as selling goods, providing labor services and transferring the right to use assets. They include the costs incurred by the main business and other business operations. Operating costs should be matched with business revenue.
4. Total assets: refer to the resources derived from past transactions or events, owned or controlled by an enterprise, and expected to bring economic benefits to the enterprise.
5. Total liabilities: refer to the current obligations generated from past transactions or events of an enterprise, and expected to result in an outflow of economic benefits from the enterprise.
6. Total owners’ equity: refers to the residual equity in the assets of an enterprise after deducting liabilities, which belongs to the owners.
7. Accounts receivable: refers to the amount that should be collected by an enterprise for its business activities, such as selling goods and providing services, measured at amortized cost on the balance sheet date.
8. Inventory of finished goods: refers to products, with all production processes having been finished by enterprises, that are accepted and stored after inspection, can be delivered to ordering units according to terms in the contract, or can be taken as goods for external sale; as well as various goods purchased or processed by external parties, which have been accepted and stored for sale.
9. Profit rate of business revenue = total profits / business revenue × 100%, unit: %.
10. Costs for per-hundred-yuan business revenue = operating costs / business revenue ×100, unit: yuan.
11. Expenses for per-hundred-yuan business revenue = (selling expenses + administrative expenses + R&D expenses + financial expenses) / business revenue ×100, unit: yuan.
12. Business revenue brought by per-hundred-yuan assets = business revenue / average assets / the cumulative number of months × 12 × 100, unit: yuan.
13. Per capita business revenue = business revenue / the average number of employees / the cumulative number of months × 12, unit: 10 thousand yuan / person.
14. Asset-liability ratio = total liabilities / total assets × 100%, unit: %.
15. Turnover days of finished goods inventory = 360 × average finished goods inventory / operating costs × the cumulative number of months / 12, unit: days.
16. Average collection period for accounts receivable = 360 × average accounts receivable / business revenue × the cumulative number of months / 12, unit: days.
17. In the columns of year-on-year growth rate of total profits in the tables above, the “note” refers to negative total profits in the same period last year, which means loss, or 0.0 billion yuan; a positive value refers to a year-on-year increase of profits; a negative value between 0 and –100% (exclusive of 0) refers to a year-on-year decrease of profits; a decline of more than 100% indicates a turnaround from profit in the same period of the previous year to loss in the current period; a value of 0 indicates that the profits remain at the same level as last year.
II. The growth rates of indicators such as the total profits and business revenue of industrial enterprises above the designated size are calculated on a comparable basis. There are incomparable factors between the data in the reporting period and the corresponding data published in the previous year, which cannot be directly compared to calculate the growth rate. The main reasons are: (1) According to the statistical policy, the survey scope of industrial enterprises above the designated size is adjusted regularly every year. Each year, some companies are included in the survey after having reached the designated size, and some exit the survey due to their smaller size. Changes also include enterprises that are newly established, those that go bankrupt, and those with their business licenses cancelled (revoked). (2) Statistical enforcement has been strengthened. Enterprises found in statistical inspections that failed to meet the requirements for industrial enterprises above the designated size were removed from the survey, and the relevant base figures were revised in accordance with regulations. (3) Data quality management has been strengthened by eliminating duplicate statistical data across regions and industries.
III. Statistical Coverage
Industrial enterprises above the designated size refer to industrial legal entities with annual revenue from the main business of 20 million yuan and above.
IV. Survey Method
Financial reports of industrial enterprises above the designated size are subject to a comprehensive monthly survey (the data of January is exempted).
V. Industrial Classification Standard
The Industrial Classification for National Economic Activities (GB/T 4754-2017) was implemented.