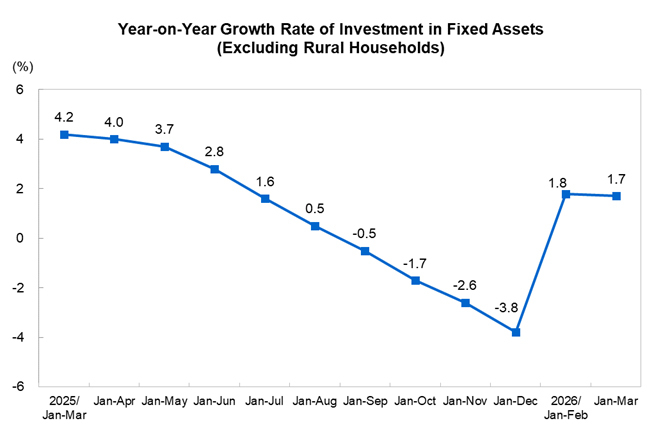
Investment in Fixed Assets from January to March 2026
From January to March 2026, the national investment in fixed assets (excluding rural households) was 10,270.8 billion yuan, a year-on-year increase of 1.7% (calculated on a comparable basis, see Annotation 7 for details). Specifically, non-governmental investment in fixed assets decreased by 2.2% year on year. On a month-on-month basis, the investment in fixed assets (excluding rural households) increased by 0.52% in March.
By industry, the investment in the primary industry was 233.4 billion yuan, a year-on-year increase of 15.9%; the investment in the secondary industry was 3,676.5 billion yuan, up 5.8%; and the investment in the tertiary industry was 6,360.8 billion yuan, down 1.0%.
The industrial investment increased by 5.8% year on year. Specifically, the investment in mining increased by 15.0%, the investment in manufacturing increased by 4.1%, and the investment in production and supply of electricity, heat power, gas and water increased by 9.0%.
The investment in infrastructure (see Annotation 1 for details of statistical scope) increased by 8.9% year on year. Specifically, the investment in civil aviation transportation increased by 43.3%, the investment in waterway transportation increased by 34.1%, the investment in the production and supply of electricity and heat power increased by 9.2%, and the investment in ecological conservation and environmental governance increased by 9.0%.
By region, the investment in the eastern region increased by 0.7% year on year, the investment in the central region increased by 1.9%, the investment in the western region increased by 1.0%, and the investment in the northeastern region decreased by 10.0%.
By statistical category of registration, the investment in fixed assets of domestic-invested enterprises increased by 2.1% year on year, the investment in fixed assets of enterprises funded by investors from Hong Kong, Macao, and Taiwan decreased by 5.0%, and the investment in fixed assets of foreign-invested enterprises decreased by 6.3%.
Investment in Fixed Assets (Excluding Rural Households) from January to March 2026
|
Indicator |
Growth Rate Y/Y (%) |
|
Investment in Fixed Assets (Excluding Rural Households) |
1.7 |
|
Of which: State-holding |
7.1 |
|
Of which: Non-governmental investment |
-2.2 |
|
By constitution |
|
|
Construction and installation |
-0.4 |
|
Purchase of equipment and instruments |
13.9 |
|
Other expenses |
-1.7 |
|
By industry |
|
|
Primary industry |
15.9 |
|
Secondary industry |
5.8 |
|
Tertiary industry |
-1.0 |
|
By sector |
|
|
Agriculture, forestry, animal husbandry and fishery |
15.2 |
|
Mining |
15.0 |
|
Manufacturing |
4.1 |
|
Of which: Processing of food from agricultural and sideline products |
5.5 |
|
Manufacture of foods |
0.7 |
|
Textile industry |
17.6 |
|
Manufacture of raw chemical materials and chemical products |
0.4 |
|
Manufacture of medicines |
-7.7 |
|
Smelting and pressing of non-ferrous metals |
3.7 |
|
Manufacture of metal products |
5.5 |
|
Manufacture of general-purpose machinery |
12.5 |
|
Manufacture of special-purpose machinery |
-0.4 |
|
Manufacture of automobiles |
4.8 |
|
Manufacture of railway, ship, aerospace and other transport equipment |
27.7 |
|
Manufacture of electrical machinery and apparatus |
0.8 |
|
Manufacture of computers, communication equipment and other electronic equipment |
5.4 |
|
Production and supply of electricity, heat power, gas and water |
9.0 |
|
Transport, storage and post |
16.3 |
|
Of which: Road transportation |
2.9 |
|
Water conservancy, environment and public facilities management |
3.6 |
|
Of which: Management of water conservancy |
-5.5 |
|
Management of public facilities |
5.7 |
|
Education |
-7.9 |
|
Health and social services |
-9.7 |
|
Culture, sports and entertainment |
-5.4 |
|
By statistical category of registration |
|
|
Of which: Domestic-invested enterprises |
2.1 |
|
Enterprises funded by investors from Hong Kong, Macao, and Taiwan |
-5.0 |
|
Foreign-invested enterprises |
-6.3 |
|
Note: The growth rates in this table are not adjusted for price factors. | |
Annotations:
1. Notes on Indicators
Investment in fixed assets (excluding rural households): It is a general term representing the monetary value of the workload completed in a certain period concerning the construction and acquisition of fixed assets, as well as the related expenses.
Investment in infrastructure: In accordance with current statistical rules, investment in infrastructure includes fixed-asset investment in the following sectors: production and supply of electricity and heat power; production and supply of gas; production and supply of water; railway transportation; road transportation; waterway transportation; civil aviation transportation; pipeline transportation; multimodal transportation and transport agency industry; loading, unloading and handling; post; telecommunication, radio, television and satellite transmission services; Internet and related services; management of water conservancy; ecological conservation and environmental governance; and management of public facilities. The growth rate of investment in infrastructure is calculated on a comparable basis.
State-holding enterprises: Absolute state-holding where the proportion of the paid-in capital (equity) owned by contributors with a state-owned economic component in the total paid-in capital (equity) of the enterprise is greater than 50%.
Relative state-holding where the proportion of the paid-in capital (equity) owned by contributors with state-owned economic component in the total paid-in capital (equity) of the enterprise is no greater than 50%, but is more than the proportion of contributors with any other economic component; or state-holding by agreement where the proportion of contributors with state-owned economic component is no greater than that of contributors with other economic component, but the actual control of the enterprise is exercised by contributors with state-owned economic component according to the agreement.
For enterprises in which both parties each hold 50% and no absolute controlling party is specified, if one of the parties is a state-owned economic component, the enterprise shall be classified as state-holding.
The investment projects of administrative and public institutions are state-holding.
Statistical category of registration: The classification is conducted in accordance with the Regulations on the Statistical Classification of Market Entities (Guotongzi [2023] No.14), jointly issued by the National Bureau of Statistics of China and the State Administration for Market Regulation.
2. Statistical Coverage
Investment in fixed asset projects with a total planned investment of 5 million yuan or more, as well as investment in all real estate development projects.
3. Survey Method
Statistics on investment in fixed assets are collected through a comprehensive monthly survey (with reporting exempted for January).
4. Definition of Eastern, Central, Western and Northeastern Regions
The eastern region includes 10 provinces (municipalities), namely, Beijing, Tianjin, Hebei, Shanghai, Jiangsu, Zhejiang, Fujian, Shandong, Guangdong, and Hainan; the central region includes 6 provinces, namely, Shanxi, Anhui, Jiangxi, Henan, Hubei, and Hunan; the western region includes 12 provinces (municipalities and autonomous regions), namely, Inner Mongolia, Guangxi, Chongqing, Sichuan, Guizhou, Yunnan, Xizang, Shaanxi, Gansu, Qinghai, Ningxia, and Xinjiang; the northeastern region includes 3 provinces, namely, Liaoning, Jilin and Heilongjiang.
5. Industrial Classification Standard
The Industrial Classification for National Economic Activities (GB/T 4754-2017) was implemented.
6. Revision of Month-on-Month Data
According to the results of automatic correction based on the seasonal adjustment model, the month-on-month growth rates of investment in fixed assets (excluding rural households) since March 2025 have been revised. The revised results and month-on-month data for March 2026 are as follows:
|
Year |
Months |
Growth Rate M/M (%) |
|
2025 |
March |
-1.90 |
|
April |
-0.02 | |
|
May |
-0.50 | |
|
June |
-0.40 | |
|
July |
-1.07 | |
|
August |
-0.51 | |
|
September |
0.01 | |
|
October |
-0.64 | |
|
November |
-0.03 | |
|
December |
-0.62 | |
|
2026 |
January |
1.68 |
|
February |
0.99 | |
|
March |
0.52 |
7. Explanation of Year-on-Year Growth Rate
In accordance with the reform of investment statistical methods, statistical law enforcement inspections, and other regulations, the data on investment in fixed assets for the same period of the previous year have been revised, and the growth rates of investment in fixed assets were calculated on a comparable basis.