Energy Production in March 2026
In March 2026, the raw coal production by industrial enterprises above the designated size was stable, the crude oil production maintained growth, the production of natural gas grew faster, and the growth of electricity generation was steady.
I. Raw Coal, Crude Oil and Natural Gas Production and Related Information
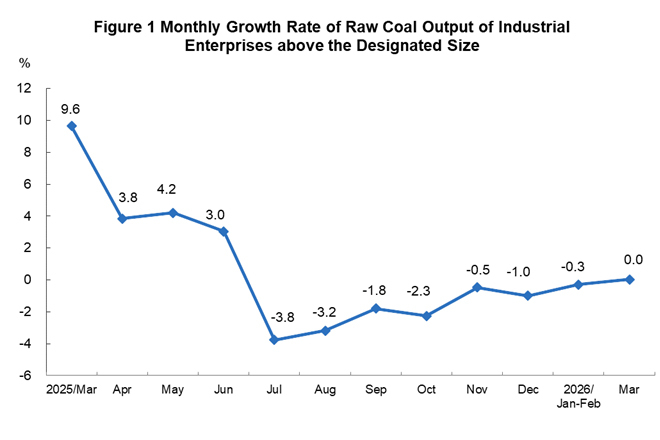
Raw coal production remained stable. In March, the raw coal production by industrial enterprises above the designated size was 440 million tons, unchanged year on year; the average daily output was 14.21 million tons.
From January to March, the raw coal production by industrial enterprises above the designated size was 1.20 billion tons, a year-on-year increase of 0.1%.
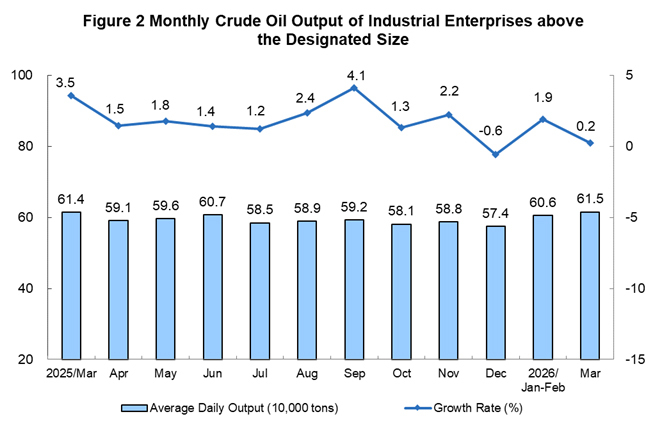
The crude oil production maintained growth. In March, the crude oil production by industrial enterprises above the designated size was 19.07 million tons, a year-on-year increase of 0.2%; the average daily output was 615 thousand tons.
From January to March, the crude oil production by industrial enterprises above the designated size was 54.80 million tons, a year-on-year increase of 1.3%.
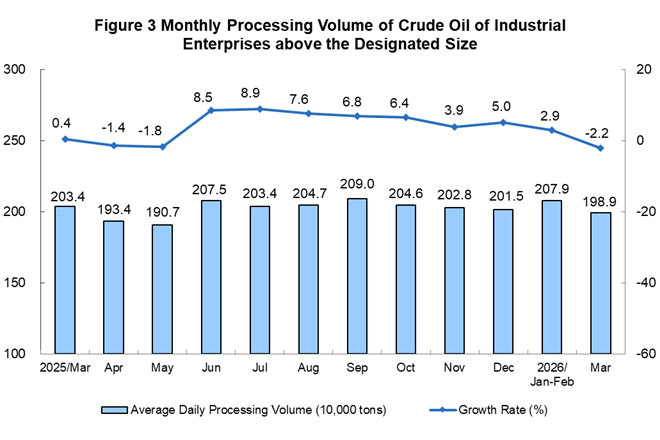
The processing volume of crude oil turned from growth to decline. In March, the processing volume of crude oil by industrial enterprises above the designated size was 61.67 million tons, a year-on-year decrease of 2.2%; the average daily processing volume was 1.989 million tons.
From January to March, the processing volume of crude oil by industrial enterprises above the designated size was 184.31 million tons, a year-on-year increase of 1.1%.
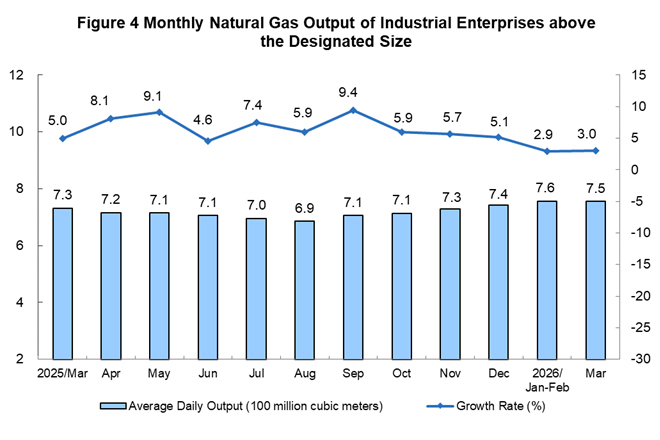
Natural gas production grew faster. In March, the production of natural gas by industrial enterprises above the designated size was 23.4 billion cubic meters, a year-on-year increase of 3.0%, with the growth rate 0.1 percentage points higher than that from January to February; the average daily output was 750 million cubic meters.
From January to March, the production of natural gas by industrial enterprises above the designated size was 68.1 billion cubic meters, a year-on-year increase of 3.0%.
II. Electricity Generation
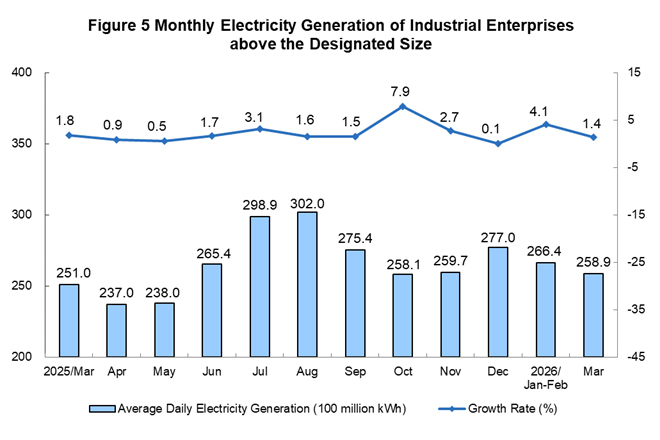
Electricity generation by industrial enterprises above the designated size maintained stable growth. In March, electricity generation by industrial enterprises above the designated size was 802.5 billion kWh, a year-on-year increase of 1.4%, with the growth rate 2.7 percentage points lower than that from January to February; the average daily electricity generation was 25.89 billion kWh. From January to March, electricity generation by industrial enterprises above the designated size was 2,378.2 billion kWh, a year-on-year increase of 3.4%.
By category, in March, the growth of thermal power, hydropower and solar power generation by industrial enterprises above the designated size accelerated; nuclear power and wind power generation turned from growth to decline. Among them, thermal power generation by industrial enterprises above the designated size increased by 4.2% year on year, with the growth rate 0.9 percentage points higher than that from January to February; hydropower generation increased by 10.8%, with the growth rate 4.0 percentage points higher than that from January to February; nuclear power generation decreased by 11.8%, compared with a 0.8% growth from January to February; wind power generation decreased by 17.3%, compared with a 5.3% growth from January to February; solar power generation increased by 10.0%, with the growth rate 0.1 percentage points higher than that from January to February.
Annotations:
1. Notes on Indicators
Average daily output is calculated by dividing the total output of industrial enterprises above the designated size announced in the current month by the number of calendar days in that month.
2. Statistical Coverage
The output data in this report covers the industrial enterprises above the designated size, which refers to industrial enterprises with an annual main business revenue of 20 million yuan or above.
As the scope of industrial enterprises above the designated size changes every year, to ensure comparability between the data of the current year and that of the previous year, the year-on-year growth rates of product output and other indicators are calculated based on the same statistical coverage of enterprises as in the current period, which is different from the coverage of data published last year.