Households’ Income and Consumption Expenditure in the First Quarter of 2026
I. Households’ Income
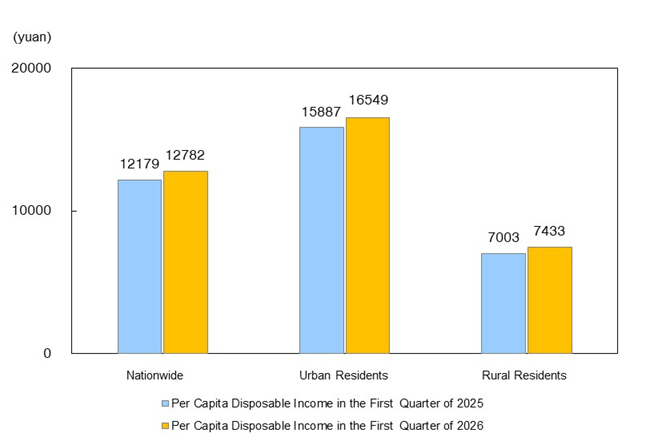
Inthe first quarter of 2026, the nationwide per capita disposable income was 12,782 yuan, a nominal increase of 4.9% over the same period of the previous year, and a real increase of 4.0% after deducting price factors. In terms of urban and rural areas, the per capita disposable income of urban residents was 16,549 yuan, an increase of 4.2% (unless otherwise specified, all growth rates mentioned are year-on-year nominal growth rates), and a real increase of 3.2% after deducting price factors; the per capita disposable income of rural residents was 7,433 yuan, an increase of 6.1%, and a real increase of 5.4% after deducting price factors.
According to the source of income, in the first quarter, the per capita income from wages and salaries of residents nationwide was 7,319 yuan, an increase of 4.9%, accounting for 57.3% of the per capita disposable income; the per capita net business income was 2,207 yuan, an increase of 6.6%, accounting for 17.3% of the per capita disposable income; the per capita net income from properties was 1,031 yuan, an increase of 1.6%, accounting for 8.1% of the per capita disposable income; the per capita net income from transfer was 2,225 yuan, an increase of 5.1%, accounting for 17.4% of the per capita disposable income.
In the first quarter, the median of the nationwide per capita disposable income was 10,433 yuan, an increase of 5.0%, and the median was 81.6% of the average. Among them, the median of the per capita disposable income of urban residents was 14,038 yuan, an increase of 4.4%, and the median was 84.8% of the average; the median of the per capita disposable income of rural residents was 5,909 yuan, an increase of 6.0%, and the median was 79.5% of the average.
Figure 1 Per Capita Disposable Income of Residents Nationwide and of Urban and Rural Areas in the First Quarter of 2026
II. Consumption Expenditure of Households
In the first quarter, the nationwide per capita consumption expenditure was 7,955 yuan, a nominal increase of 3.6% over the same period of the previous year, and a real increase of 2.6% after deducting price factors. In terms of urban and rural areas, the per capita consumption expenditure of urban residents was 9,635 yuan, an increase of 2.9%, and a real increase of 2.0% after deducting price factors; the per capita consumption expenditure of rural residents was 5,569 yuan, an increase of 4.4%, and a real increase of 3.7% after deducting price factors.
In the first quarter, the nationwide per capita consumption expenditure on food, tobacco and liquor was 2,549 yuan, an increase of 5.3%, accounting for 32.0% of the per capita consumption expenditure; the per capita consumption expenditure on clothing was 526 yuan, an increase of 5.6%, accounting for 6.6% of the per capita consumption expenditure; the per capita consumption expenditure on residence was 1,611 yuan, an increase of 1.0%, accounting for 20.3% of the per capita consumption expenditure; the per capita consumption expenditure on household facilities, articles and services was 442 yuan, an increase of 6.1%, accounting for 5.6% of the per capita consumption expenditure; the per capita consumption expenditure on transportation and telecommunication was 1,079 yuan, an increase of 3.4%, accounting for 13.6% of per capita consumption expenditure; the per capita consumption expenditure on education, culture and recreation was 843 yuan, an increase of 2.5%, accounting for 10.6% of the per capita consumption expenditure; the per capita consumption expenditure on health care and medical services was 645 yuan, a decrease of 0.5%, accounting for 8.1% of the per capita consumption expenditure; the per capita consumption expenditure on miscellaneous goods and services was 260 yuan, an increase of 10.2%, accounting for 3.3% of the per capita consumption expenditure.
Figure 2 Per Capita Consumption Expenditure and Composition in the First Quarter of 2026
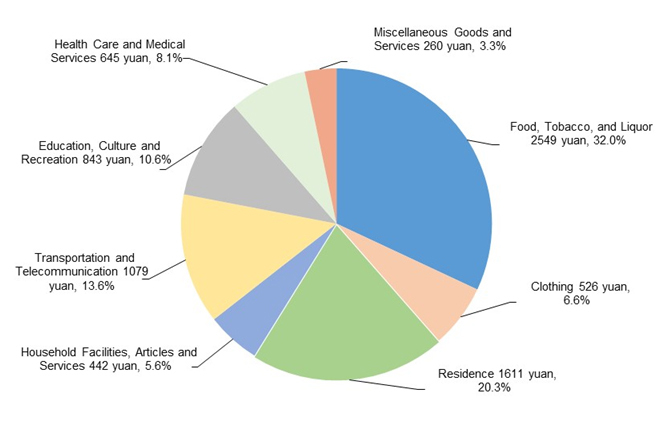
Table 1 Nationwide Income and Consumption Expenditure in the First Quarter of 2026
|
Item |
Absolute Value (yuan) |
Growth Rate Y/Y (%) (Real Increase in Brackets) |
|
(I) Nationwide Per Capita Disposable Income |
12782 |
4.9 (4.0) |
|
Grouped by Permanent Residence |
|
|
|
Urban residents |
16549 |
4.2 (3.2) |
|
Rural residents |
7433 |
6.1 (5.4) |
|
Grouped by Income Source |
|
|
|
Income from wages and salaries |
7319 |
4.9 |
|
Net business income |
2207 |
6.6 |
|
Net Income from properties |
1031 |
1.6 |
|
Net Income from transfer |
2225 |
5.1 |
|
(II) Median of Nationwide Per Capita Disposable Income |
10433 |
5.0 |
|
Grouped by Permanent Residence |
|
|
|
Urban residents |
14038 |
4.4 |
|
Rural residents |
5909 |
6.0 |
|
(III) Nationwide Per Capita Consumption Expenditure |
7955 |
3.6 (2.6) |
|
Grouped by Permanent Residence |
|
|
|
Urban residents |
9635 |
2.9 (2.0) |
|
Rural residents |
5569 |
4.4 (3.7) |
|
Grouped by Consumption Category |
|
|
|
Food, tobacco and liquor |
2549 |
5.3 |
|
Clothing |
526 |
5.6 |
|
Residence |
1611 |
1.0 |
|
Household facilities, articles and services |
442 |
6.1 |
|
Transportation and telecommunication |
1079 |
3.4 |
|
Education, culture and recreation |
843 |
2.5 |
|
Health care and medical services |
645 |
-0.5 |
|
Miscellaneous goods and services |
260 |
10.2 |
Notes:
1. Nominal growth rate of per capita disposable income of residents = (per capita disposable income of residents in the reporting period / per capita disposable income of residents in the base period - 1) * 100%; real growth rate of per capita disposable income of residents = (per capita disposable income of residents in the reporting period / per capita disposable income of residents in the base period / consumer price index of residents in the reporting period * 100 - 1) * 100%.
2. The data on nationwide per capita income and consumption expenditure is derived from a sampling survey of 160 thousand households across the country, and is weighted and summarized based on the number of households represented by each sample household. Influenced by urbanization, population migration and other factors, the composition of the population has changed over time by urban-rural area and by region, which sometimes leads to the phenomenon that the growth rate of some income and consumption expenditure items nationwide exceeds the growth range of corresponding income and consumption expenditure items of urban and rural residents. Especially in the process of urbanization, a segment of the rural population with relatively high incomes moves to urban areas, but they often belong to lower-income groups in urban settings. Their migration exerts a downward effect on the income and consumption expenditure of both urban and rural residents to some extent. Nonetheless, whether in urban or rural areas, the growth effect of this segment is reflected in the overall income and expenditure growth of residents nationwide.
3. In the column of year-on-year growth rates, the data in brackets refers to real growth rates, while the rest refers to nominal growth rates.
4. The average and median income are statistics reflecting the trend of residents’ income concentration. The average not only directly reflects the overall situation, but also reflects the overall structure, which is convenient for the comparison of income levels of different groups. However, the measure is vulnerable to the influence of extreme data. The median reflects the situation of the object in the middle position, which is relatively stable and free from the influence of extreme values. However, it cannot reflect the overall structure.
Table 2 Income and Consumption Expenditure of Urban and Rural Residents in the First Quarter of 2026
|
Item |
Absolute Value(yuan) |
Nominal Growth Rate Y/Y (%) |
|
(I) Per Capita Disposable Income of Urban Residents |
16549 |
4.2 |
|
Grouped by Income Source |
|
|
|
Income from wages and salaries |
10113 |
4.2 |
|
Net business income |
2154 |
6.7 |
|
Net Income from properties |
1604 |
0.6 |
|
Net Income from transfer |
2678 |
4.3 |
|
(II) Per Capita Consumption Expenditure of Urban Residents |
9635 |
2.9 |
|
Grouped by Consumption Category |
|
|
|
Food, tobacco and liquor |
2993 |
4.5 |
|
Clothing |
648 |
5.2 |
|
Residence |
2042 |
-0.1 |
|
Household facilities, articles and services |
523 |
5.4 |
|
Transportation and telecommunication |
1312 |
3.4 |
|
Education, culture and recreation |
1041 |
2.7 |
|
Health care and medical services |
728 |
-2.3 |
|
Miscellaneous goods and services |
348 |
10.0 |
|
(III) Per Capita Disposable Income of Rural Residents |
7433 |
6.1 |
|
Grouped by Income Source |
|
|
|
Income from wages and salaries |
3351 |
5.9 |
|
Net business income |
2283 |
6.4 |
|
Net Income from properties |
219 |
6.3 |
|
Net Income from transfer |
1580 |
6.2 |
|
(IV) Per Capita Consumption Expenditure of Rural Residents |
5569 |
4.4 |
|
Grouped by Consumption Category |
|
|
|
Food, tobacco and liquor |
1918 |
6.4 |
|
Clothing |
353 |
5.8 |
|
Residence |
998 |
3.1 |
|
Household facilities, articles and services |
329 |
7.0 |
|
Transportation and telecommunication |
747 |
2.4 |
|
Education, culture and recreation |
563 |
1.1 |
|
Health care and medical services |
527 |
2.8 |
|
Miscellaneous goods and services |
134 |
9.4 |
Annotations:
1. Notes on Indicators
Disposable income of residents refers to the sum of final consumption expenditure and savings that residents can use, that is, the income that residents can use for free disposal, including both cash income and physical income. According to the source of income, disposable income includes income from wages and salaries, net business income, net income from properties and net income from transfer.
Consumption expenditure of residents refers to all the expenditure that residents use to meet their daily needs, including both cash and physical consumption. Consumption expenditure includes eight categories: food, tobacco and liquor, clothing, residence, household facilities, articles and services, transportation and telecommunication, education, culture and recreation, health care and medical services, and miscellaneous goods and services.
The median of the nationwide per capita disposable income refers to the per capita disposable income of residents that lies in the middle position of all surveyed households ranked from low to high on the basis of per capita disposable income.
The quarterly income and consumption expenditure data do not cover the income and consumption of the self-produced and self-used parts of residents, which are included in the annual income and consumption expenditure data.
2. Survey Methods
The national, urban and rural residents’ income and consumption expenditure data comes from the household income and consumption expenditure and living condition surveys organized and implemented by the National Bureau of Statistics of China (NBS), which is released quarterly.
Using a stratified, multi-stage, probability sampling method proportional to the size of the population, the NBS randomly selected 160 thousand households in nearly 2,000 counties (cities and districts) from 31 provinces (autonomous regions and municipalities) as surveyed households.
According to the unified rules and methods, the directly-affiliated survey teams stationed in localities by the NBS organize the surveyed households to keep accounts to collect data on residents’ income, expenditure, family business operations, production and investment; meanwhile, according to the unified questionnaire, the survey teams collect other information such as the employment of household members and labor force, the ownership of housing and durable consumer goods, and the coverage of residents’ basic social and public services. After the completion of data collection, the survey teams at the municipal and county level use unified methods and data processing procedures to code, review and input the original investigation information, and then directly transmit the basic household data to the NBS for unified summary and calculation.
3. Additional Notes
Due to rounding, the sub-items may not add up to the aggregate totals.