Industrial Capacity Utilization Rate in the First Quarter of 2026
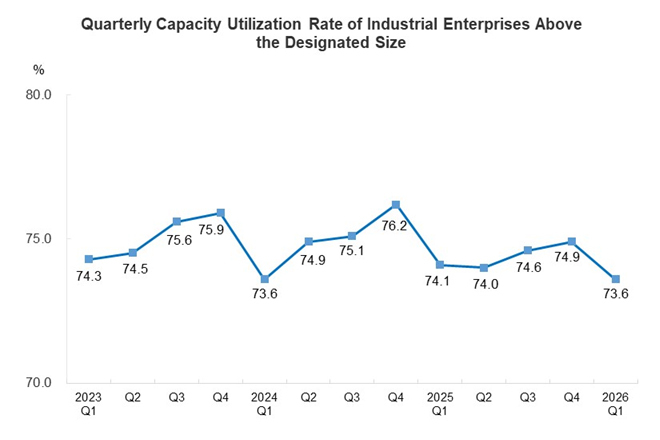
In the first quarter of 2026, the capacity utilization rate of industrial enterprises above the designated size nationwide was 73.6%, down by 1.3 percentage points from the fourth quarter of the previous year and down by 0.5 percentage points from the same period of the previous year.
In terms of three sectors, in the first quarter of 2026, the capacity utilization rate of the mining industry was 72.1%; that of the manufacturing industry was 73.9%; that of the production and supply of electricity, heat power, gas and water was 71.9%.
In terms of major industries, in the first quarter of 2026, the capacity utilization rate of the mining and washing of coal was 66.4%, that of the manufacture of foods was 70.0%, that of the textile industry was 76.5%, that of the manufacture of raw chemical materials and chemical products was 73.8%, that of the manufacture of non-metallic mineral products was 56.9%, that of the smelting and pressing of ferrous metals was 78.1%, that of the smelting and pressing of non-ferrous metals was 77.2%, that of the manufacture of general-purpose machinery was 79.0%, that of the manufacture of special-purpose machinery was 76.6%, that of the manufacture of automobiles was 70.3%, that of the manufacture of electrical machinery and apparatus was 71.6%, and that of the manufacture of computers, communication equipment and other electronic equipment was 75.4%.
Industrial Capacity Utilization Rate in the First Quarter of 2026
|
Sectors |
Q1 2026 | |
|
Capacity Utilization Rate (%) |
Increase or Decrease Rate Y/Y (±percentage point) | |
|
Industry |
73.6 |
-0.5 |
|
Of which: Mining |
72.1 |
-2.5 |
|
Manufacturing |
73.9 |
-0.2 |
|
Production and supply of electricity, heat power, gas and water |
71.9 |
-1.7 |
|
Of which: Mining and washing of coal |
66.4 |
-5.5 |
|
Extraction of petroleum and natural gas |
92.5 |
0.1 |
|
Manufacture of foods |
70.0 |
0.7 |
|
Textile industry |
76.5 |
-1.3 |
|
Manufacture of raw chemical materials and chemical products |
73.8 |
0.3 |
|
Manufacture of medicines |
72.7 |
0.2 |
|
Manufacture of chemical fibers |
84.7 |
-1.6 |
|
Manufacture of non-metallic mineral products |
56.9 |
-4.0 |
|
Smelting and pressing of ferrous metals |
78.1 |
-1.2 |
|
Smelting and pressing of non-ferrous metals |
77.2 |
-0.3 |
|
Manufacture of general-purpose machinery |
79.0 |
0.9 |
|
Manufacture of special-purpose machinery |
76.6 |
1.0 |
|
Manufacture of automobiles |
70.3 |
-1.6 |
|
Manufacture of electrical machinery and apparatus |
71.6 |
-0.1 |
|
Manufacture of computers, communication equipment and other electronic equipment |
75.4 |
0.7 |
Annotations:
1. Notes on Indicators
Capacity utilization rate: refers to the ratio of actual output to production capacity (both measured by value).
The actual output of the enterprise refers to the total industrial output value of the enterprise in the reporting period; the production capacity of the enterprise refers to the product output that the enterprise can achieve and can maintain for a long time when the production equipment (machinery) maintains normal operation under the condition that the supply of labor, raw materials, fuel, transport, etc. is guaranteed during the reporting period.
2. Survey Method and Statistical Coverage
The survey involved about 110,000 industrial enterprises above the designated size, including a comprehensive survey of large and medium-sized enterprises above the designated size and a sample survey of micro and small-sized enterprises.
Data for small and micro enterprises was extrapolated by using a sampling method. The data was then combined with that of large and medium-sized enterprises to calculate the capacity utilization rate of industrial enterprises above the designated size nationwide.
The survey was conducted on a quarterly basis, and the data acquired has not been seasonally adjusted.
3. Standard on Industrial Classification
The Industrial Classification for National Economic Activities (GB/T 4754-2017) was implemented.