Industrial Producer Price Indexes in March 2026
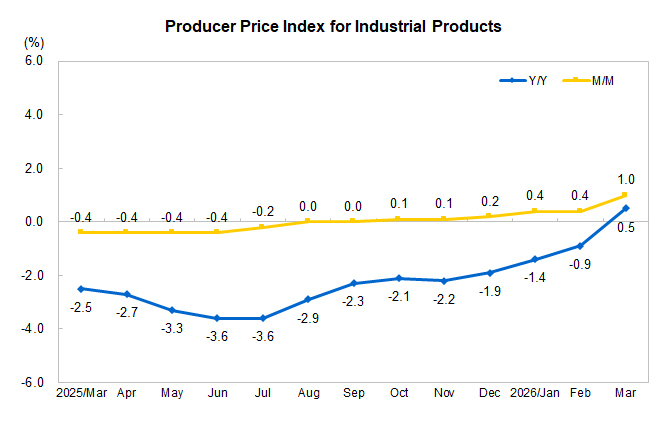
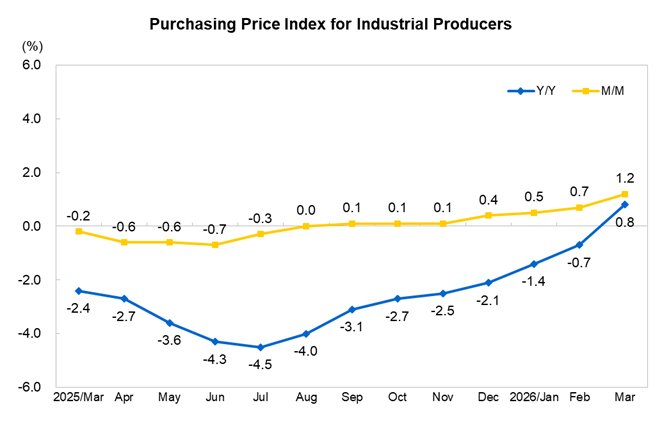
In March 2026, China’s producer price index for industrial products (PPI) turned from a 0.9% year-on-year decline in the previous month to a 0.5% increase; it increased by 1.0% month on month, with the increase 0.6 percentage points higher than the previous month. The purchasing price index for industrial producers turned from a 0.7% year-on-year decline in the previous month to a 0.8% increase; it increased by 1.2% month on month, with the increase 0.5 percentage points higher than the previous month. In the first quarter, the producer price index for industrial products decreased by 0.6% year on year, and the purchasing price index for industrial producers decreased by 0.5% year on year.
I. Year-on-Year Changes in Industrial Producer Price Indexes
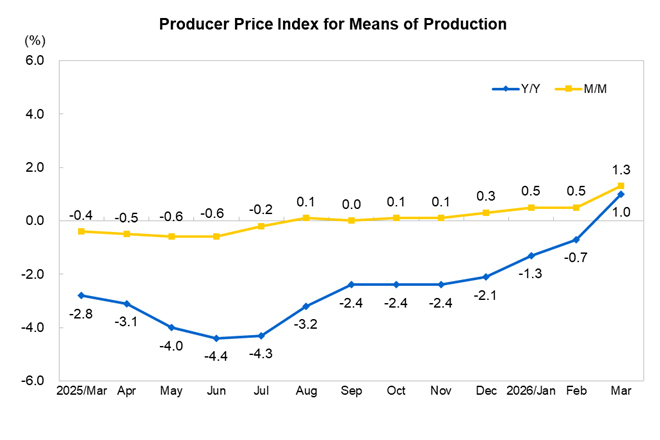
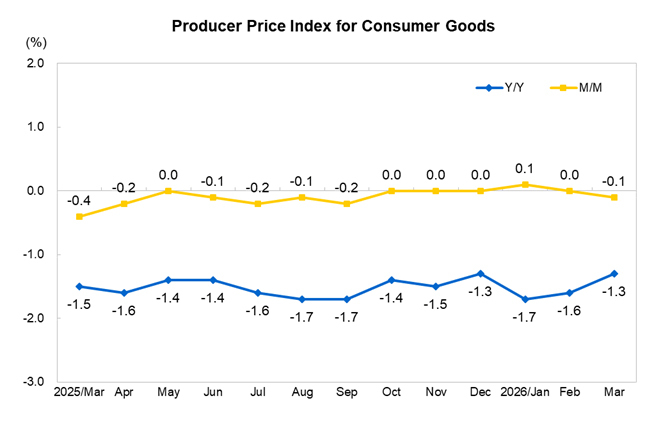
In March, among producer price indexes for industrial products, the price index for means of production increased by 1.0%, pushing the overall producer price index for industrial products up by about 0.81 percentage points. Specifically, the price index for mining and quarrying increased by 2.0%, that for raw materials increased by 1.1%, and that for the processing industry increased by 0.9%. The price index for consumer goods decreased by 1.3%, bringing the overall producer price index for industrial products down by about 0.28 percentage points. Specifically, the price index for food decreased by 1.7%, that for clothing decreased by 1.1%, that for articles for daily use decreased by 1.4%, and that for durable consumer goods decreased by 1.0%.
Among purchasing price indexes for industrial producers, the price index for building materials and non-metals decreased by 4.4%, that for fuel and power decreased by 3.8%, that for agricultural and sideline products decreased by 2.7%, that for ferrous metals decreased by 2.3%, that for raw chemical materials decreased by 2.2%, that for textile materials decreased by 0.6%, and that for nonferrous metals and cables increased by 22.3%.
II. Month-on-Month Changes in Industrial Producer Price Indexes
In March, among producer price indexes for industrial products, the price index for means of production increased by 1.3%, pushing the overall producer price index for industrial products up by about 1.01 percentage points. Specifically, the price index for mining and quarrying increased by 3.9%, that for raw materials increased by 2.4%, and that for the processing industry increased by 0.5%. The price index for consumer goods decreased by 0.1%, bringing the overall producer price index for industrial products down by about 0.02 percentage points. Specifically, the price index for food decreased by 0.2%, that for clothing decreased by 0.1%, that for articles for daily use increased by 0.1%, and that for durable consumer goods decreased by 0.1%.
Among purchasing price indexes for industrial producers, the price index for fuel and power increased by 3.6%, that for raw chemical materials increased by 2.9%, that for nonferrous metals and cables increased by 1.5%, that for textile materials increased by 0.9%, that for ferrous metals increased by 0.2%, that for agricultural and sideline products decreased by 0.5%, and that for building materials and non-metals decreased by 0.1%.
Industrial Producer Price Indexes in March 2026
|
|
Growth Rate M/M (%) |
Growth Rate Y/Y (%) |
Jan-Mar Growth Rate Y/Y (%) |
|
I. Producer Price Indexes for Industrial Products |
1.0 |
0.5 |
-0.6 |
|
Means of production |
1.3 |
1.0 |
-0.3 |
|
Mining and quarrying |
3.9 |
2.0 |
-3.9 |
|
Raw materials |
2.4 |
1.1 |
-0.9 |
|
Processing |
0.5 |
0.9 |
0.3 |
|
Consumer goods |
-0.1 |
-1.3 |
-1.6 |
|
Food |
-0.2 |
-1.7 |
-1.8 |
|
Clothing |
-0.1 |
-1.1 |
-0.9 |
|
Articles for daily use |
0.1 |
-1.4 |
-1.7 |
|
Durable consumer goods |
-0.1 |
-1.0 |
-1.4 |
|
II. Purchasing Price Indexes for Industrial Producers |
1.2 |
0.8 |
-0.5 |
|
Fuel and power |
3.6 |
-3.8 |
-6.4 |
|
Ferrous metals |
0.2 |
-2.3 |
-2.7 |
|
Nonferrous metals and cables |
1.5 |
22.3 |
19.9 |
|
Raw chemical materials |
2.9 |
-2.2 |
-4.3 |
|
Timber and paper pulp |
-0.1 |
-2.9 |
-2.8 |
|
Building materials and non-metals |
-0.1 |
-4.4 |
-4.5 |
|
Other industrial raw materials and semi-products |
0.2 |
0.0 |
-0.4 |
|
Agricultural and sideline products |
-0.5 |
-2.7 |
-2.6 |
|
Textile materials |
0.9 |
-0.6 |
-1.6 |
|
III. Producer Price Indexes for Major Industries |
|
|
|
|
Mining and washing of coal |
0.1 |
-2.2 |
-6.4 |
|
Extraction of petroleum and natural gas |
15.8 |
5.2 |
-8.3 |
|
Mining and processing of ferrous metal ores |
-0.9 |
0.1 |
1.4 |
|
Mining and processing of non-ferrous metal ores |
5.4 |
36.4 |
29.8 |
|
Mining and processing of non-metal ores |
0.4 |
-4.2 |
-4.6 |
|
Processing of food from agricultural and sideline products |
-0.1 |
-1.5 |
-1.5 |
|
Manufacture of foods |
0.2 |
-2.0 |
-2.1 |
|
Manufacture of liquor, beverages and refined tea |
0.0 |
-2.1 |
-2.0 |
|
Manufacture of tobacco |
0.0 |
0.3 |
0.4 |
|
Textile industry |
0.5 |
-0.8 |
-1.2 |
|
Manufacture of textiles, wearing apparel and accessories |
-0.2 |
-1.5 |
-1.4 |
|
Processing of timber, manufacture of wood, bamboo, rattan, palm and straw products |
-0.2 |
-2.6 |
-2.7 |
|
Manufacture of paper and paper products |
0.0 |
-2.2 |
-2.6 |
|
Printing and reproduction of recording media |
-0.1 |
-3.5 |
-3.6 |
|
Processing of petroleum, coal and other fuels |
5.8 |
-4.5 |
-9.4 |
|
Manufacture of raw chemical materials and chemical products |
3.6 |
-0.3 |
-3.0 |
|
Manufacture of medicines |
-0.1 |
-4.6 |
-4.6 |
|
Manufacture of chemical fibers |
3.4 |
-2.3 |
-4.9 |
|
Manufacture of rubber and plastic products |
0.6 |
-3.4 |
-3.9 |
|
Manufacture of non-metallic mineral products |
-0.3 |
-4.9 |
-5.1 |
|
Smelting and pressing of ferrous metals |
0.3 |
-2.5 |
-3.2 |
|
Smelting and pressing of non-ferrous metals |
1.0 |
22.4 |
20.5 |
|
Manufacture of metal products |
0.3 |
0.2 |
-0.3 |
|
Manufacture of general-purpose machinery |
-0.2 |
-1.2 |
-1.2 |
|
Manufacture of automobiles |
-0.5 |
-2.5 |
-2.4 |
|
Manufacture of railway, ships, aerospace and other transport equipment |
0.0 |
-0.1 |
-0.2 |
|
Manufacture of computers, communication equipment and other electronic equipment |
0.7 |
0.4 |
-0.7 |
|
Production and supply of electricity and heat power |
1.4 |
-3.8 |
-3.9 |
|
Production and supply of gas |
0.0 |
-2.4 |
-2.5 |
|
Production and supply of water |
0.2 |
1.6 |
1.6 |
Annotations:
1. Index Interpretation
The industrial producer price index comprises the producer price index for industrial products (PPI) and the purchasing price index for industrial producers.
The PPI reflects the trend and magnitude of changes in producer prices for products when they are sold for the first time by industrial enterprises.
The purchasing price index for industrial producers reflects the trend and magnitude of changes in prices for intermediate inputs purchased by industrial enterprises.
2. Statistical Coverage
The statistical survey of the PPI covers prices for 41 major industrial categories and more than 1,300 basic categories of industrial products; the statistical survey of the purchasing price index for industrial producers covers prices for 9 major categories and more than 800 basic categories of industrial products.
3. Survey Method
The survey of the industrial producer price index adopts an approach that combines surveys of main units and typical surveys, covering more than 40,000 industrial enterprises across China.
4. Statistical Standard
The industries are classified based on the Industrial Classification for National Economic Activities (GB/T 4754-2017).
5. Data Description
Due to rounding, the aggregated data may be equal to the high or low value of the classified figures. For some categories or industries where price changes are minor, the growth rate becomes zero after being rounded to one decimal place. In such cases, the price change is described as “flat”.
6. Base Period Rotation
According to the statistical system arrangement, China’s PPI undergoes a base period rotation every five years. Starting from January 2026, the PPI will be compiled and published with 2025 as the base period. Compared with the previous base period, the survey categories, surveyed enterprises and representative specification items, and the category weights have been adjusted to reflect the latest changes in the industrial production structure. According to calculations, the impact of the base period rotation on the monthly year-on-year PPI is approximately 0.08 percentage points on average.