Consumer Price Index in March 2026
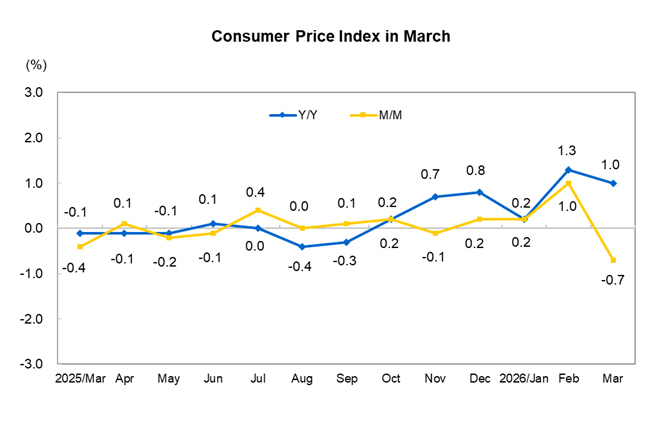
In March 2026, China’s Consumer Price Index (CPI) increased by 1.0% year on year. Specifically, the price index in urban areas increased by 1.1% while that in rural areas increased by 0.9%; the price index for food increased by 0.3% while that for non-food increased by 1.2%; the price index for consumer goods increased by 1.3% while that for services increased by 0.8%. From January to March, on average, China’s CPI increased by 0.9% year on year.
In March, China’s CPI decreased by 0.7% month on month. Specifically, the price index in urban areas decreased by 0.7% while that in rural areas decreased by 0.5%; the price index for food decreased by 2.7% while that for non-food decreased by 0.2%; the price index for consumer goods decreased by 0.3% while that for services decreased by 1.1%.
I. Year-on-Year Changes in Price Indexes for Various Goods and Services
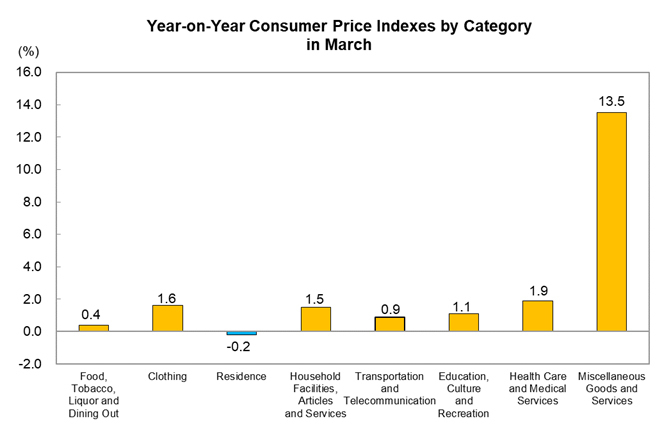
In March, the price index for food, tobacco, liquor and dining out increased by 0.4% year on year, pushing the CPI up by about 0.11 percentage points. Among food, the price index for fresh vegetables increased by 4.9%, pushing the CPI up by about 0.08 percentage points; that for fresh fruits increased by 4.0%, pushing the CPI up by about 0.08 percentage points; that for aquatic products increased by 3.7%, pushing the CPI up by about 0.07 percentage points; that for meat of livestock decreased by 4.2%, bringing the CPI down by about 0.18 percentage points, of which the price index for pork decreased by 11.5%, bringing the CPI down by about 0.22 percentage points; that for eggs decreased by 3.1%, bringing the CPI down by about 0.02 percentage points.
Among the price indexes for the other seven major categories, six increased, and one decreased year on year. Specifically, the price indexes for miscellaneous goods and services, health care and medical services, and clothing increased by 13.5%, 1.9% and 1.6%, respectively; the price indexes for household facilities, articles and services, education, culture and recreation and transportation and telecommunication increased by 1.5%,1.1% and 0.9%, respectively; the price index for residence decreased by 0.2%.
II. Month-on-Month Changes in Price Indexes for Various Goods and Services
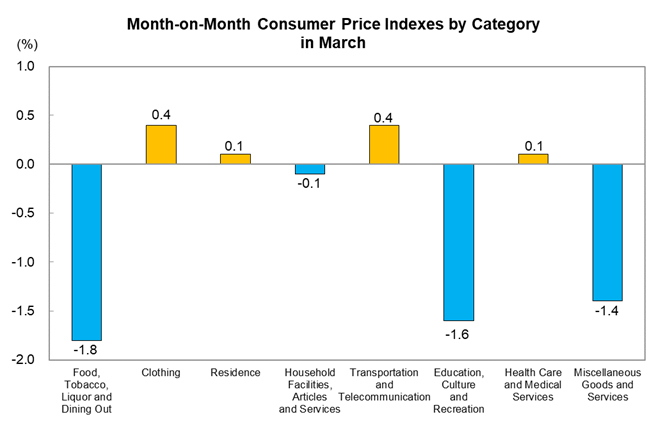
In March, the price index for food, tobacco, liquor and dining out decreased by 1.8% month on month, bringing the CPI down by about 0.53 percentage points. Among food, the price index for fresh vegetables decreased by 10.1%, bringing the CPI down by about 0.19 percentage points; that for meat of livestock decreased by 3.9%, bringing the CPI down by about 0.16 percentage points, of which the price index for pork decreased by 7.3%, bringing the CPI down by about 0.13 percentage points; that for fresh fruits decreased by 3.3%, bringing the CPI down by about 0.07 percentage points; that for eggs decreased by 2.7%, bringing the CPI down by about 0.01 percentage points; and that for aquatic products decreased by 2.6%, bringing the CPI down by about 0.05 percentage points.
Among the price indexes for the other seven major categories, four increased and three decreased month on month. Specifically, the price indexes for clothing and transportation and telecommunication both increased by 0.4%, and the price indexes for residence and health care and medical services both increased by 0.1%; the price indexes for education, culture and recreation, miscellaneous goods and services, and household facilities, articles and services decreased by 1.6%, 1.4% and 0.1%, respectively.
Consumer Price Indexes in March 2026
|
|
Growth Rate M/M (%) |
Growth Rate Y/Y (%) |
Jan-Mar Growth Rate Y/Y (%) |
|
Consumer Price Index |
-0.7 |
1.0 |
0.9 |
|
Of which: Urban |
-0.7 |
1.1 |
0.9 |
|
Rural |
-0.5 |
0.9 |
0.7 |
|
Of which: Food |
-2.7 |
0.3 |
0.4 |
|
Non-food |
-0.2 |
1.2 |
0.9 |
|
Of which: Consumer goods |
-0.3 |
1.3 |
0.9 |
|
Services |
-1.1 |
0.8 |
0.8 |
|
Of which: Excluding food and energy |
-0.7 |
1.1 |
1.2 |
|
By category |
|
|
|
|
I. Food, tobacco, liquor and dining out |
-1.8 |
0.4 |
0.5 |
|
Grain |
0.0 |
-0.3 |
-0.3 |
|
Edible oil and fats |
0.1 |
-0.8 |
-0.9 |
|
Fresh vegetables |
-10.1 |
4.9 |
7.6 |
|
Meat of livestock |
-3.9 |
-4.2 |
-4.3 |
|
Of which: Pork |
-7.3 |
-11.5 |
-11.3 |
|
Beef |
-1.2 |
7.8 |
8.2 |
|
Mutton |
-0.6 |
6.4 |
5.9 |
|
Aquatic products |
-2.6 |
3.7 |
3.5 |
|
Eggs |
-2.7 |
-3.1 |
-5.2 |
|
Milk and other dairy products |
0.4 |
-0.7 |
-0.9 |
|
Fresh fruits |
-3.3 |
4.0 |
4.3 |
|
Cigarettes |
-0.1 |
-0.4 |
-0.3 |
|
Liquor |
0.5 |
-2.8 |
-2.4 |
|
II. Clothing |
0.4 |
1.6 |
1.8 |
|
Garments |
0.4 |
1.7 |
1.9 |
|
Footwear |
0.5 |
1.2 |
1.3 |
|
III. Residence |
0.1 |
-0.2 |
-0.2 |
|
Rent of rental housing |
0.0 |
-0.5 |
-0.5 |
|
Water, electricity and fuels |
0.2 |
0.6 |
0.5 |
|
IV. Household facilities, articles and services |
-0.1 |
1.5 |
2.3 |
|
Home appliances |
0.0 |
2.4 |
4.7 |
|
Household services |
-2.8 |
1.1 |
0.8 |
|
V. Transportation and telecommunication |
0.4 |
0.9 |
-1.1 |
|
Automobiles |
-0.2 |
-1.1 |
-1.2 |
|
Energy for transport facilities |
10.0 |
3.4 |
-5.4 |
|
Use and maintenance of transport facilities |
-3.2 |
0.5 |
1.2 |
|
Communication facilities |
0.5 |
2.6 |
1.9 |
|
Telecommunication services |
0.0 |
0.1 |
0.0 |
|
Postal services |
-0.5 |
-0.2 |
-0.5 |
|
VI. Education, culture and recreation |
-1.6 |
1.1 |
1.0 |
|
Education services |
0.0 |
0.5 |
0.5 |
|
Travel agencies and other touring services |
-12.9 |
3.2 |
2.6 |
|
VII. Health care and medical services |
0.1 |
1.9 |
1.8 |
|
Traditional Chinese medicines |
-0.1 |
-1.6 |
-1.4 |
|
Western medicines |
-0.2 |
-1.0 |
-1.0 |
|
Medical services |
0.1 |
3.0 |
2.8 |
|
VIII. Miscellaneous goods and services |
-1.4 |
13.5 |
14.1 |
Annotations:
1. Index Interpretation
The Consumer Price Index (CPI) is an indicator that measures relative changes in the price level of consumer goods and services over time. It comprehensively reflects changes in prices of consumer goods and services purchased by residents.
2. Statistical Coverage
The CPI statistical survey covers the prices of eight major categories of goods and services purchased by national urban and rural residents, including food, tobacco, liquor and dining out, clothing, residence, household facilities, articles and services, transportation and telecommunication, education, culture and recreation, health care and medical services, and miscellaneous goods and services, as well as 268 basic categories.
3. Survey Method
Survey sites are selected using a sampling method. In accordance with the principle of “fixed person, fixed site, and fixed time”, original prices are collected either through on-site visits to the survey sites or from online sources. The data comes from nearly 120,000 survey sites in about 500 cities and counties in 31 provinces (autonomous regions and municipalities), covering shopping malls (stores), supermarkets, farmers’ (fresh produce) markets, service outlets, and Internet e-commerce.
4. Data Description
Due to rounding, the aggregate data may be equal to the high or low value of the classified figures.
5. Base Period Rotation
According to the statistical system arrangement, China’s CPI undergoes a base period rotation every five years. Starting from January 2026, the CPI will be compiled and published with 2025 as the base period. Compared with the previous base period, the survey categories, representative specification items, surveyed sites, and the category weights have been adjusted to reflect the latest changes in the consumption structure. According to calculations, the impact of the base period rotation on the monthly year-on-year CPI is approximately 0.06 percentage points on average.