STATISTICAL COMMUNIQUÉ OF THE PEOPLE'S REPUBLIC OF CHINA ON THE 2025 NATIONAL ECONOMIC AND SOCIAL DEVELOPMENT
THE PEOPLE'S REPUBLIC OF CHINA
ON THE 2025 NATIONAL
ECONOMIC AND SOCIAL DEVELOPMENT[1]
National Bureau of Statistics of China
February 28, 2026
The year 2025 marks the conclusion of China’s 14th Five-Year Plan and represents a significant year in the process of Chinese modernization. Faced with profound and complex changes at home and abroad, under the strong leadership of the Central Committee of the Communist Party of China (CPC) with Comrade Xi Jinping at its core, all regions and departments took Xi Jinping Thought on Socialism with Chinese Characteristics for a New Era as the guideline, fully implemented the guiding principles of the 20th CPC National Congress and its subsequent plenary sessions, followed the decisions and arrangements made by the CPC Central Committee and the State Council, fully and faithfully applied the new development philosophy on all fronts, accelerated efforts to foster a new pattern of development, strove to promote high-quality development, adhered to the general working guideline of making progress while maintaining stability, balanced domestic and international imperatives, ensured both development and security, and implemented more proactive and effective macro policies. As a result, the national economy pushed forward with innovation-led and high-quality development despite mounting economic pressure. The development of modernized industrial system continued to advance, reform and opening up made new strides, solid progress was made in defusing risks in key areas, people’s wellbeing was better guaranteed, helping ensure overall social stability. The new journey toward the Second Centenary Goal got off to a good start.
I. General Outlook
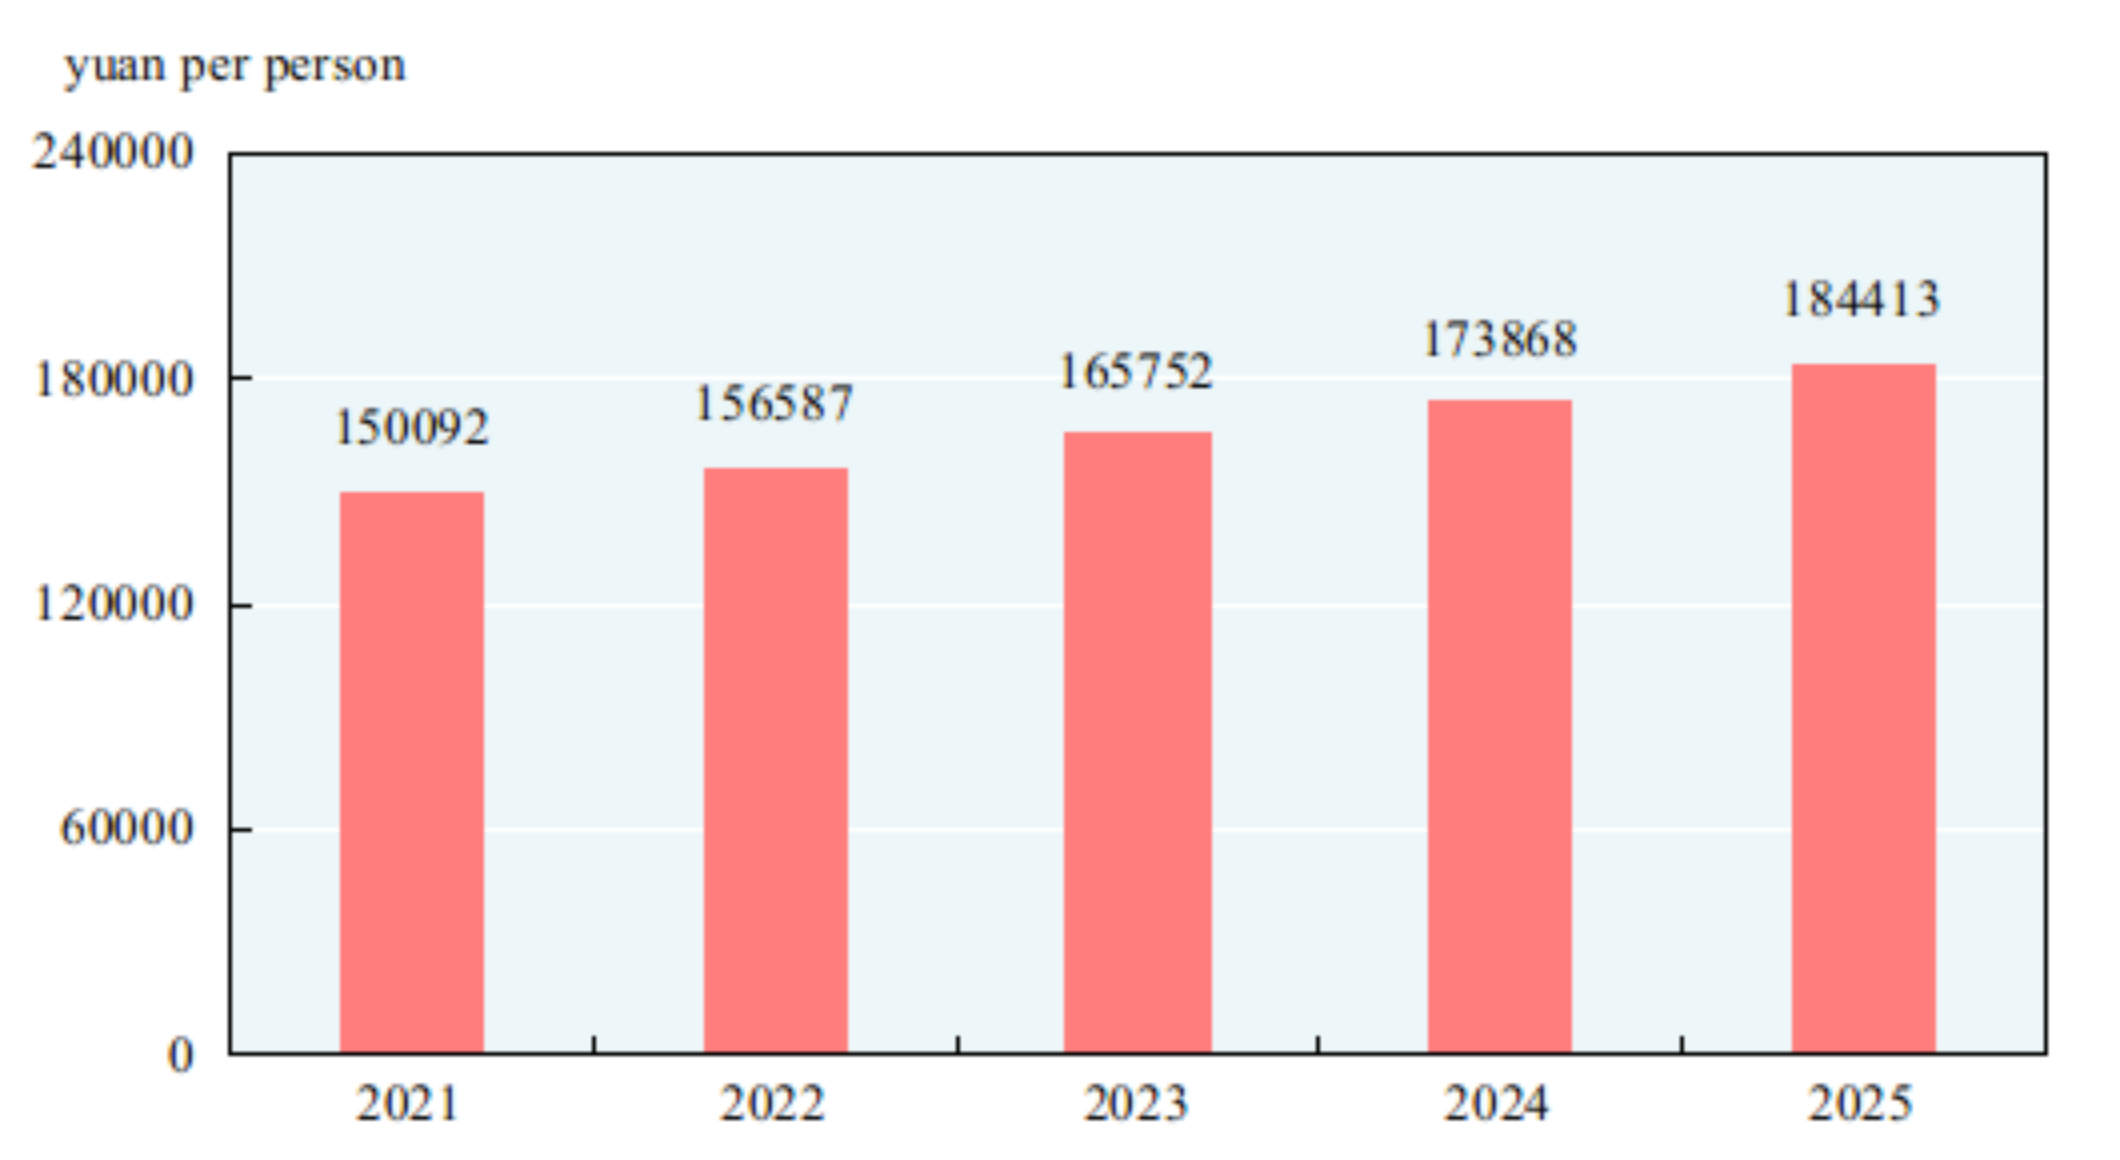
According to preliminary estimates, the gross domestic product (GDP)[2] in 2025 was 140,187.9 billion yuan, up by 5.0 percent over the previous year. Of this total, the value added of the primary industry was 9,334.7 billion yuan, up by 3.9 percent over the previous year, that of the secondary industry was 49,965.3 billion yuan, up by 4.5 percent, and that of the tertiary industry was 80,887.9 billion yuan, up by 5.4 percent. The value added of the primary industry accounted for 6.7 percent of the GDP; that of the secondary industry accounted for 35.6 percent; and that of the tertiary industry accounted for 57.7 percent. The contribution of final consumption expenditure to GDP growth rate was up by 2.6 percentage points, that of gross capital formation to GDP growth rate up by 0.8 percentage points and that of net exports of goods and services to GDP growth rate up by 1.6 percentage points. By quarter, the GDP went up by 5.4 percent year on year for the first quarter, up by 5.2 percent for the second quarter, 4.8 percent for the third quarter and 4.5 percent for the fourth quarter. The per capita GDP in 2025 was 99,665 yuan, up by 5.1 percent over the previous year. The gross national income[3]in 2025 was 139,370.0 billion yuan, up by 5.1 percent over the previous year. The overall labor productivity[4] was 184,413 yuan per person, up by 6.1 percent over the previous year.
Figure 1: Gross Domestic Product and Growth Rates 2021-2025
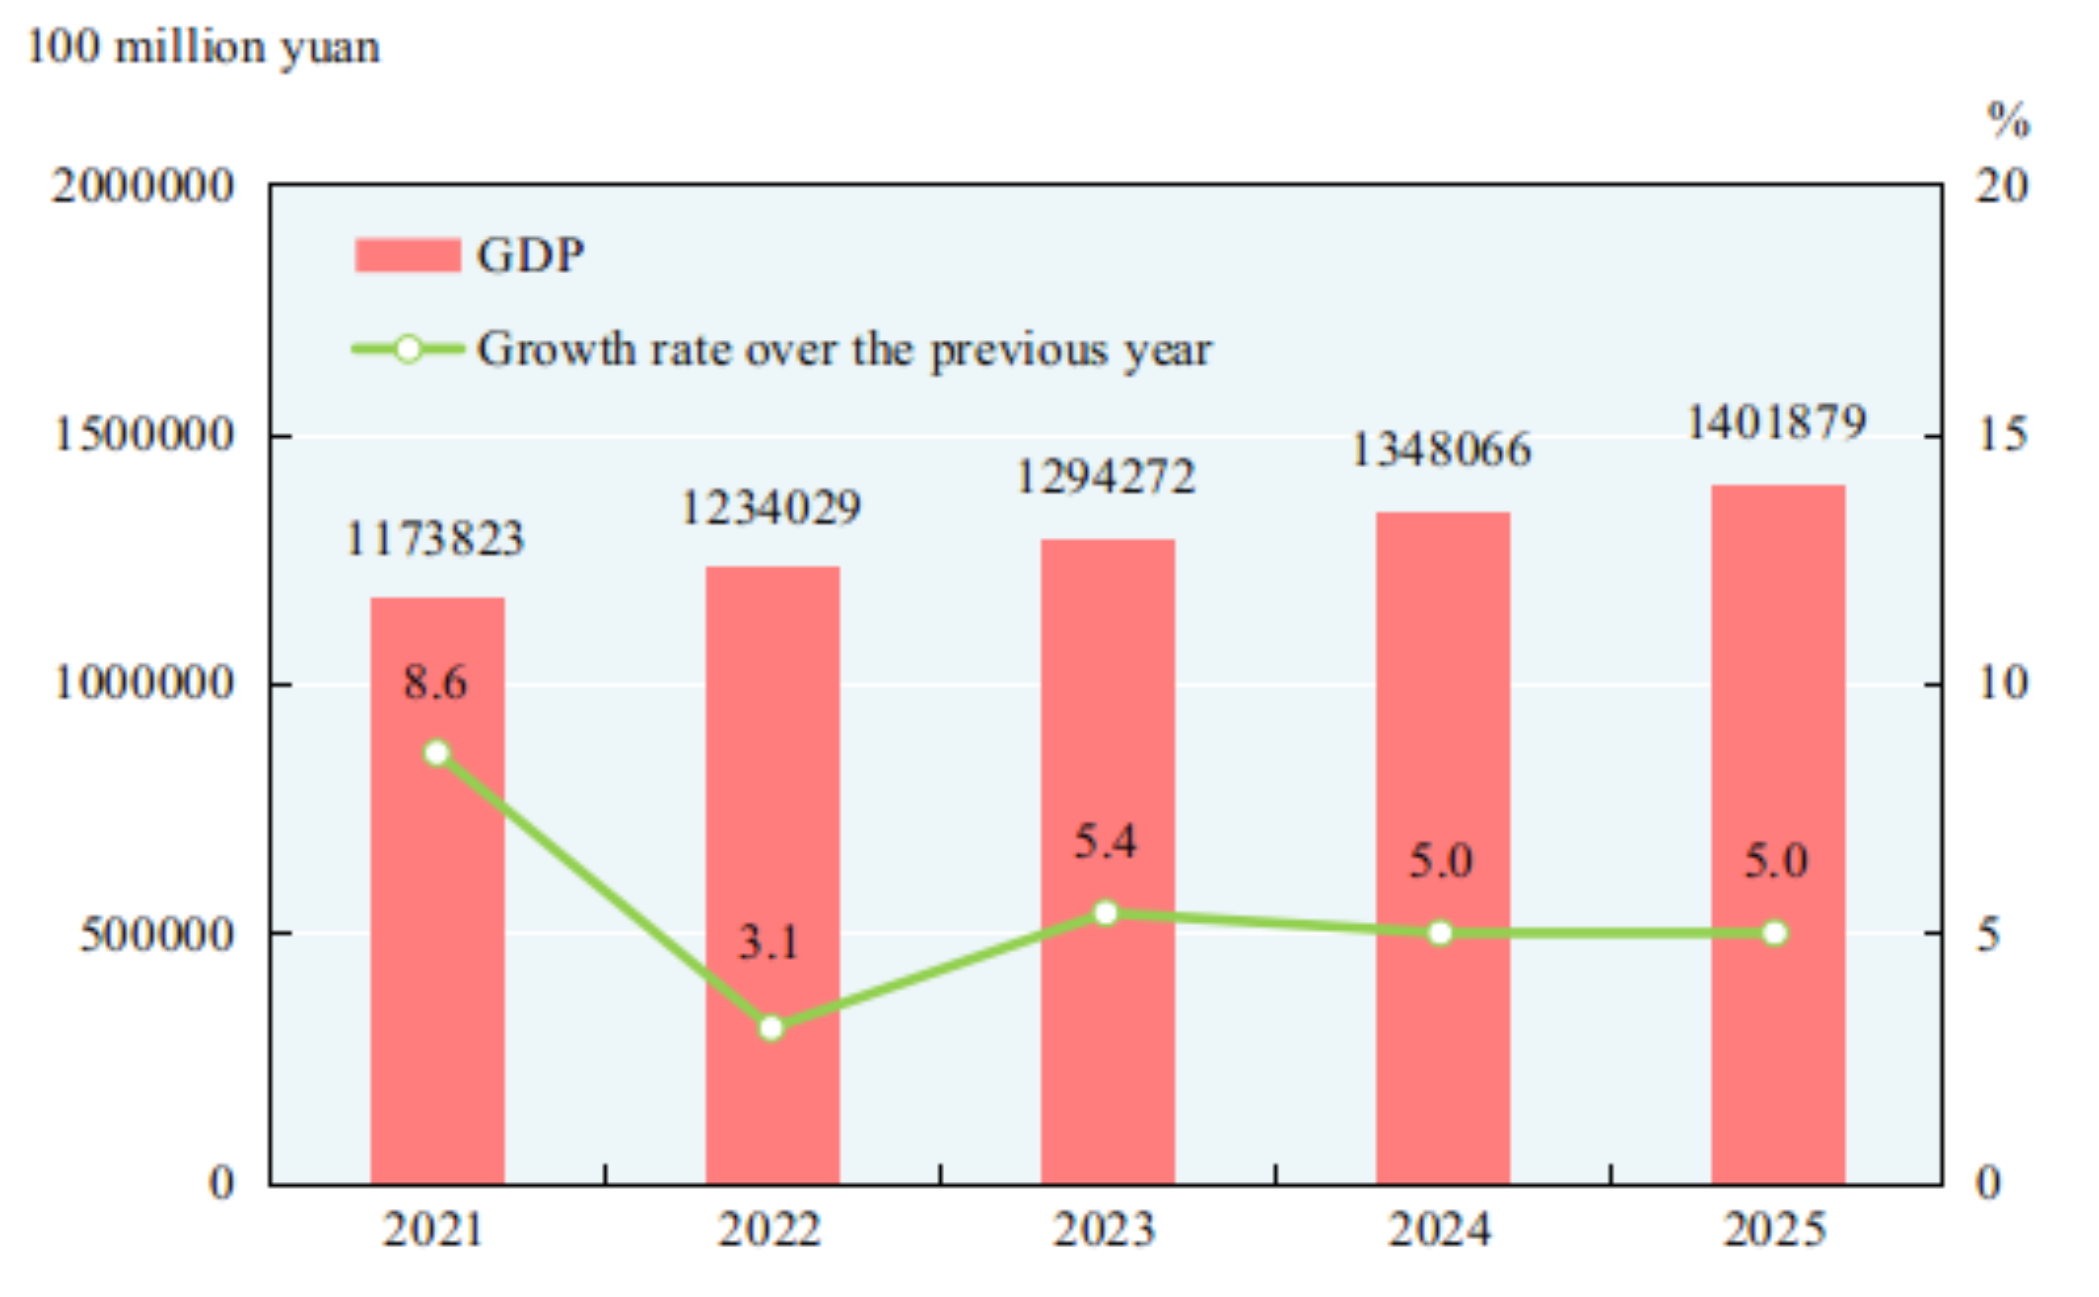
Figure 2: Shares of the Three Industries’ Value Added in GDP 2021-2025
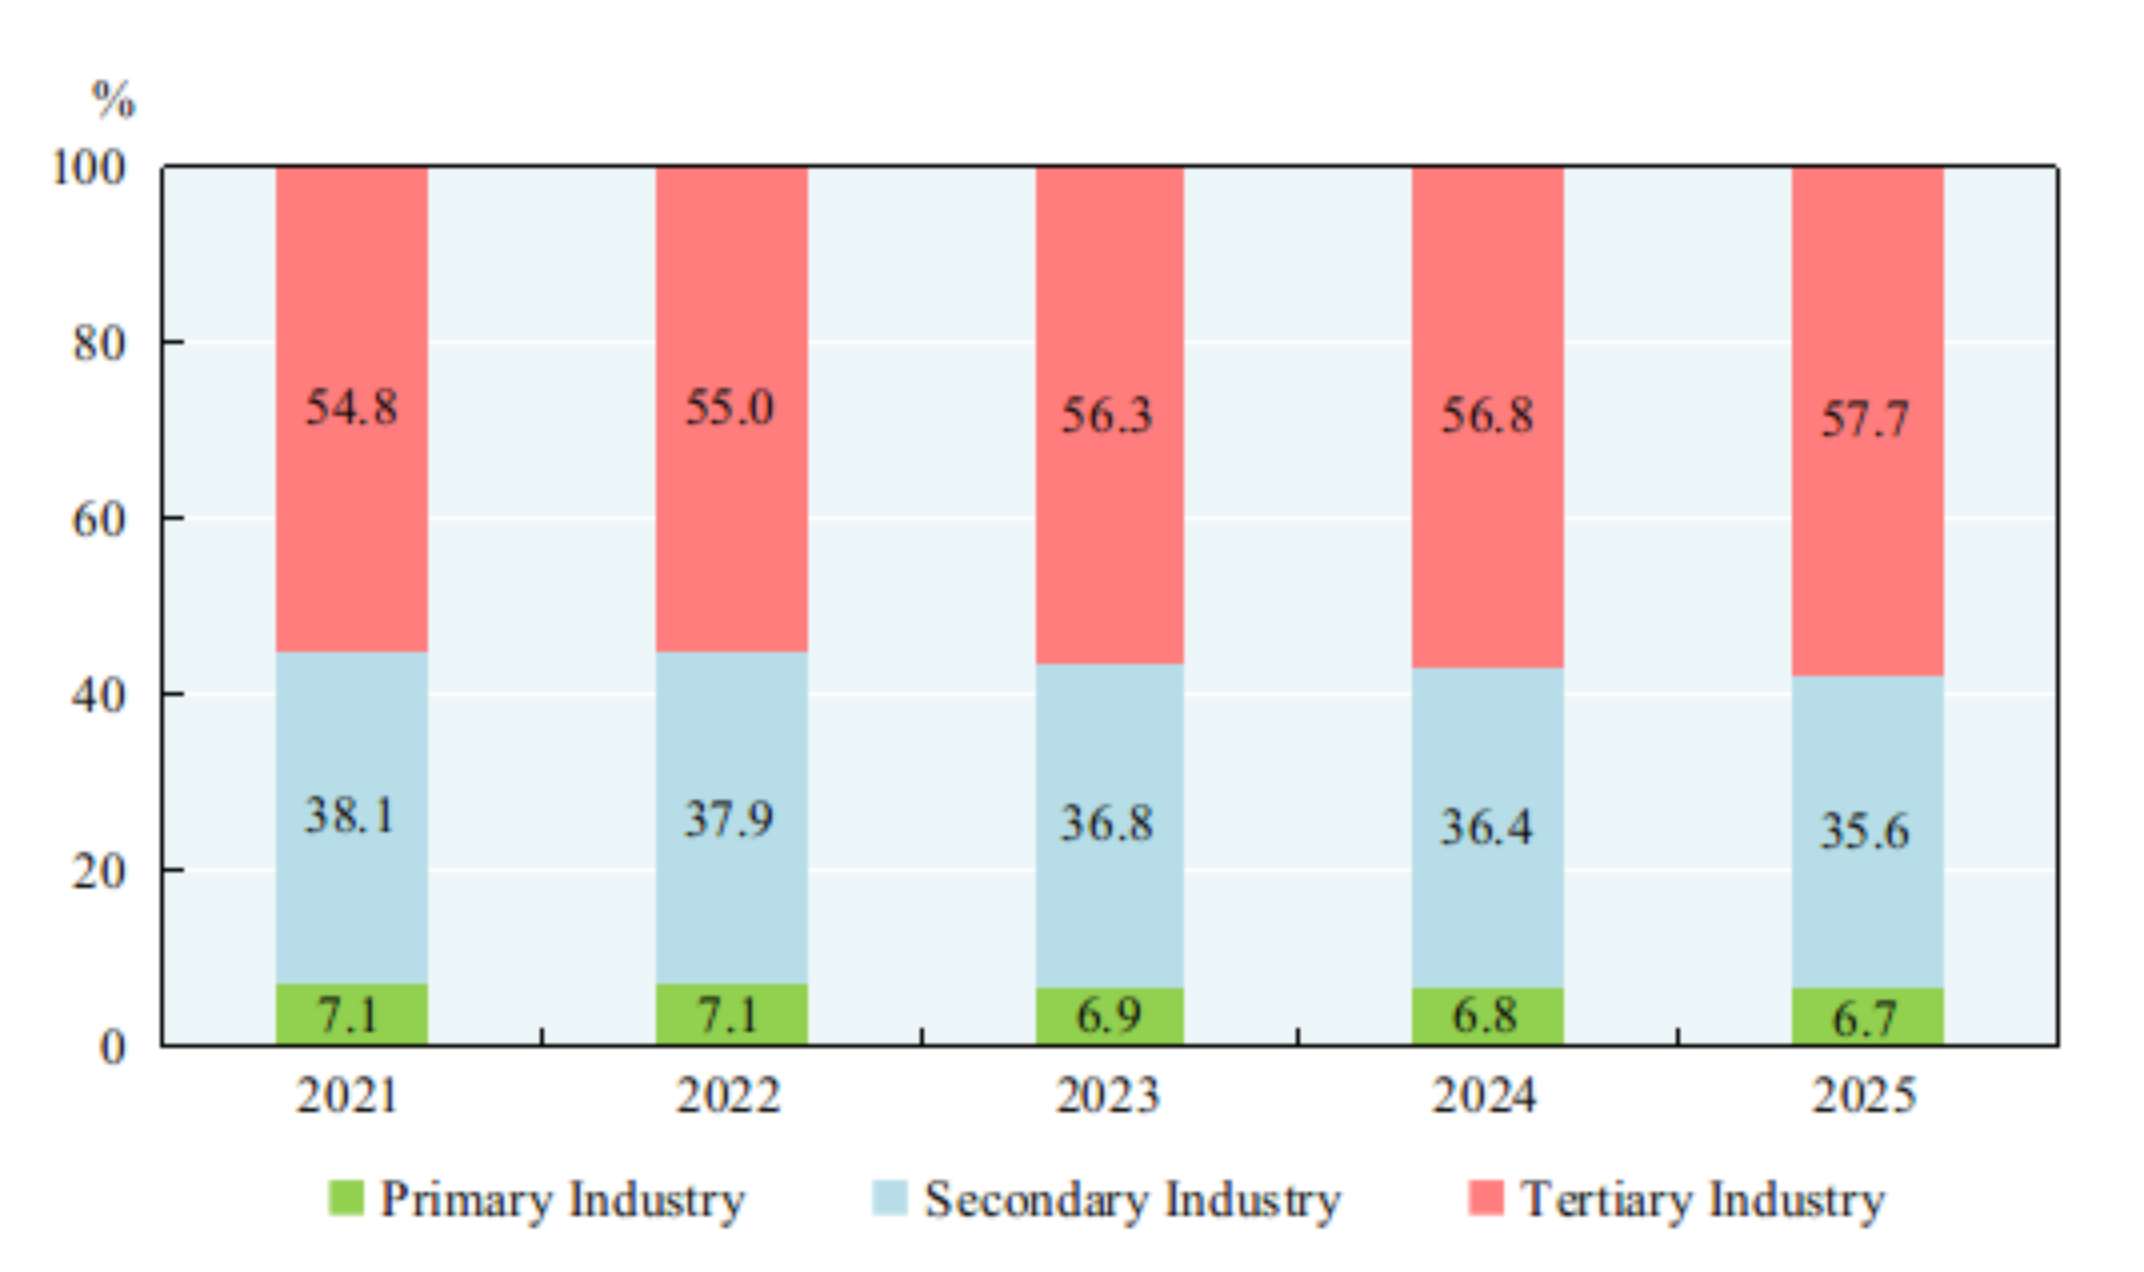
Figure 3: The Overall Labor Productivity 2021-2025
By the end of 2025, the total number of national population[5] reached 1,404.89 million, a decrease of 3.39 million over that at the end of 2024. Of this total, urban permanent residents numbered 953.80 million. There were 7.92 million births in 2025 with a crude birth rate of 5.63 per thousand; and there were 11.31 million deaths with a crude death rate of 8.04 per thousand. The natural growth rate was -2.41 per thousand.
Table 1: Population and Its Composition by the End of 2025
|
Item |
Population at Year-end (10,000 persons) |
Proportion (%) |
|
National Total |
140489 |
100.0 |
|
Of which: Urban |
95380 |
67.9 |
|
Rural |
45109 |
32.1 |
|
Of which: Male |
71685 |
51.0 |
|
Female |
68804 |
49.0 |
|
Of which: Aged 0-15 (under the age of 16)[6] |
23015 |
16.4 |
|
Aged 16-59 (under the age of 60) |
85136 |
60.6 |
|
Aged 60 and above |
32338 |
23.0 |
|
Of which: Aged 65 and above |
22365 |
15.9 |
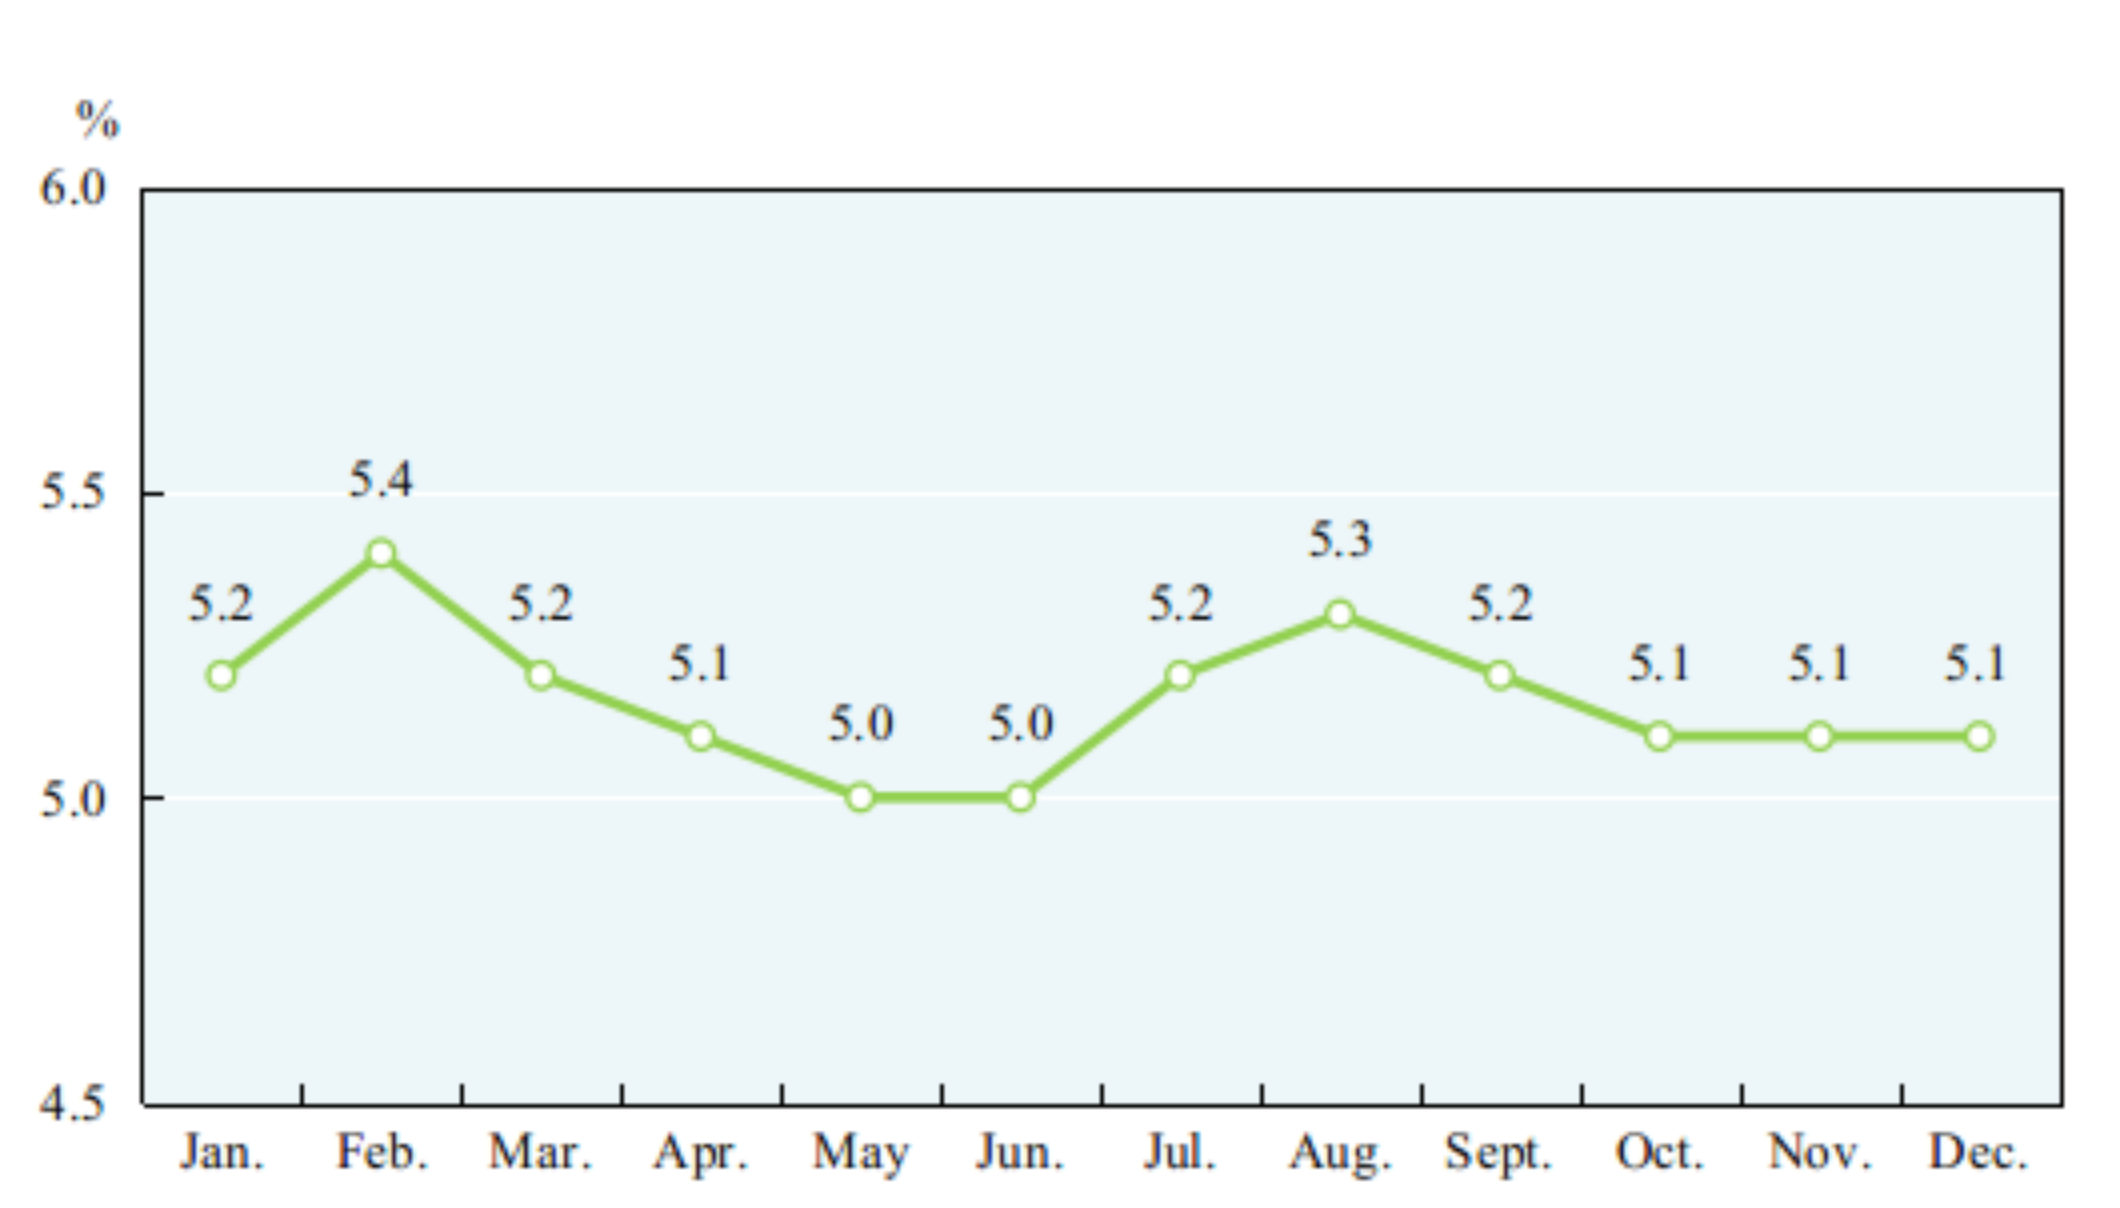
At the end of 2025, the number of employed people in China was 725.04 million, of which, that in urban areas was 475.35 million, accounting for 65.6 percent of the total employed people. The newly increased employed people in urban areas[7] numbered 12.67 million in 2025, 0.11 million more than that of the previous year. The urban surveyed unemployment rate in 2025 averaged 5.2 percent. The urban surveyed unemployment rate at the year end was 5.1 percent. The total number of migrant workers[8] was 301.15 million, up by 0.5 percent over that of 2024. Specifically, the number of migrant workers who left their hometowns and worked in other places was 180.06 million, up by 0.8 percent, and those who worked in their own localities reached 121.09 million, up by 0.1 percent.
Figure 4:Newly Increased Employed People in Urban Areas 2021-2025
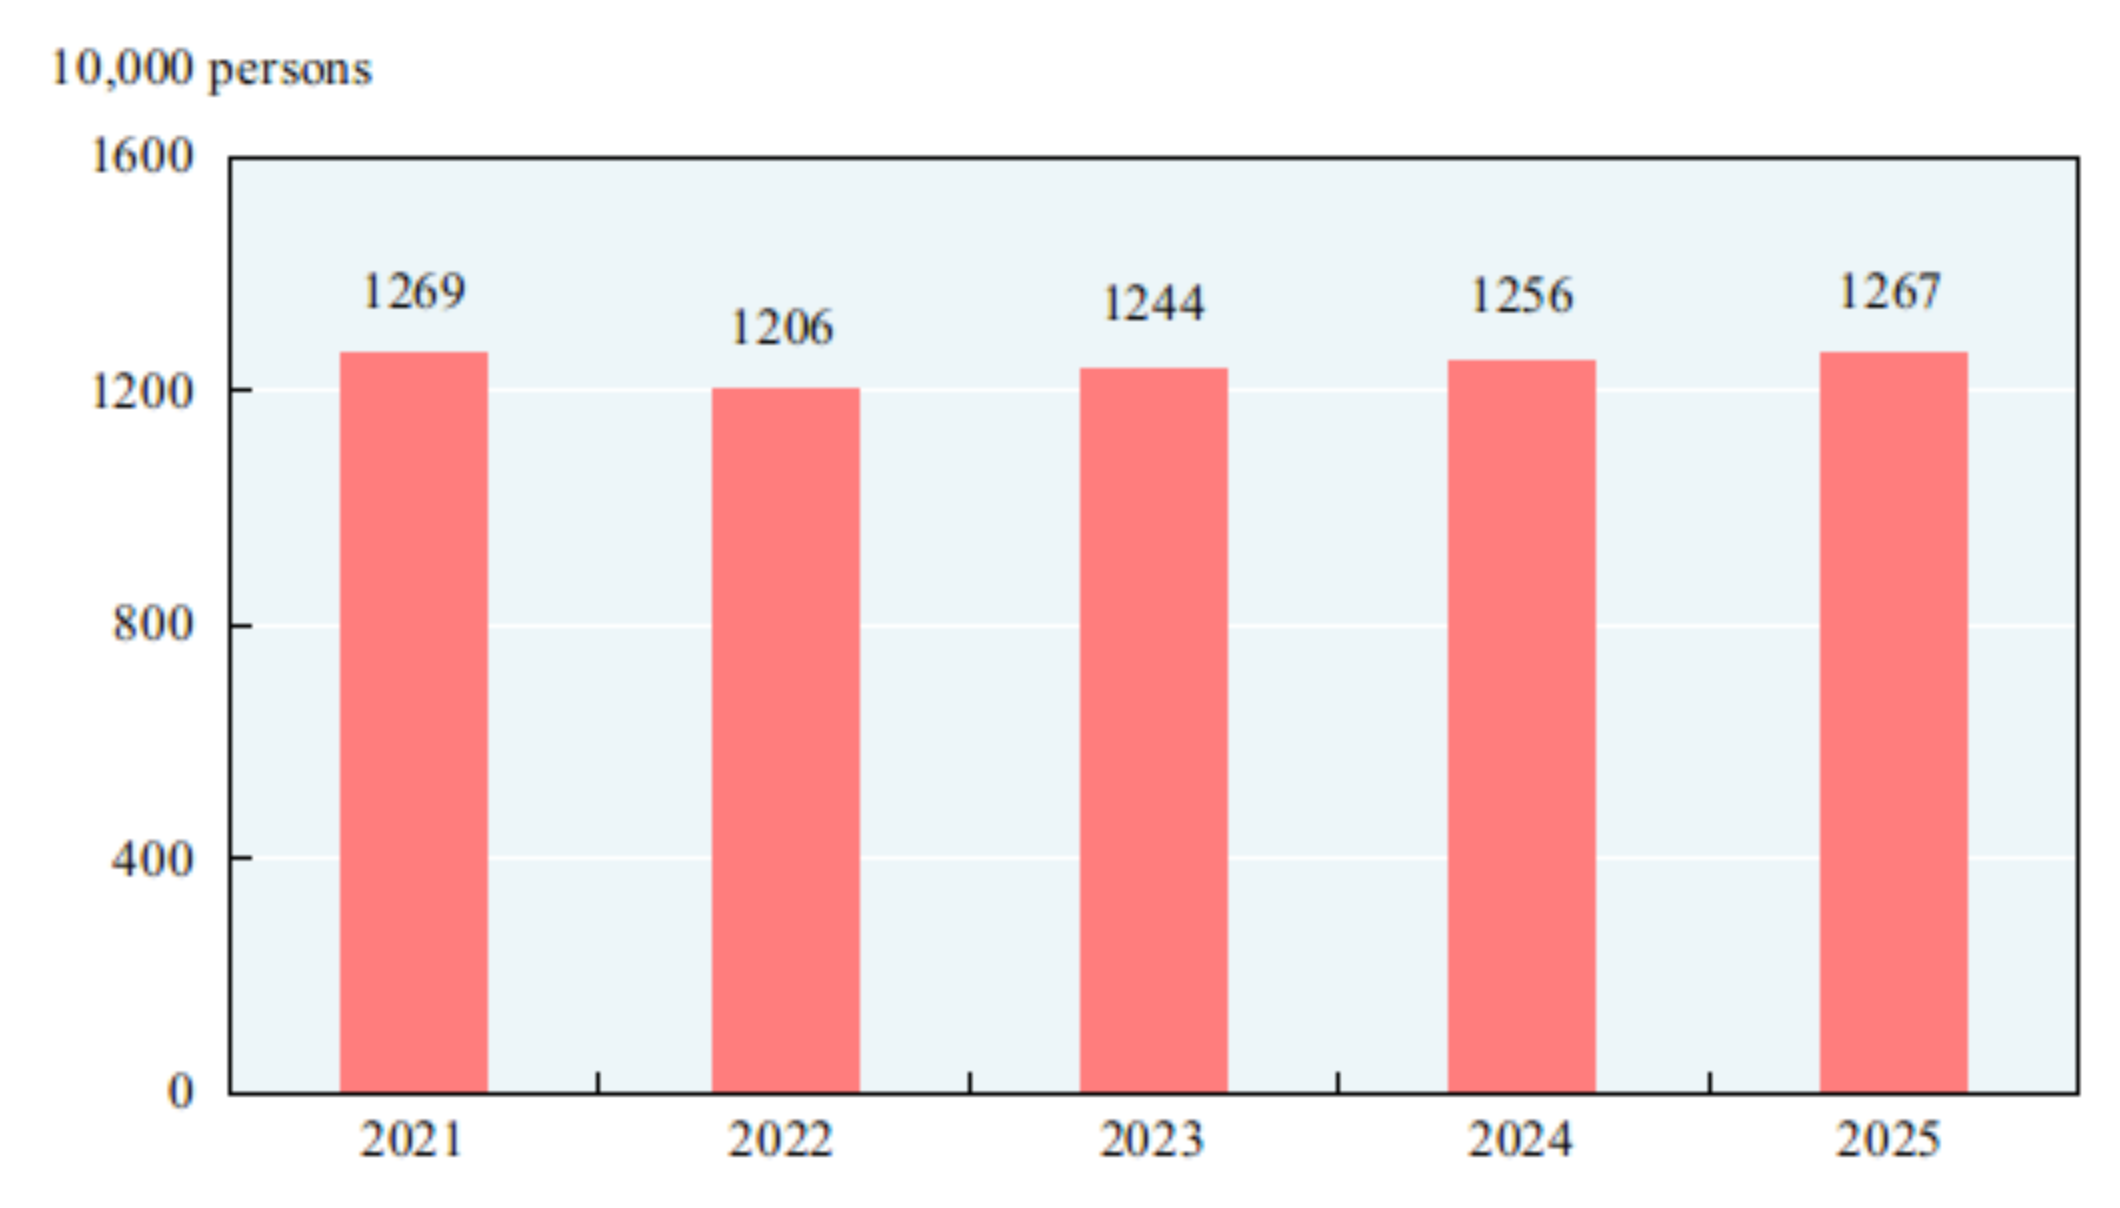
Figure 5:Monthly Changes of Urban Surveyed Unemployment Rate in 2025
The consumer prices in 2025 maintained the same level as that of the previous year. The producer prices for industrial products went down by 2.6 percent and the purchasing prices for industrial producers was down by 3.0 percent. The producer prices for farm products[9] dropped by 3.7 percent. In December, out of the 70 large and medium-sized cities, 6 cities experienced a month-on-month rise in sales prices of newly-built commercial residential buildings, 6 cities maintained the same level and 58 cities experienced a decline; 70 cities experienced a month-on-month decline in sales prices of second-hand housing. Five cities experienced a year-on-year rise in sales prices of newly-built commercial residential buildings, and 65 cities experienced a decline. The number of cities experiencing a year-on-year decline in sales prices of second-hand housing was 70.
Figure 6:Monthly Changes of Consumer Prices in 2025
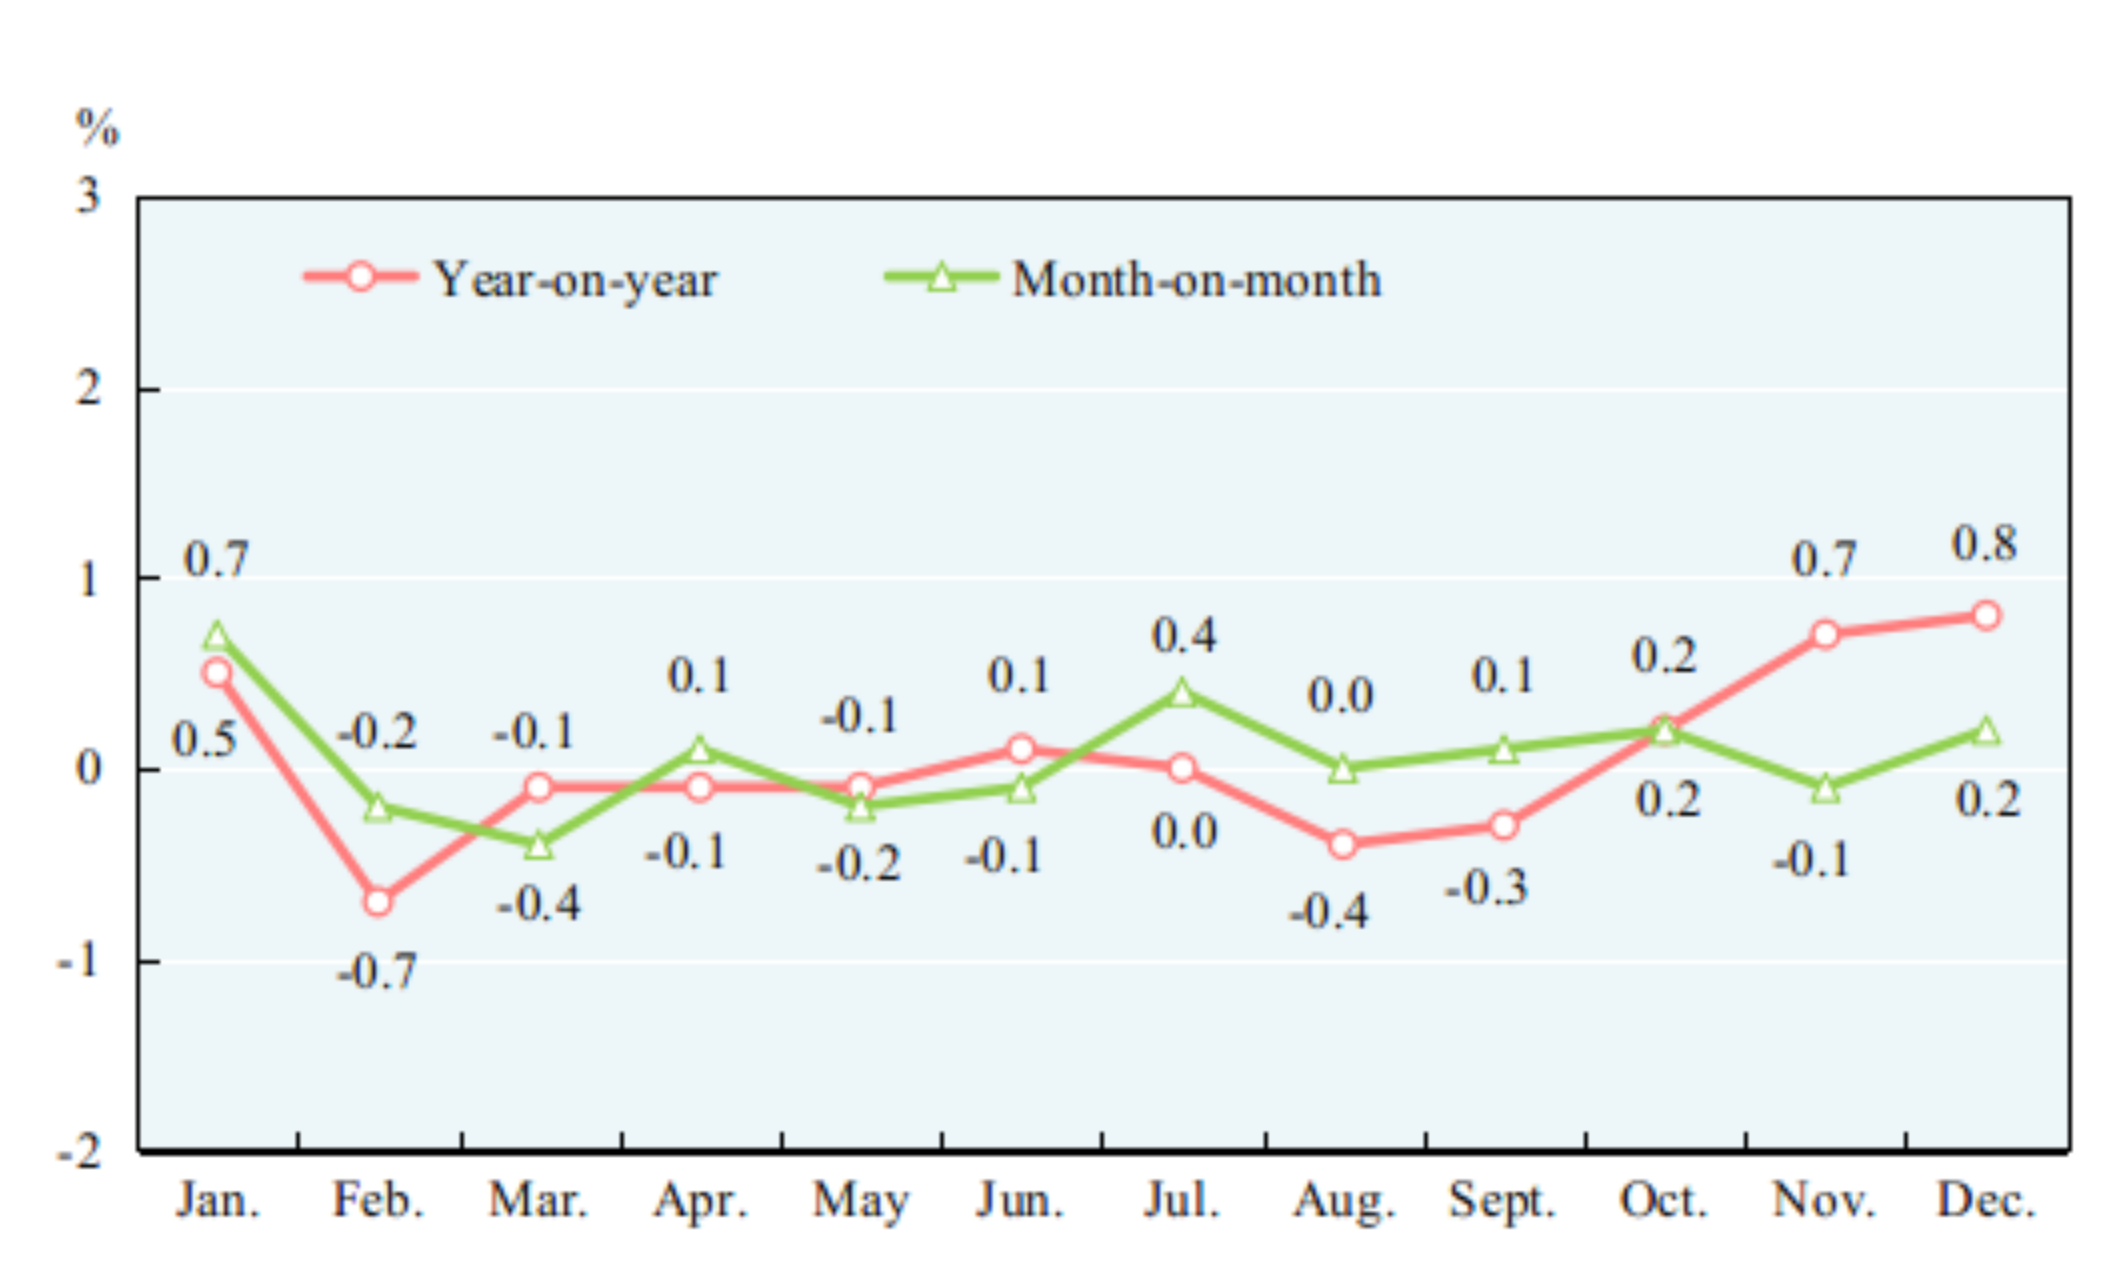
Table 2: Year-on-Year Changes of Consumer Prices in 2025
Unit: %
Item |
National |
| |
Urban |
Rural | ||
|
General level of consumer prices |
0.0 |
0.1 |
-0.2 |
|
Of which: Food,tobacco and alcohol |
-0.7 |
-0.5 |
-1.2 |
|
Clothing |
1.5 |
1.7 |
1.0 |
|
Housing[10] |
0.1 |
0.2 |
-0.2 |
|
Articles and services for daily use |
0.9 |
0.8 |
1.2 |
|
Transportation and communication |
-2.6 |
-2.7 |
-2.5 |
|
Education, culture and recreation |
0.8 |
0.8 |
1.0 |
|
Medical services and health care |
0.8 |
0.5 |
1.3 |
|
Other articles and services |
9.3 |
9.5 |
8.3 |
At the end of 2025, China’s foreign exchange reserves reached 3,357.9 billion US dollars, an increase of 155.5 billion US dollars compared with that at the end of 2024. The average exchange rate of the year was 7.1429 RMB to 1 USD dollar, depreciated by 0.3 percent over that of 2024.
Figure 7: Year-end China's Foreign Exchange Reserves 2021-2025
New quality productive forces grew at a steady pace. Among the industrial enterprises above the designated size[11], the value added of equipment manufacturing[12] was up by 9.2 percent over the previous year, accounting for 36.8 percent of that of all industrial enterprises above the designated size; the profits made by equipment manufacturing enterprises grew by 7.7 percent. The value added of high-tech manufacturing[13] increased by 9.4 percent, accounting for 17.1 percent of that of all industrial enterprises above the designated size; the profits made by high-tech manufacturing enterprises grew by 13.3 percent. The value added of digital products manufacturing[14] grew by 9.3 percent, accounting for 12.5 percent of that of all industrial enterprises above the designated size. The output of service robots reached 18.581 million, up by 16.1 percent over the previous year; that of mobile communication base station equipment reached 5.364 million radio frequency modules, up by 13.5 percent; and that of servers reached 5.970 million, up by 12.6 percent. Among the enterprises above the designated size in select service sectors[15], the business revenue of strategic emerging services[16] enterprises went up by 9.3 percent compared with the previous year, and that of high-tech services[17] enterprises increased by 7.9 percent. The e-commerce transactions[18] reached 46,733.9 billion yuan, up by 2.5 percent over the previous year. The online retail sales[19] reached 15,972.2 billion yuan, up by 8.6 percent over the previous year. Of the investment in fixed assets (excluding rural households)[20], the investment in purchase of equipment and instruments grew by 11.8 percent over the previous year. In 2025, the number of newly established business entities was 25.74 million, with 26 thousand enterprises newly established per day on average.
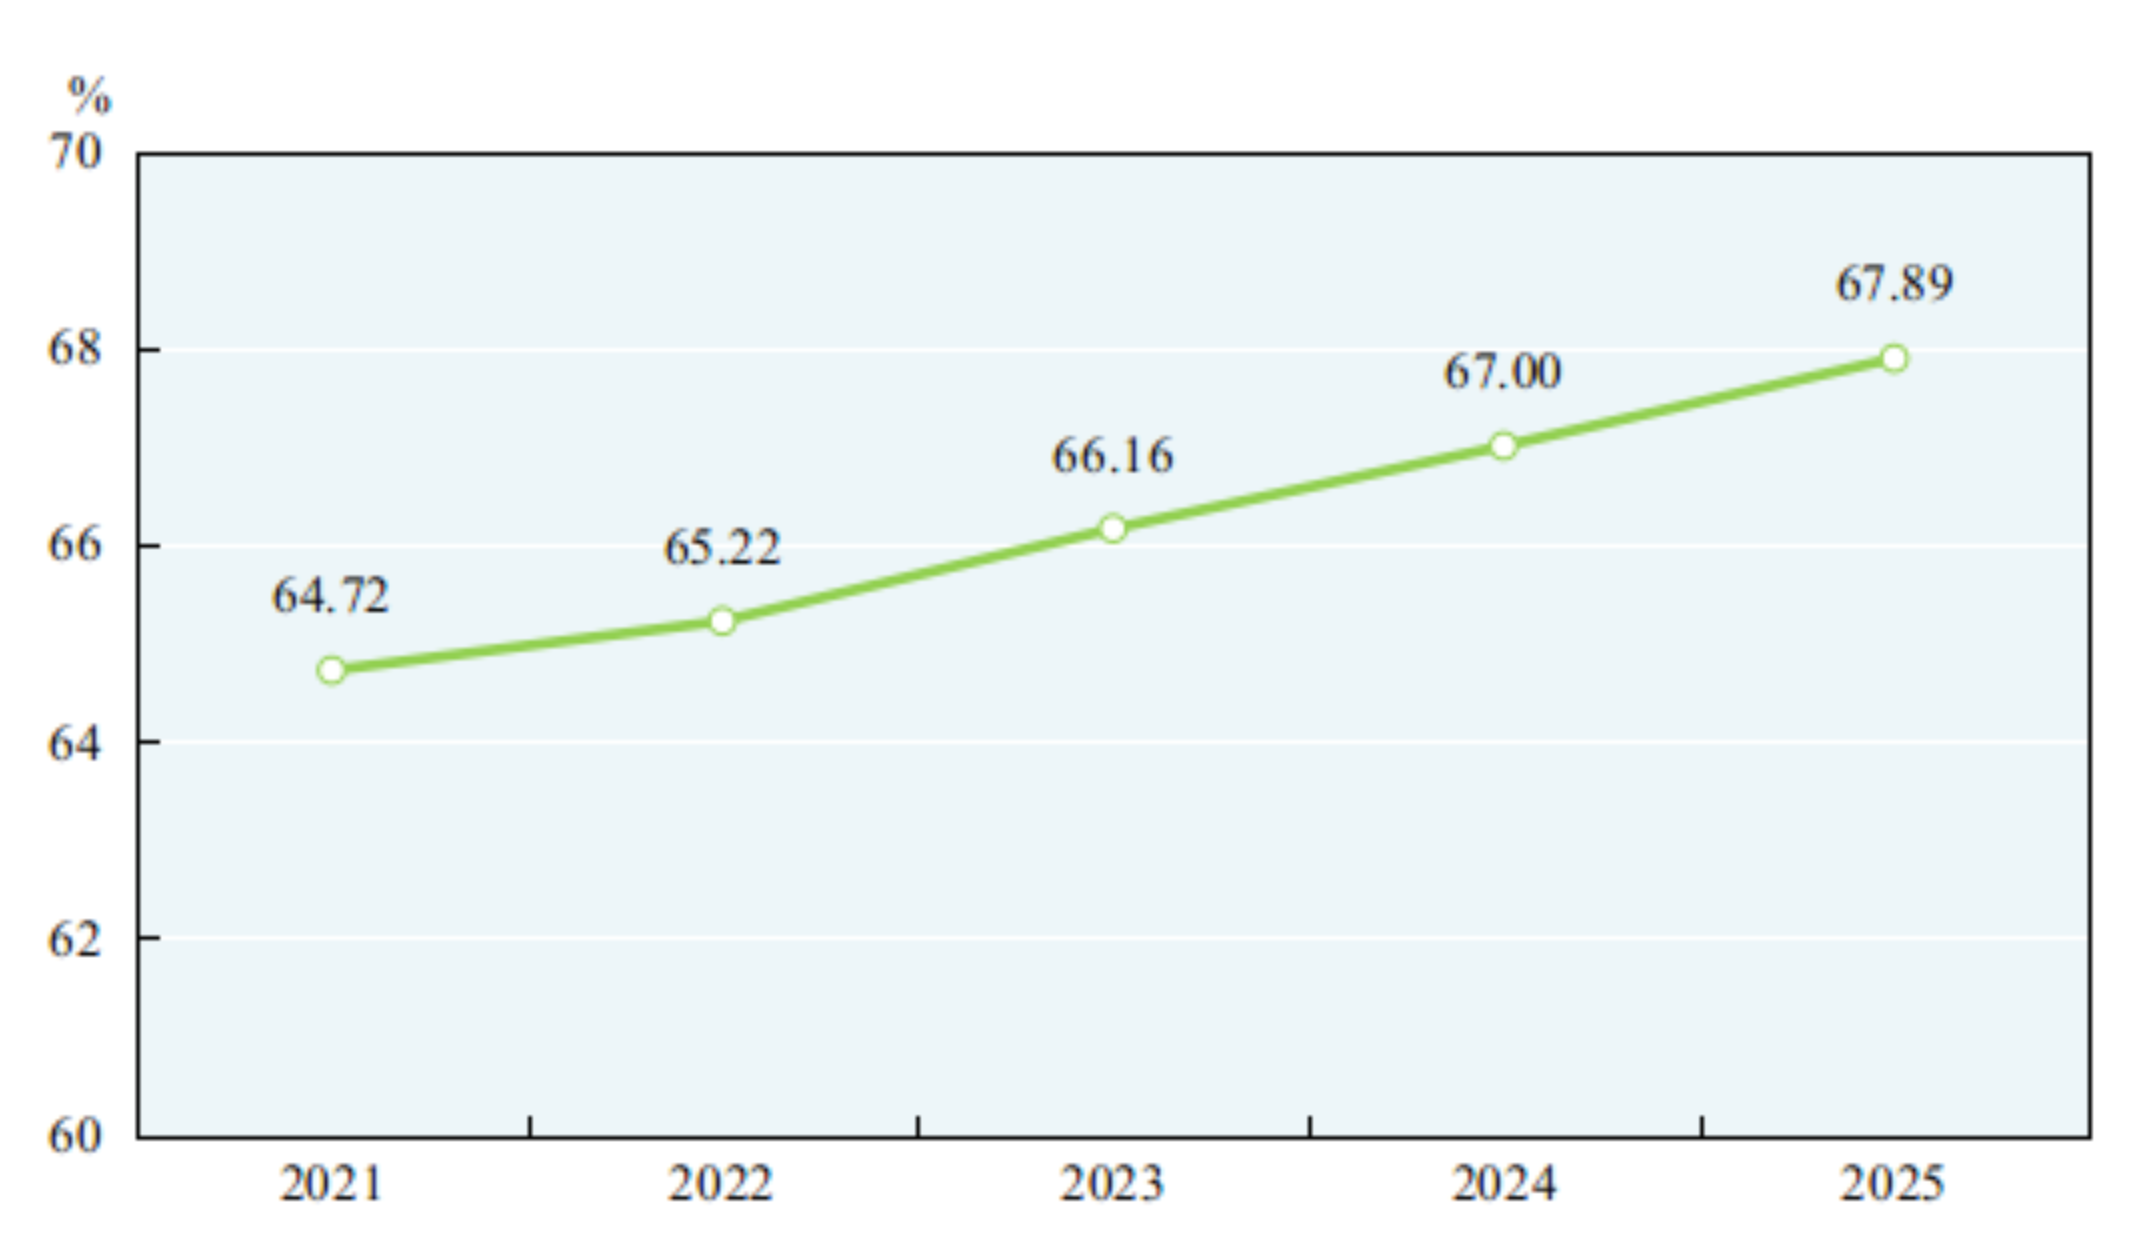
Solid progress was made in the integrated development of urban and rural areas and coordinated regional development. By the end of 2025, the urbanization rate of permanent residents reached 67.89 percent, 0.89 percentage points higher than that at the end of 2024. By region[21], in 2025, the gross domestic product in the eastern region was 73,087.6 billion yuan, an increase of 5.0 percent over the previous year; the central region, 29,910.8 billion yuan, up by 5.2 percent; the western region, 29,875.0 billion yuan, up by 5.1 percent; and the northeastern region, 6,503.5 billion yuan, up by 4.1 percent. In 2025, the gross domestic product in Beijing-Tianjin-Hebei Region reached 11,991.8 billion yuan, up by 5.4 percent over the previous year; that in the Yangtze River Economic Belt, 65,833.6 billion yuan, up by 5.2 percent; and that in the Yangtze River Delta, 34,659.5 billion yuan, up by 5.4 percent. Major regional strategies such as the construction of Guangdong-Hong Kong-Macao Greater Bay Areas, and the ecological protection and high-quality development of the Yellow River Basin made new achievements. The island-wide special customs operations were launched in the Hainan Free Trade Port.
Figure 8: Year-end Urbanization Rates of Permanent Residents 2021-2025
Green and low-carbon transformation achieved remarkable results. According to preliminary estimates, the national carbon dioxide emissions per 10,000 yuan worth of GDP[22] in 2025 dropped by 5.0 percent over that of the previous year. The electricity generated by clean energy such as hydropower, nuclear power, wind power and solar power was 4,248.1 billion kilowatts-hours, up by 14.4 percent over the previous year. The output of new energy vehicles reached 16.524 million, up by 25.1 percent over the previous year; the total number of new energy vehicles reached 43.97 million by the end of 2025, an increase of 12.57 million over that at the end of the previous year. Of the monitored 339 cities at prefecture level and above, 72.6 percent reached the air quality standard. Of the 3,641 sections under the national monitoring program for surface water, 91.4 percent were of fairly clean water quality (Grade I to III), 6.9 percent were Grade IV, 1.1 percent were Grade V and 0.6 percent were worse than Grade V national standard.
II. Agriculture
In 2025, the sown area of grain was 119.41 million hectares, an increase of 0.09 million hectares compared with that in 2024. Of this total, the sown area of rice was 29.01 million hectares, an increase of 0.01 million hectares; the sown area of wheat was 23.58 million hectares, a decrease of 0.01 million hectares; the sown area of corn was 44.96 million hectares, an increase of 0.22 million hectares; the sown area of soybean was 10.26 million hectares, a decrease of 0.07 million hectares. The sown area of cotton was 2.98 million hectares, an increase of 0.14 million hectares. The sown area of oil-bearing crops was 14.45 million hectares, an increase of 0.16 million hectares; the sown area of sugar crops was 1.49 million hectares, an increase of 0.03 million hectares.
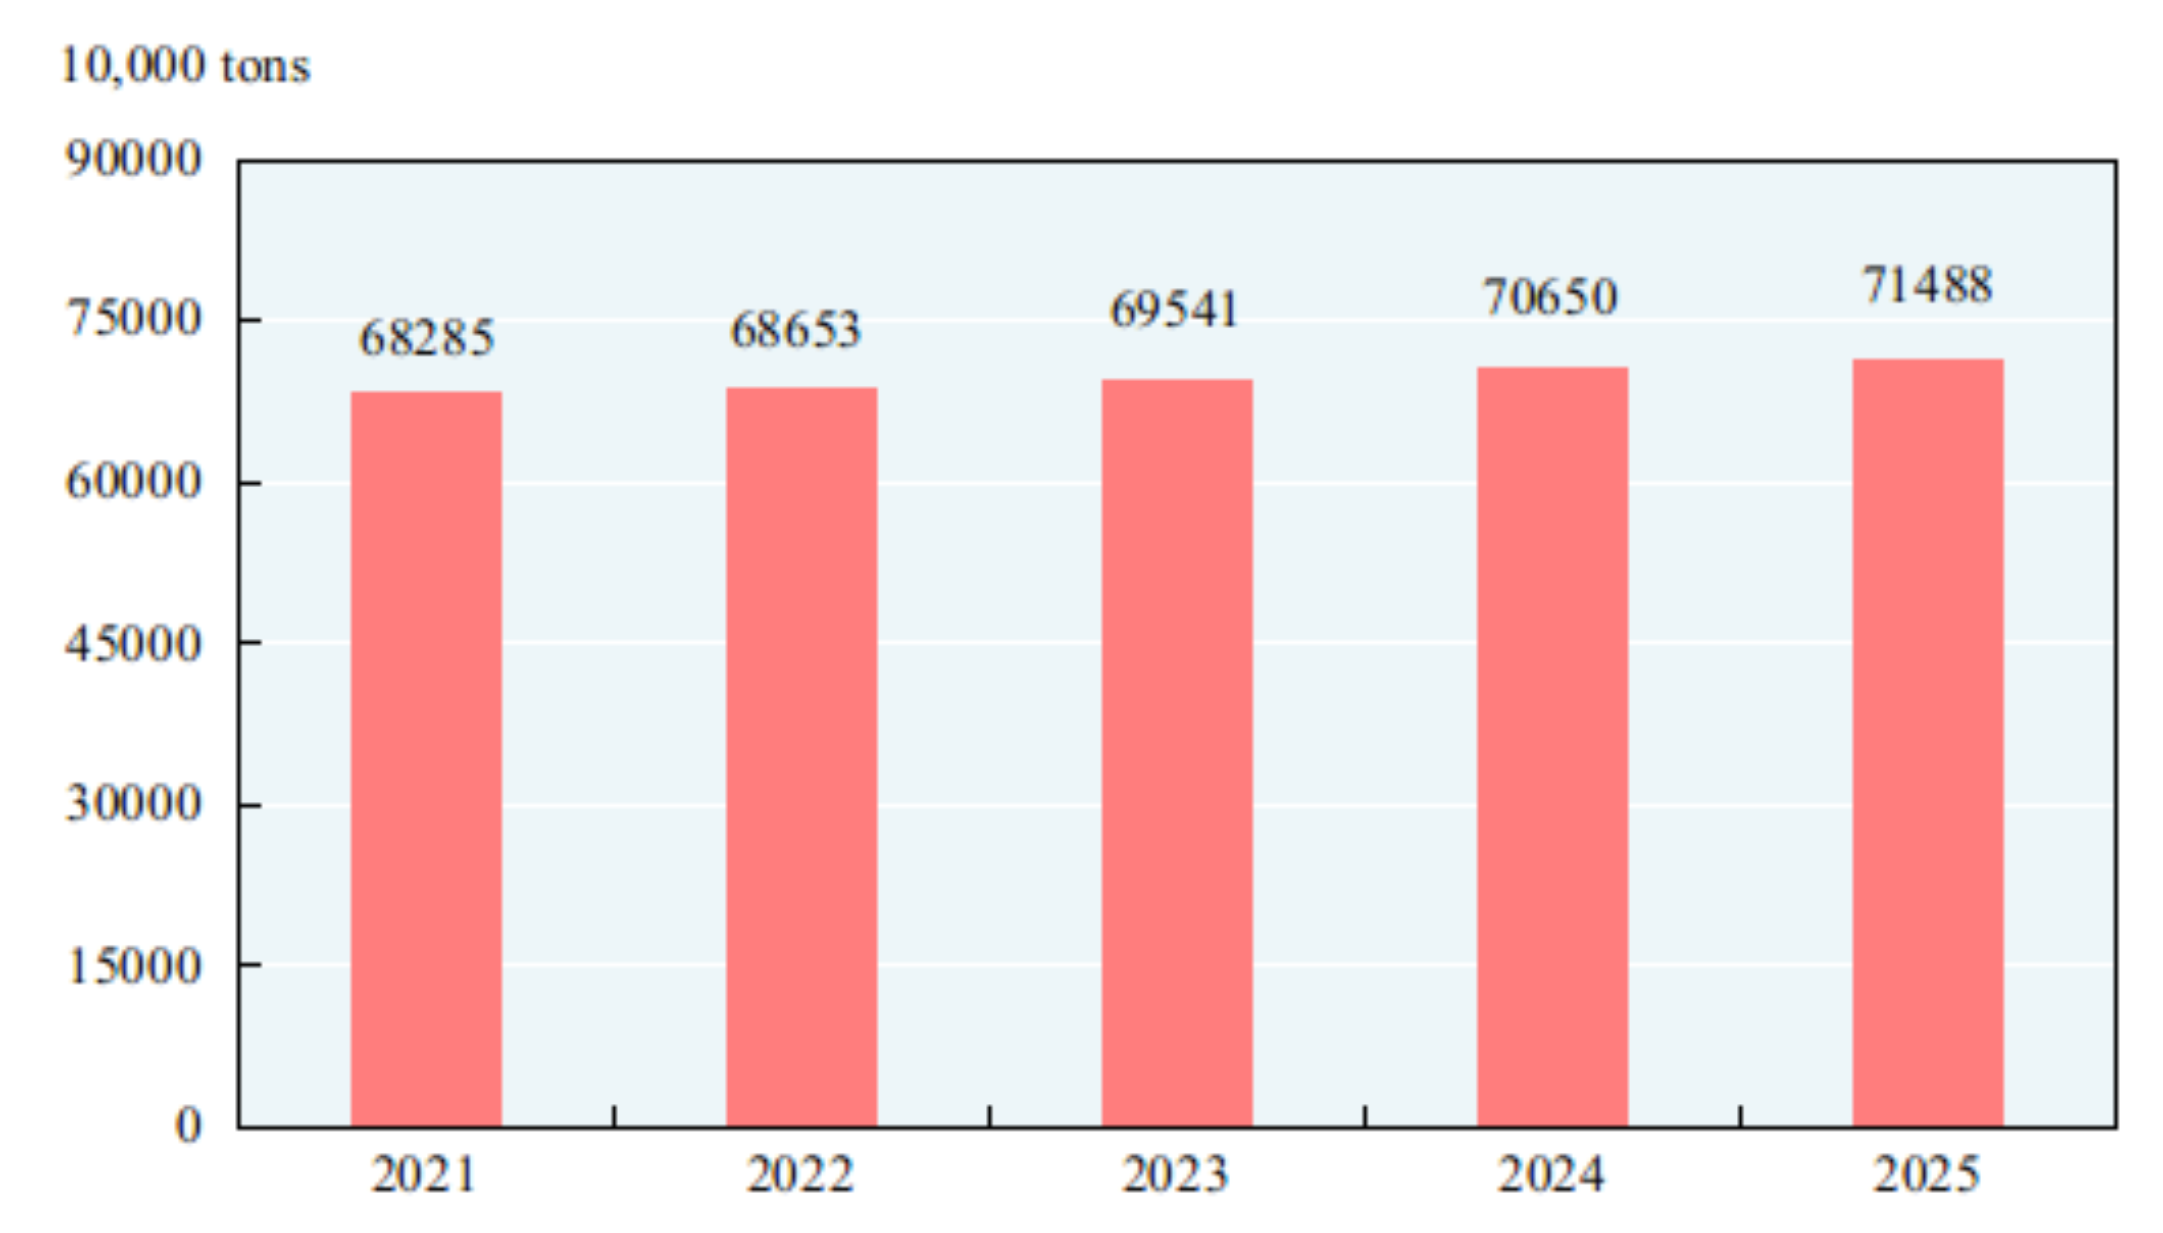
The total output of grain in 2025 was 714.88 million tons, an increase of 8.38 million tons over the previous year, up by 1.2 percent. Of this total, the output of summer crops was 149.75 million tons, down by 0.1 percent, that of the early rice was 28.51 million tons, up by 1.2 percent, and that of autumn grain was 536.62 million tons, up by 1.5 percent. The output of cereal was 660.21 million tons, up by 1.2 percent over that of 2024, among which the output of rice was 209.04 million tons, up by 0.7 percent; that of wheat was 140.07 million tons, the same level as that of the previous year; and that of corn was 301.24 million tons, up by 2.1 percent. The output of soybean was 20.91 million tons, up by 1.3 percent over the previous year.
Figure 9: Output of Grain 2021-2025
In 2025, the output of cotton was 6.64 million tons, up by 7.7 percent over the previous year, that of oil-bearing crops was 40.96 million tons, up by 2.9 percent, that of sugar crops was 117.01 million tons, up by 2.1 percent, and that of tea was 3.92 million tons, up by 4.8 percent.
The total output of pork, beef, mutton and poultry in 2025 was 100.72 million tons, up by 4.2 percent over the previous year. Of this total, the output of pork was 59.38 million tons, up by 4.1 percent; that of beef was 8.01 million tons, up by 2.8 percent; that of mutton was 4.96 million tons, down by 4.2 percent; and that of poultry was 28.37 million tons, up by 6.7 percent. The total output of eggs was 34.98 million tons, down by 2.5 percent. The output of milk was 40.91 million tons, up by 0.3 percent. At the end of the year, 429.67 million pigs were registered in the total stocks, up by 0.5 percent compared with that at the end of 2024, and 719.73 million pigs were slaughtered, up by 2.4 percent over the previous year.
The total output of aquatic products in 2025 was 76.57 million tons, up by 4.1 percent over the previous year. Of this total, the output of cultured aquatic products was 63.24 million tons, up by 4.4 percent; and that of fished aquatic products was 13.33 million tons, up by 2.7 percent.
The total production of timber in 2025 reached 139.37 million cubic meters, down by 1.1 percent over the previous year.
III. Industry and Construction
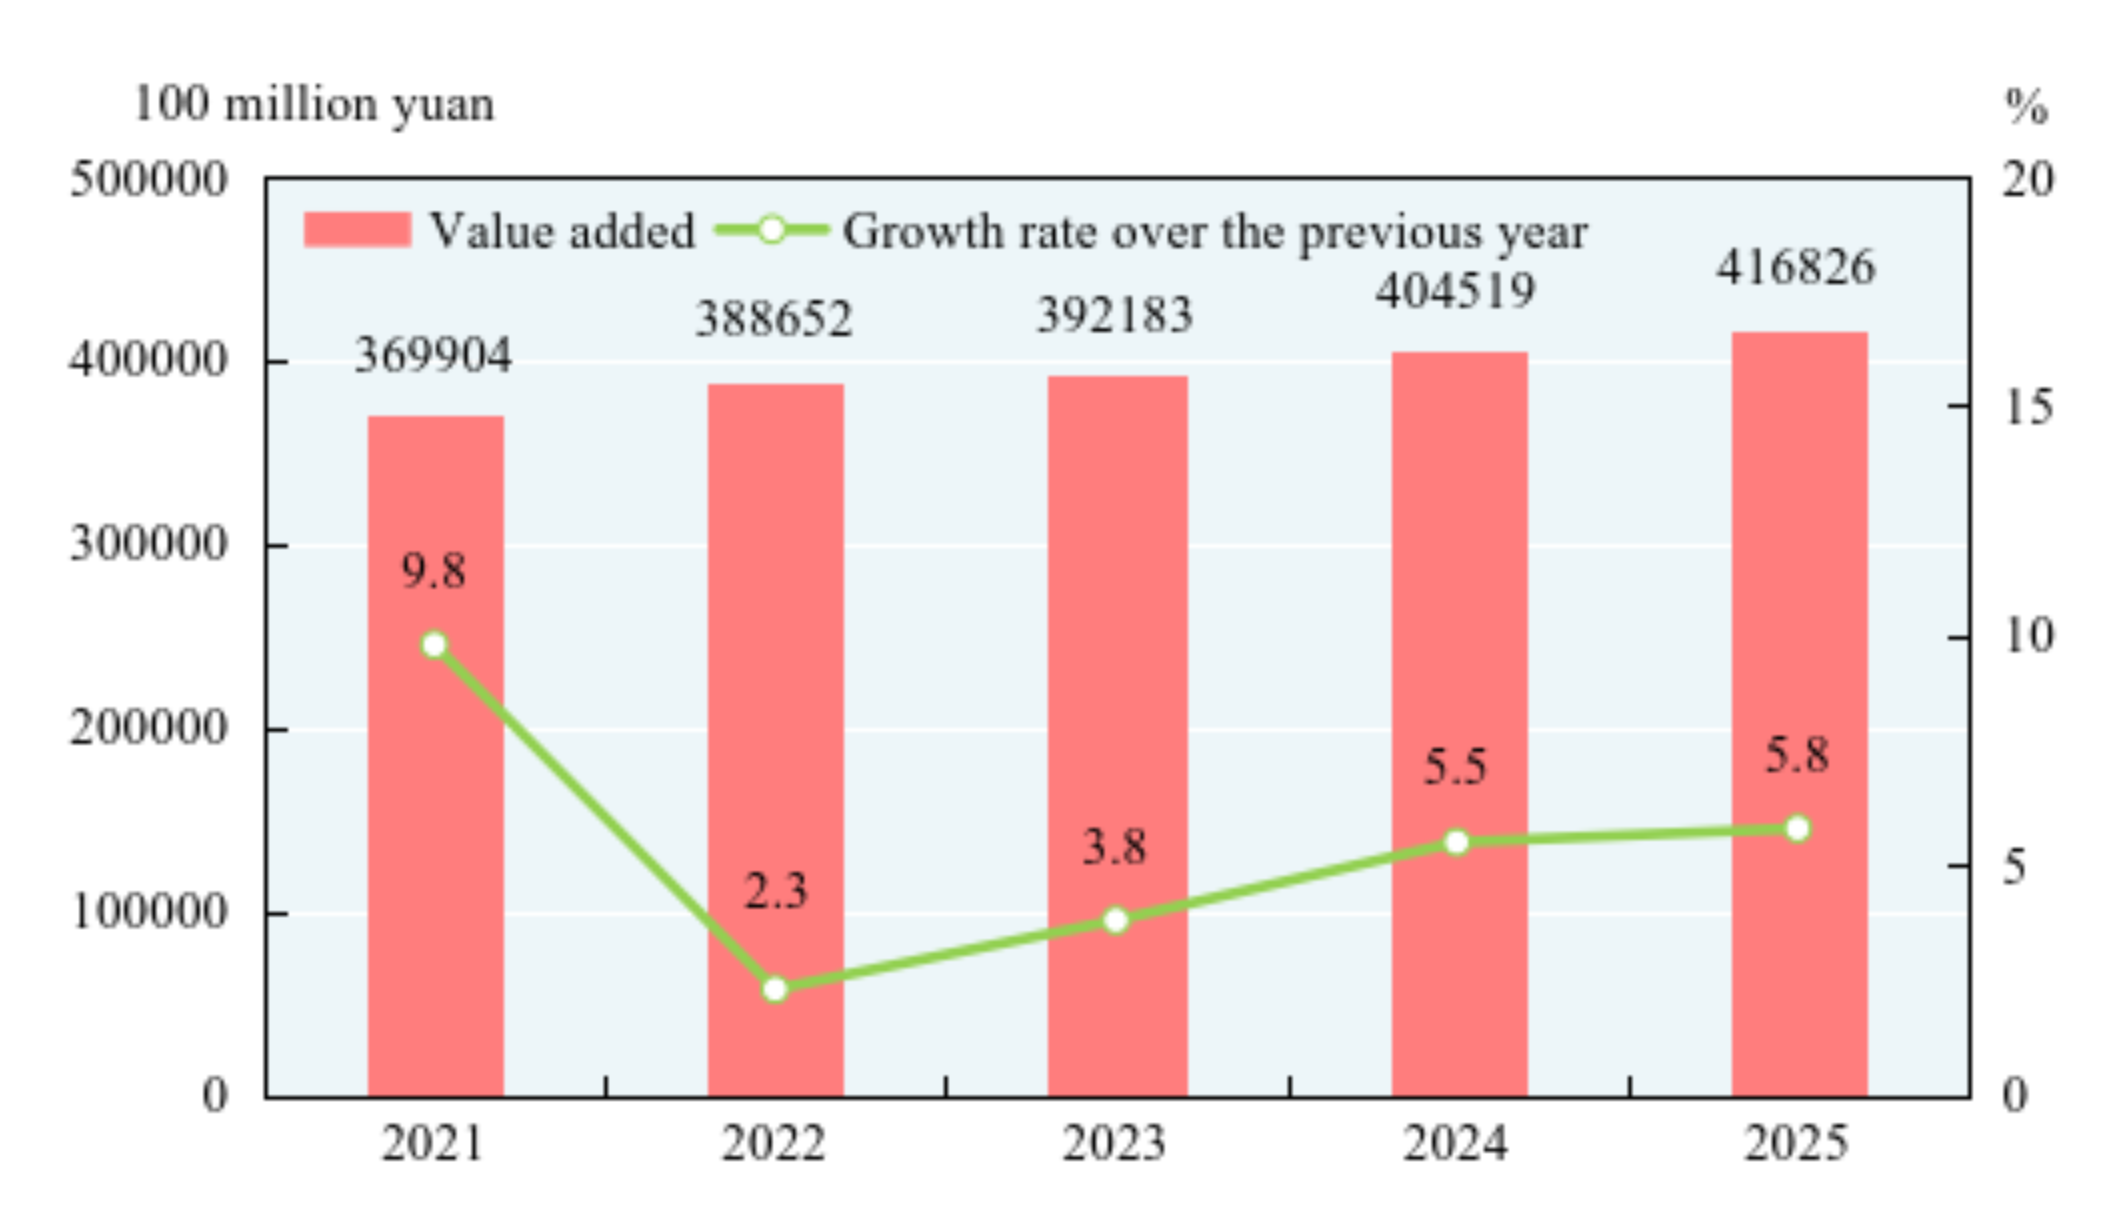
In 2025, the total value added of the industrial sector was 41,682.6 billion yuan, up by 5.8 percent over the previous year. The value added of industrial enterprises above the designated size increased by 5.9 percent. Of the industrial enterprises above the designated size, in terms of ownership, the value added of state-holding enterprises was up by 4.6 percent, that of share-holding enterprises up by 6.3 percent, that of enterprises funded by foreign investors or investors from Hong Kong, Macao and Taiwan up by 3.9 percent, and that of private enterprises up by 5.3 percent. In terms of sectors, the value added of the mining industry was up by 5.6 percent, that of manufacturing up by 6.4 percent and that of production and supply of electricity, heat power, gas and water up by 2.3 percent.
Figure 10: Value Added and Growth Rates of Industrial Enterprises 2021-2025
In 2025, of the industrial enterprises above the designated size, the value added for processing of food from agricultural and sideline products was up by 5.6 percent over the previous year; for textile industry up by 3.0 percent; for manufacture of raw chemical materials and chemical products up by 7.8 percent; for manufacture of non-metallic mineral products down by 0.6 percent; for smelting and pressing of ferrous metals up by 4.5 percent; for manufacture of general purpose machinery up by 8.0 percent; for manufacture of special purpose machinery up by 4.3 percent; for manufacture of automobiles up by 11.5 percent; for manufacture of electrical machinery and apparatus up by 9.2 percent; for manufacture of computers, communication equipment and other electronic equipment up by 10.6 percent; for production and supply of electricity and heat power up by 2.2 percent.
Table 3: Output of Major Industrial Products and Growth Rates of the Industrial Enterprises above the Designated Size in 2025[23]
|
Product |
Unit |
Output |
Increase over 2024 (%) |
|
Yarn |
10000 tons |
2215.8 |
-0.1 |
|
Cloth |
100 million meters |
306.7 |
0.2 |
|
Chemical fiber |
10000 tons |
8701.1 |
4.9 |
|
Refined sugar (final product) |
10000 tons |
1621.0 |
9.0 |
|
Cigarettes |
100 million |
24703.9 |
0.2 |
|
Color TV sets |
10000 |
20273.9 |
-2.6 |
|
Household refrigerators |
10000 |
10924.4 |
1.6 |
|
Air conditioners |
10000 |
26697.5 |
0.7 |
|
Crude steel |
10000 tons |
96081.2 |
-4.4 |
|
Rolled steel[24] |
10000 tons |
144612.1 |
3.1 |
|
Ten kinds of nonferrous metals |
10000 tons |
8175.0 |
3.9 |
|
Of which: Refined copper (copper) |
10000 tons |
1472.0 |
10.4 |
|
Aluminum electrolyze |
10000 tons |
4501.6 |
2.4 |
|
Cement |
100 million tons |
16.9 |
-6.9 |
|
Sulfuric acid (100%) |
10000 tons |
11081.6 |
4.5 |
|
Caustic soda (100%) |
10000 tons |
4653.5 |
5.0 |
|
Ethylene |
10000 tons |
4150.8 |
6.4 |
|
Chemical fertilizer (100 percent equivalent) |
10000 tons |
6480.8 |
7.1 |
|
Power generation equipment |
10000 kilowatts |
37087.4 |
37.6 |
|
Motor vehicles |
10000 |
3477.8 |
9.8 |
|
Of which: New energy vehicles |
10000 |
1652.4 |
25.1 |
|
Integrated circuits |
100 million pieces |
4842.8 |
10.9 |
|
Mobile telephones |
10000 |
154123.9 |
-5.8 |
|
Micro computer equipment |
10000 |
33186.1 |
-2.9 |
|
Industrial robots |
10000 sets |
77.3 |
28.0 |
|
Ultra-clear glass for solar industry |
10000 square meters |
316135.4 |
3.4 |
|
Charging piles |
10000 |
574.5 |
11.0 |
|
Solar cells (photovoltaic cells) |
10000 kilowatts |
83274.3 |
7.6 |
|
3D printing devices |
10000 |
521.1 |
52.5 |
In 2025, the profits made by industrial enterprises above the designated size[25] were 7,398.2 billion yuan, up by 0.6 percentover the previous year. By ownership, the profits of state-holding enterprises were 2,056.1 billion yuan, down by 3.9 percent over the previous year; those of share-holding enterprises were 5,540.8 billion yuan, down by 0.1 percent; those of enterprises funded by foreign investors or investors from Hong Kong, Macao and Taiwan were 1,744.7 billion yuan, up by 4.2 percent; and those of private enterprises were 2,281.1 billion yuan, the same as that of the previous year. In terms of different sectors, the profits of mining were 834.5 billion yuan, down by 26.2 percent over the previous year; those of manufacturing were 5,691.6 billion yuan, up by 5.0 percent; and those of the production and supply of electricity, heat power, gas and water were 872.1 billion yuan, up by 9.4 percent. The cost for per-hundred-yuan business revenue of the industrial enterprises above the designated size was 85.31 yuan, 0.16 yuan more than that of 2024; the profit rate of the business revenue was 5.31 percent, 0.03 percentage points down. By the end of 2025, the asset-liability ratio of industrial enterprises above the designated size was 57.6 percent, 0.1 percentage points lower than that at the end of 2024. The capacity utilization rate[26] of industrial enterprises above the designated size was 74.4 percent in 2025.
According to preliminary estimates, the total primary energy output in 2025 was 5.13 billion tons of standard coal equivalent, up by 3.6 percent over that of the previous year.
Table 4: Output of Major Energy Products and Growth Rates in 2025
|
Product |
Unit |
Output |
Increase over 2024 (%) |
|
Coal |
100 million tons |
48.5 |
1.4 |
|
Crude petroleum oil |
10000 tons |
21608.7 |
1.5 |
|
Natural gas |
100 million cubic meters |
2620.6 |
6.3 |
|
Electricity |
100 million kilowatt-hours |
105752.5 |
4.8 |
|
Of which:Thermal power[27] |
100 million kilowatt-hours |
63271.5 |
-0.7 |
|
Hydropower |
100 million kilowatt-hours |
14616.7 |
2.5 |
|
Nuclear-power |
100 million kilowatt-hours |
4852.3 |
7.6 |
|
Wind power |
100 million kilowatt-hours |
11279.2 |
13.1 |
|
Solar power |
100 million kilowatt-hours |
11732.4 |
39.8 |
By the end of 2025, the installed power generation capacity was 3,891.34 million kilowatts, up by 16.1 percent over that at the end of 2024, among which[28]the installed thermal power generation capacity was 1,539.04 million kilowatts, up by 6.3 percent; the installed hydropower generation capacity was 448.02 million kilowatts, up by 2.9 percent; the installed nuclear power generation capacity was 62.48 million kilowatts, up by 2.7 percent; the installed wind power generation capacity was 640.01 million kilowatts, up by 22.9 percent and the installed solar power generation capacity was 1,201.73 million kilowatts, up by 35.4 percent.
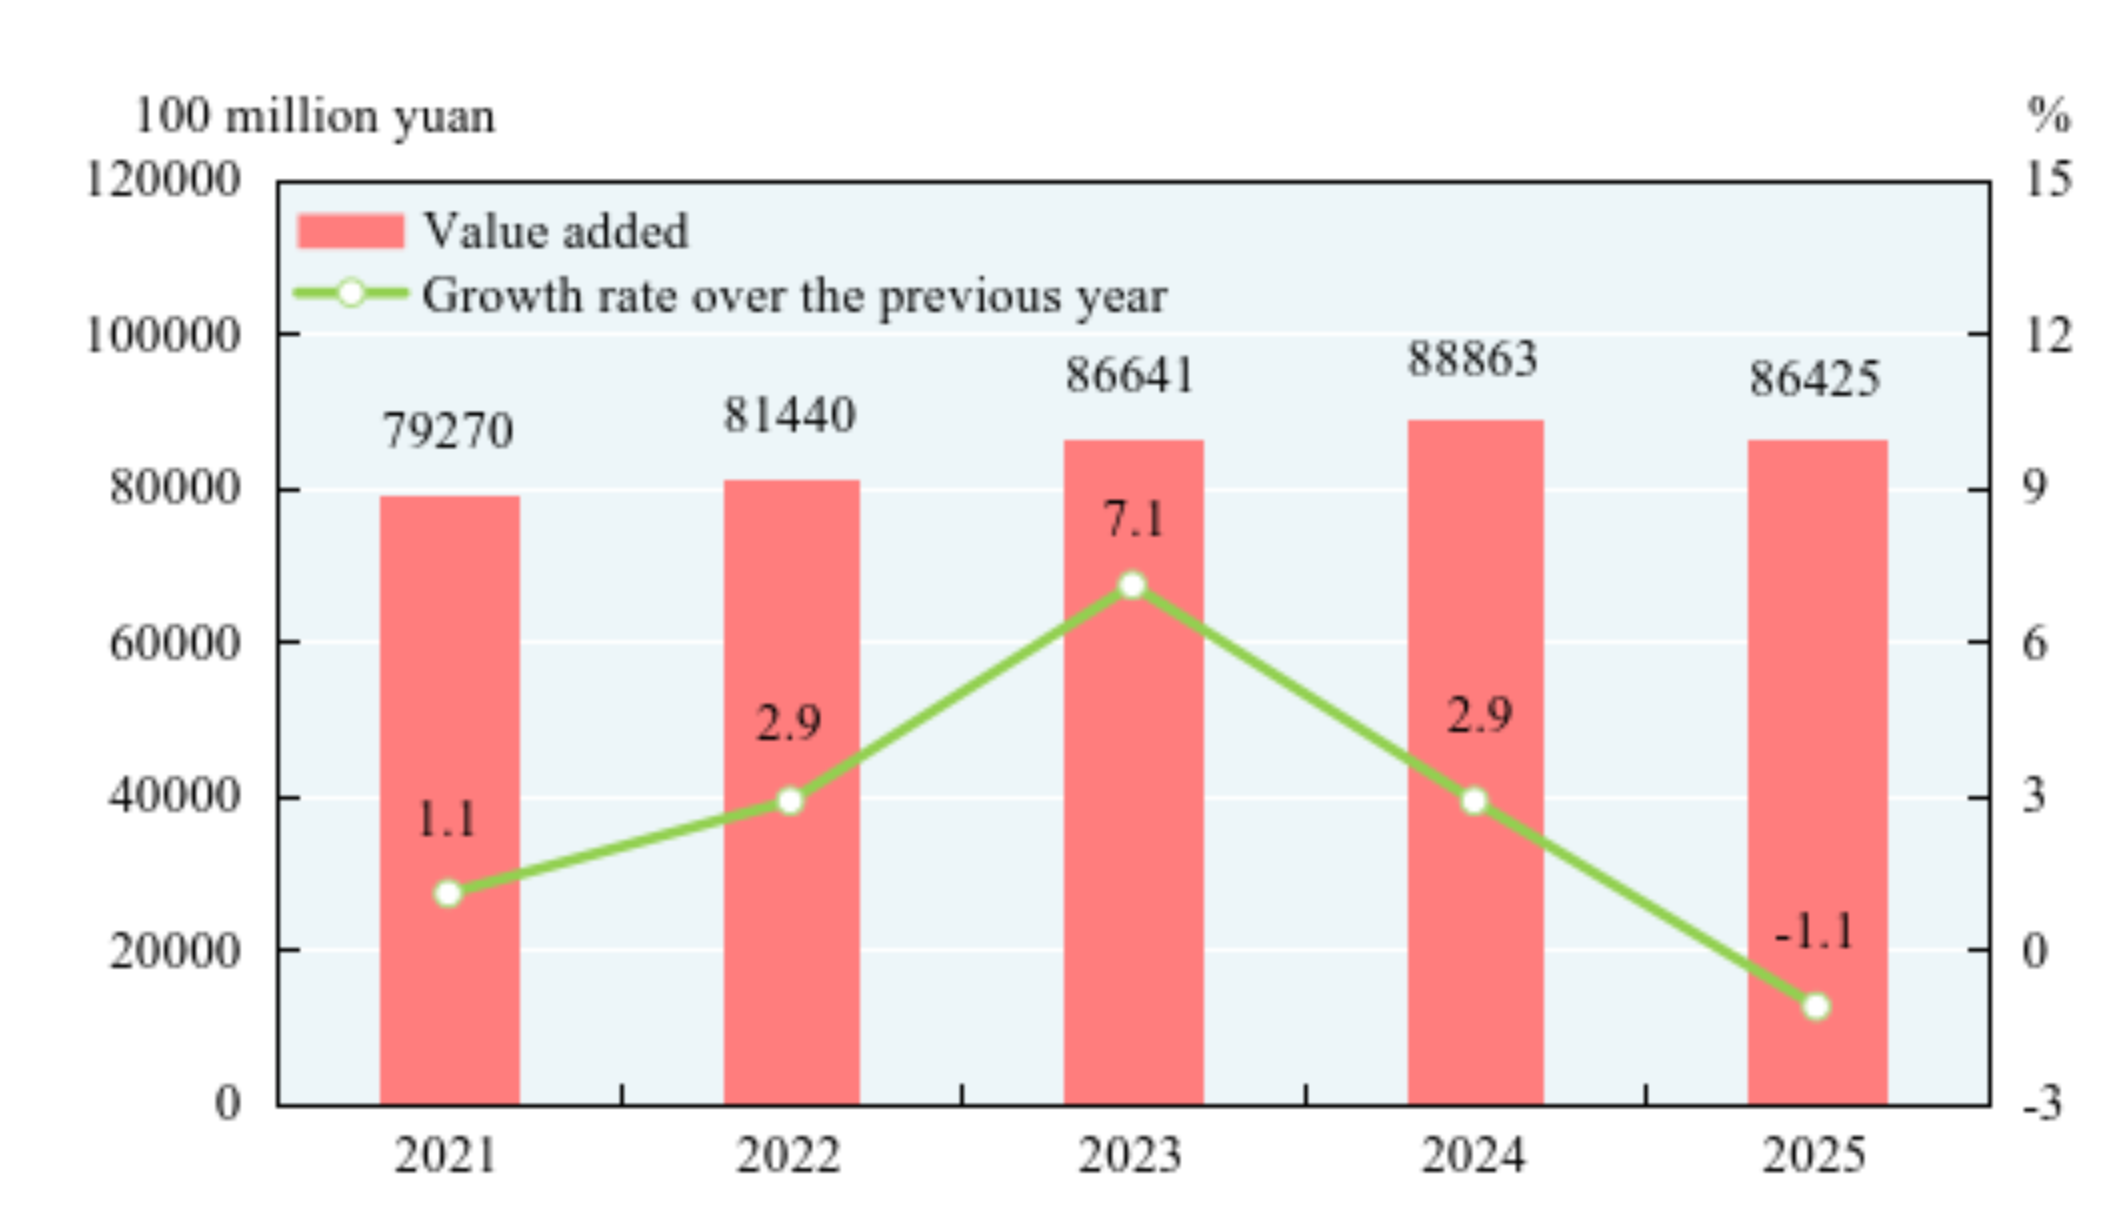
In 2025, the value added of construction enterprises was 8,642.5 billion yuan, down by 1.1 percent over the previous year. The profits made by construction enterprises[29] qualified for general contracts and specialized contracts reached 635.5 billion yuan, down by 14.1 percent over the previous year, of which the profits made by state-holding enterprises were 347.3 billion yuan, down by 8.2 percent.
Figure 11: Value Added and Growth Rates of Construction Industry 2021-2025
IV. Service Sector
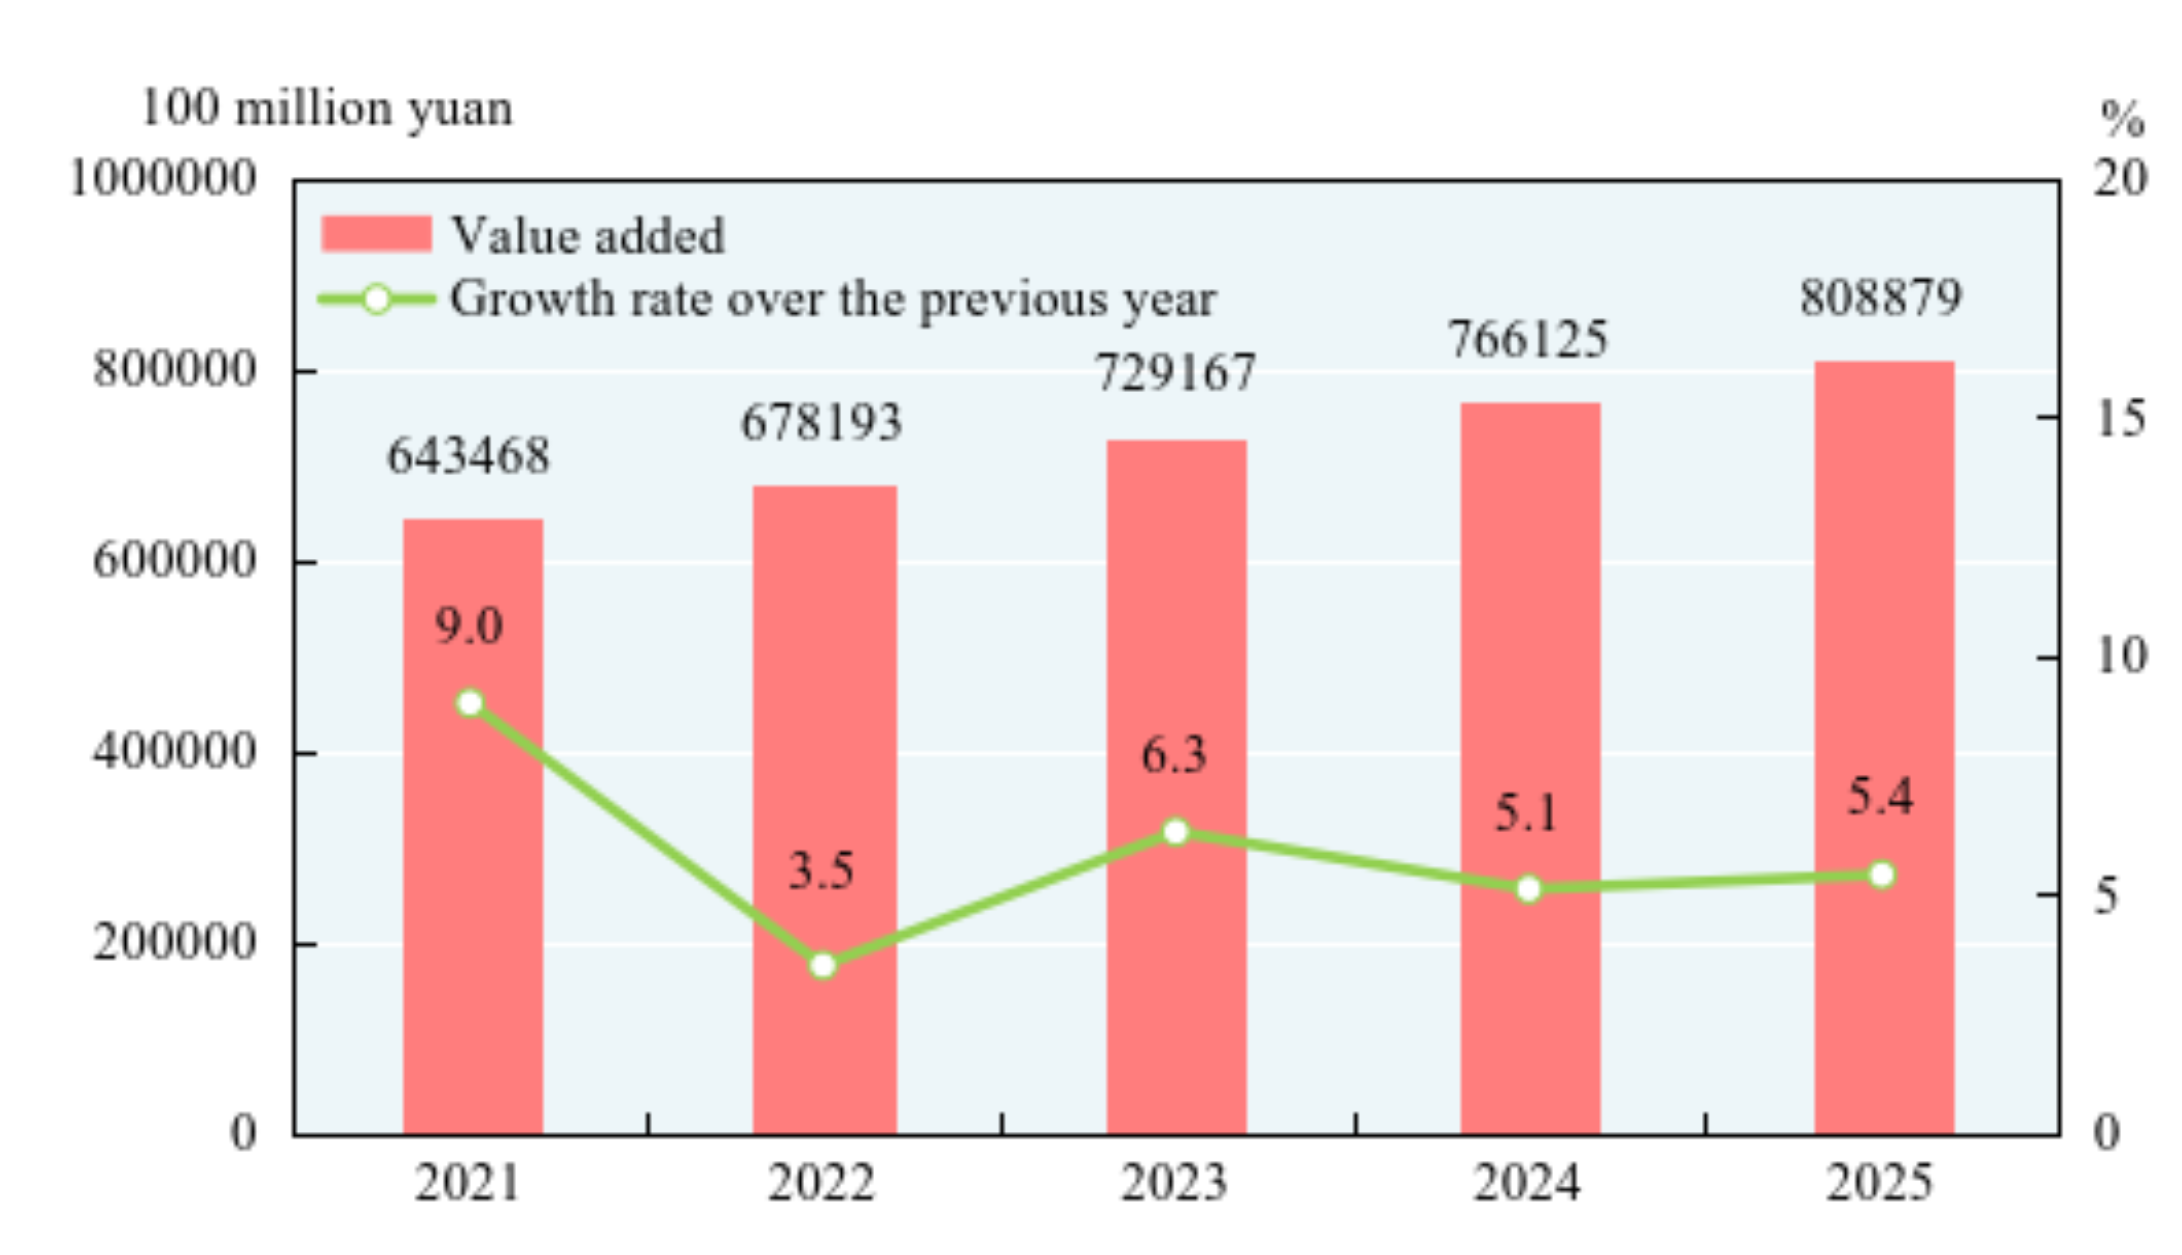
In 2025, the value added of wholesale and retail trades was 14,580.8 billion yuan, up by 5.0 percent over the previous year; that of transport, storage and post was 6,209.2 billion yuan, up by 5.2 percent; that of hotels and catering services was 2,640.3 billion yuan, up by 4.9 percent; that of finance was 10,133.7 billion yuan, up by 4.5 percent; that of real estate was 8,302.4 billion yuan, up by 0.2 percent; that of information transmission, software and information technology services was 7,059.9 billion yuan, up by 11.1 percent; and that of leasing and business services was 6,366.6 billion yuan, up by 10.3 percent. The business revenue of the enterprises above the designated size in select service sectors[30] grew by 6.8 percent over that of the previous year, and the total profits increased by 1.9 percent.
Figure 12: Value Added and Growth Rates of Service Sector 2021-2025
The total freight traffic[31]in 2025 reached 59.7 billion tons, up by 3.2 percent over the previous year. The freight flows were 27,411.6 billion ton-kilometers, up by 4.6 percent. The volume of freight handled by ports totaled 18.3 billion tons, up by 4.2 percent over the previous year, of which the freight for foreign trade was 5.7 billion tons, up by 4.7 percent. Container shipping of ports reached 354.47 million standard containers, up by 6.8 percent.
Table 5: Freight Traffic by All Means of Transportation and Growth Rates in 2025
|
Item |
Unit |
Volume |
Increase over 2024 (%) |
|
Total freight traffic |
100 million tons |
596.7 |
3.2 |
|
Railways |
100 million tons |
52.8 |
2.0 |
|
Highways |
100 million tons |
432.9 |
3.4 |
|
Waterways |
100 million tons |
101.2 |
3.2 |
|
Civil aviation |
10000 tons |
1017.2 |
13.3 |
|
Pipelines |
100 million tons |
9.7 |
1.1 |
|
Freight flows |
100 million ton-kilometers |
274115.8 |
4.6 |
|
Railways |
100 million ton-kilometers |
36869.1 |
2.8 |
|
Highways |
100 million ton-kilometers |
79510.7 |
3.5 |
|
Waterways |
100 million ton-kilometers |
149943.9 |
6.0 |
|
Civil aviation |
100 million ton-kilometers |
413.1 |
16.7 |
|
Pipelines |
100 million ton-kilometers |
7379.0 |
-1.2 |
In 2025, the total passenger traffic[32] was 17.1 billion person-times, up by 0.3 percent over 2024, and the passenger flows were 3,554.6 billion person-kilometers, up by 5.0 percent.
Table 6: Passenger Traffic by All Means of Transportation and Growth Rates in 2025
|
Item |
Unit |
Volume |
Increase over 2024 (%) |
|
Total passenger traffic |
100 million person-times |
171.2 |
0.3 |
|
Railways |
100 million person-times |
46.0 |
6.7 |
|
Highways |
100 million person-times |
114.9 |
-2.4 |
|
Waterways |
100 million person-times |
2.6 |
-0.1 |
|
Civil aviation |
100 million person-times |
7.7 |
5.5 |
|
Passenger flows |
100 million person-kilometers |
35545.6 |
5.0 |
|
Railways |
100 million person-kilometers |
16395.6 |
3.8 |
|
Highways |
100 million person-kilometers |
5100.4 |
0.0 |
|
Waterways |
100 million person-kilometers |
56.6 |
3.6 |
|
Civil aviation |
100 million person-kilometers |
13993.0 |
8.3 |
The total number of motor vehicles for civilian use reached 366.11 million (including 6.81 million tri-wheel motor vehicles and low-speed trucks) by the end of 2025, up by 13.43 million over that at the end of 2024, of which the privately-owned vehicles numbered 323.36 million, an increase of 13.48 million. The total number of cars for civilian use was 197.73 million, an increase of 4.29 million, of which the privately-owned cars numbered 186.91 million, an increase of 4.87 million.
In 2025, the volumeof postal and delivery services[33] totaled 216.5 billion, up by 11.8 percent over that of the previous year. The number of mail delivery was 0.68 billion; that of parcel delivery was 0.03 billion; and that of express delivery was 199.0 billion with a revenue reaching 1,493.9 billion yuan. The turnover of telecommunication services[34] in 2025 totaled 1,862.7 billion yuan, up by 9.1 percent over that of the previous year. By the end of 2025, there were 12.87 million mobile phone base stations[35], among which the number of 4G base stations reached 7.19 million and that of 5G base stations was 4.84 million. There were 1,826.84 million mobile phone subscribers in China, of whom 1,204.13 million were 5G mobile phone subscribers. The mobile phone coverage was 130.0 sets per 100 persons. The number of fixed broadband internet users[36] reached 690.82 million, an increase of 20.99 million over that at the end of the previous year. Of this total, users of broadband with the speed of 1000M and above[37] amounted to 238.39 million, an increase of 31.57 million. Users of mobile internet of things terminals[38] totaled 2.888 billion, an increase of 0.232 billion. The number of internet users was 1.125 billion, 1.121 billion of whom were mobile internet surfers. The coverage of internet was 80.1 percent, and 69.5 percent in rural areas. The mobile internet traffic in 2025 was 395.8 billion gigabytes, up by 17.3 percent over the previous year. Software revenue of software and information technology services industry[39] was 15,483.1 billion yuan, up by 13.2 percent over that of the previous year.
Figure 13: Express Delivery and Growth Rates 2021-2025[40]
Figure 14: Year-end Number of Fixed Broadband Internet Users 2021-2025
V. Domestic Trade
In 2025, the total retail sales of consumer goods reached 50,120.2 billion yuan, up by 3.7 percent over the previous year. An analysis on different areas showed that the retail sales of consumer goods in urban areas stood at 43,297.2 billion yuan, up by 3.6 percent, and that in rural areas reached 6,823.0 billion yuan, up by 4.1 percent. Grouped by consumption patterns, the retail sales of goods were 44,322.0 billion yuan, up by 3.8 percent, and the income of catering industry was 5,798.2 billion yuan, up by 3.2 percent. The retail sales of services[41] increased by 5.5 percent over the previous year.
Figure 15: Total Retail Sales of Consumer Goods and Growth Rates 2021-2025
Of the total retail sales of goods by enterprises above the designated size, the retail sales for grain, oil and food went up by 9.3 percent over the previous year; beverages up by 1.0 percent; tobacco and liquor up by 2.7 percent; clothes, shoes, hats and textiles up by 3.2 percent; cosmetics up by 5.1 percent; gold, silver and jewelry up by 12.8 percent; daily necessities up by 6.3 percent; sports and recreational articles up by 15.7 percent; household appliances and audio-video equipment up by 11.0 percent; traditional Chinese and western medicines up by 1.8 percent; cultural and office appliances up by 17.3 percent; furniture up by 14.6 percent; communication equipment up by 20.9 percent; petroleum and petroleum products down by 5.7 percent; motor vehicles down by 1.5 percent; and building and decoration materials down by 2.7 percent. Grouped by retail forms, among all the retail enterprises above the designated size, the retail sales of convenience stores increased by 5.5 percent over the previous year, specialty stores grew by 2.6 percent, supermarkets increased by 4.3 percent, department stores up by 0.1 percent, and brand stores down by 0.6 percent.
In 2025, the online retail sales of physical goods[42] were 13,092.3 billion yuan, up by 5.2 percent over the previous year, accounting for 26.1 percent of the total retail sales of consumer goods.
VI. Investment in Fixed Assets
The total investment in fixed assets of the country in 2025 was 49,110.9 billion yuan, down by 3.9 percent over the previous year[43]. The investment in fixed assets (excluding rural households) was 48,518.6 billion yuan, down by 3.8 percent. Of the investment in fixed assets (excluding rural households), by region[44], the investment in eastern region was down by 8.4 percent, central region down by 2.7 percent, western region down by 1.3 percent, and northeastern region down by 15.5 percent.
Of the investment in fixed assets (excluding rural households), the investment in the primary industry was 957.0 billion yuan, up by 2.3 percent over the previous year; that in the secondary industry was 17,736.8 billion yuan, up by 2.5 percent; and that in the tertiary industry was 29,824.8 billion yuan, down by 7.4 percent. The investment in infrastructure[45] decreased by 2.2 percent. The investment in social sector[46] decreased by 8.5 percent. The private investment[47] went down by 6.4 percent; the private project investment decreased by 1.9 percent with the investment in real estate development deducted. By sector, the private investment in manufacturing was down by 0.2 percent and in infrastructure up by 1.7 percent.
Figure 16: Shares of Investment in Fixed Assets (Excluding Rural Households)
of the Three Industries in 2025
Table 7: Growth Rates of Investment in Fixed Assets (Excluding Rural Households) by Sector in 2025
|
Sector |
Increase over 2024 (%) |
Sector |
Increase over 2024 (%) |
|
Total |
-3.8 |
Finance |
7.2 |
|
Agriculture, Forestry, Animal Husbandry and Fishery |
-0.8 |
Real Estate[48] |
-17.5 |
|
Mining |
2.5 |
Leasing and Business Services |
-4.3 |
|
Manufacturing |
0.6 |
Scientific Research and Technical Services |
-15.1 |
|
Production and Supply of Electricity, Heat Power, Gas and Water |
9.1 |
Management of Water Conservancy, Environment and Public Facilities |
-8.4 |
|
Construction |
-22.2 |
Household Services, Repair and Other Services |
0.9 |
|
Wholesale and Retail Trades |
5.6 |
Education |
-8.3 |
|
Transport, Storage and Post |
-1.2 |
Health and Social Services |
-12.3 |
|
Hotels and Catering Services |
5.5 |
Culture, Sports and Entertainment |
-3.8 |
|
Information Transmission, Software and Information Technology Services |
8.8 |
Public Management, Social Security and Social Organizations |
5.7 |
Table 8: Newly Increased Production and Operation Capacity through Fixed Assets Investment in 2025
|
Item |
Unit |
Volume |
|
Newly increased alternating current transformer equipment with a capacity of over 220 kilovolts |
10,000 kilovolt-amperes |
32043 |
|
New railways put into operation |
kilometer |
3109 |
|
Of which: high-speed railways |
kilometer |
2862 |
|
Extended or new double-track railways put into operation |
kilometer |
2941 |
|
Electrified railways put into operation |
kilometer |
3091 |
|
Length of new and rebuilt highways |
kilometer |
8699 |
|
New throughput capacity of berths for over 10,000-tonnage ships |
10,000 tons/year |
38833 |
|
New civil transportation airports |
- |
7 |
|
New lines of optical-fiber cables |
10,000 km |
211 |
In 2025, the investment in real estate development was 8,278.8 billion yuan, down by 17.2 percent over the previous year[49]. Of this total, the investment in residential buildings reached 6,351.4 billion yuan, a decrease of 16.3 percent, that in office buildings was 320.3 billion yuan, down by 22.8 percent, and that in buildings for commercial business was 594.7 billion yuan, down by 14.0 percent. In 2025, the floor space of newly-built commercial buildings sold[50] was 881.01 million square meters. The floor space of second-hand housing online transactions[51] reached 736.85 million square meters. The floor space of newly-built commercial buildings for sale was 766.32 million square meters at the end of 2025, among which the floor space of the commercial residential buildings for sale was 402.36 million square meters.
Table 9: Main Indicators for Real Estate Development and Sales and Growth Rates in 2025
|
Item |
Unit |
Volume |
Increase over 2024 (%) |
|
Investment in real estate development |
100 million RMB |
82788 |
-17.2 |
|
Of which: residential buildings |
100 million RMB |
63514 |
-16.3 |
|
Floor space of buildings under construction |
10000 square meters |
659890 |
-10.0 |
|
Of which: residential buildings |
10000 square meters |
460123 |
-10.3 |
|
Floor space of buildings newly started |
10000 square meters |
58770 |
-20.4 |
|
Of which: residential buildings |
10000 square meters |
42984 |
-19.8 |
|
Floor space of buildings completed |
10000 square meters |
60348 |
-18.1 |
|
Of which: residential buildings |
10000 square meters |
42830 |
-20.2 |
|
Floor space of newly-built commercial buildings sold |
10000 square meters |
88101 |
-8.7 |
|
Of which: residential buildings |
10000 square meters |
73299 |
-9.2 |
|
Funds for investment this year of real estate development enterprises |
100 million RMB |
93117 |
-13.4 |
|
Of which: domestic loans |
100 million RMB |
14094 |
-7.3 |
|
individual mortgage |
100 million RMB |
12852 |
-17.8 |
In 2025, 1.21 million units of government-subsidized housing for sale, government-subsidized rental housing and public rental housing were started to be built or made available; 170 thousand units of dilapidated housing in urban areas were started to be renovated; 27 thousand old urban residential compounds were newly started to be renovated, benefiting 4.99 million households; renovation on dilapidated housing and for earthquake resistance of housing in rural areas were started for 219 thousand households, targeting key groups such as low-income rural population.
VII. Foreign Economic Relations
The total value of imports and exports of goods in 2025 reached 45,468.5 billion yuan, up by 3.8 percent over that of the previous year. Of this total, the value of goods exported was 26,989.0 billion yuan, up by 6.1 percent; the value of goods imported was 18,479.5 billion yuan, up by 0.5 percent. The surplus of trade in goods reached 8,509.4 billion yuan. The total value of imports and exports between China and countries along the Belt and Road was 23,601.8 billion yuan, an increase of 6.3 percent over that of the previous year, accounting for 51.9 percent of the total value of imports and exports. Of this total, the value of exports was 13,685.1 billion yuan, up by 11.2 percent; the value of imports was 9,916.7 billion yuan, up by 0.1 percent. The total value of imports and exports between China and other Regional Comprehensive Economic Partnership (RCEP) member countries[52] was 13,850.3 billion yuan, up by 5.3 percent over that of the previous year. The total value of imports and exports by private enterprises was 26,040.3 billion yuan, up by 7.1 percent over that of the previous year, accounting for 57.3 percent of the total value of imports and exports. Of this total, the value of exports was 17,659.2 billion yuan, up by 7.2 percent.
Figure 17: Total Value of Imports and Exports of Goods 2021-2025
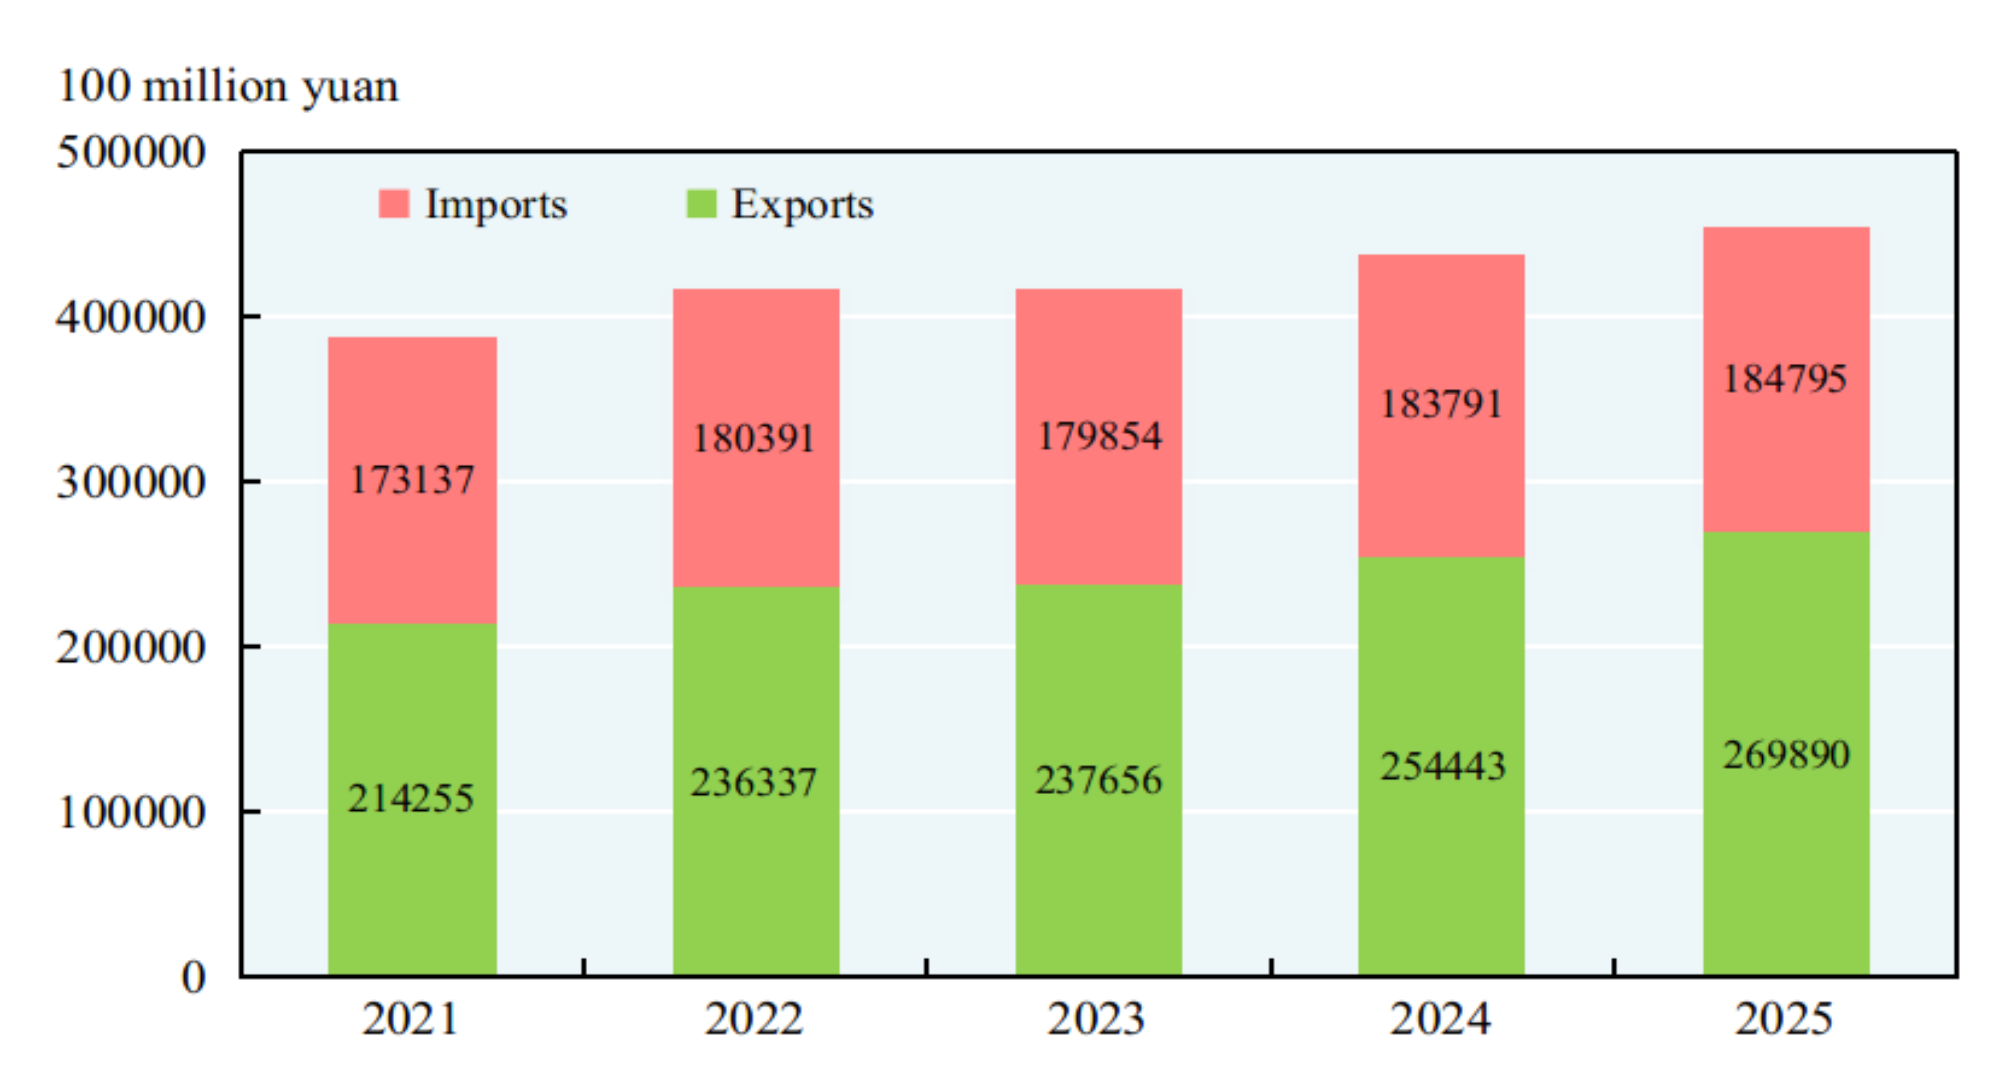
Table 10: Total Value and Growth Rates of Imports and Exports of Goods in 2025
|
Item |
Value (100 million yuan) |
Increase over 2024 (%) |
|
Total value of imports and exports of goods |
454685 |
3.8 |
|
Exports |
269890 |
6.1 |
|
Of which: General trade |
176411 |
6.0 |
|
Processing trade |
52633 |
4.9 |
|
Of which: Mechanical and electronic products |
164683 |
8.9 |
|
High & new technology products |
67806 |
8.0 |
|
Imports |
184795 |
0.5 |
|
Of which: General trade |
110650 |
-3.7 |
|
Processing trade |
32527 |
12.7 |
|
Of which: Mechanical and electronic products |
74069 |
5.7 |
|
High & new technology products |
58844 |
9.9 |
|
Trade surplus in goods |
85094 |
20.4 |
Table 11: Volume and Value of Main Export Commodities and the Growth Rates in 2025
|
Item |
Unit |
Volume |
Increase over 2024 (%) |
Value (100 million yuan) |
Increase over 2024 (%) |
|
Rolled steel |
10000 tons |
11902 |
7.5 |
5911 |
-0.7 |
|
Textile yarns and textile articles |
— |
— |
— |
10205 |
1.0 |
|
Clothes and clothing accessories |
— |
— |
— |
10822 |
-4.4 |
|
Footwear |
100 million pairs |
90 |
-2.0 |
2975 |
-10.8 |
|
Furniture and parts |
— |
— |
— |
4559 |
-5.6 |
|
Luggage and similar containers |
10000 tons |
368 |
1.6 |
2140 |
-12.9 |
|
Toys |
— |
— |
— |
2493 |
-12.1 |
|
Plastic articles |
— |
— |
— |
7487 |
-0.8 |
|
Integrated circuits |
100 million pieces |
3495 |
17.4 |
14442 |
27.4 |
|
Automatic data processing machines and components |
— |
— |
— |
14530 |
-0.8 |
|
Mobile phones |
10000 sets |
75118 |
-7.7 |
8696 |
-9.0 |
|
Containers |
10000 units |
458 |
-15.9 |
972 |
-19.9 |
|
Liquid crystal display modules |
10000 units |
209492 |
10.7 |
2306 |
11.7 |
|
Motor vehicles (including chassis) |
10000 sets |
832 |
30.0 |
10183 |
22.0 |
Table 12: Volume and Value of Main Import Commodities and the Growth Rates in 2025
|
Item |
Unit |
Volume |
Increase over 2024 (%) |
Value (100 million yuan) |
Increase over 2024 (%) |
|
Soybean |
10000 tons |
11183 |
6.5 |
3602 |
-3.9 |
|
Edible vegetable oil |
10000 tons |
694 |
-3.2 |
616 |
16.6 |
|
Iron ore and concentrate |
10000 tons |
125871 |
1.8 |
8804 |
-6.6 |
|
Coal and lignite |
10000 tons |
49027 |
-9.6 |
2586 |
-30.2 |
|
Crude oil |
10000 tons |
57773 |
4.4 |
21217 |
-8.3 |
|
Petroleum products refined |
10000 tons |
4242 |
-12.0 |
1718 |
-17.7 |
|
Natural gas |
10000 tons |
12787 |
-2.8 |
4060 |
-12.5 |
|
Plastics in primary forms |
10000 tons |
2684 |
-7.4 |
2843 |
-8.8 |
|
Paper pulp |
10000 tons |
3604 |
4.9 |
1566 |
-1.7 |
|
Rolled steel |
10000 tons |
606 |
-11.1 |
735 |
-10.2 |
|
Unwrought copper and its alloys |
10000 tons |
532 |
-6.4 |
3869 |
0.7 |
|
Integrated circuits |
100 million pieces |
5917 |
7.8 |
30355 |
10.7 |
|
Motor vehicles (including chassis) |
10000 sets |
48 |
-32.4 |
1693 |
-39.2 |
Table 13: Imports and Exports of Goods with Major Countries and Regions, Growth Rates and Proportions in 2025
|
Country or region |
Exports (100 million yuan) |
Increase over 2024 (%) |
Proportion of the total (%) |
Imports (100 million yuan) |
Increase over 2024 (%) |
Proportion of the total (%) |
|
ASEAN |
47596 |
14.0 |
17.6 |
27861 |
-1.0 |
15.1 |
|
European Union |
40071 |
9.0 |
14.8 |
19182 |
0.1 |
10.4 |
|
United States |
30067 |
-19.5 |
11.1 |
10000 |
-14.1 |
5.4 |
|
Hong Kong, China |
24001 |
16.1 |
8.9 |
2266 |
73.4 |
1.2 |
|
Republic of Korea |
10319 |
-0.6 |
3.8 |
13379 |
3.6 |
7.2 |
|
Japan |
11261 |
4.1 |
4.2 |
11792 |
6.1 |
6.4 |
|
Taiwan, China |
5982 |
11.8 |
2.2 |
16509 |
6.5 |
8.9 |
|
Russia |
7384 |
-9.9 |
2.7 |
8924 |
-3.4 |
4.8 |
|
Brazil |
5123 |
-0.1 |
1.9 |
8328 |
0.8 |
4.5 |
|
India |
9723 |
13.4 |
3.6 |
1412 |
10.3 |
0.8 |
|
South Africa |
1645 |
6.0 |
0.6 |
2188 |
0.5 |
1.2 |
The total value of imports and exports of services in 2025 was 8,082.3 billion yuan, up by 7.4 percent over that of the previous year. Of the total, the export value of services was 3,626.8 billion yuan, up by 14.2 percent. The import value of services was 4,455.5 billion yuan, up by 2.5 percent. The trade deficit in imports and exports of services was 828.7 billion yuan.
The year 2025 witnessed the new establishment of 70,392 foreign-funded enterprises, up by 19.1 percent over that of the previous year, and the foreign investment actually utilized totaled 747.7 billion yuan, down by 9.5 percent. Specifically, a total of 19,756 enterprises were newly established with investment from countries along the Belt and Road (including investment in China via free ports), up by 14.7 percent; and the direct foreign investment in China reached 116.8 billion yuan, up by 1.9 percent. The foreign investment actually utilized by high technology industry reached 241.8 billion yuan, down by 15.6 percent.
Table 14: Total Value of Foreign Direct Investment and the Growth Rates in 2025
|
Sector |
Enterprises
(units) |
Increase over 2024 (%) |
Actually Utilized Value (100 million yuan) |
Increase over 2024(%) | |
|
Total |
|
70392 |
19.1 |
7477 |
-9.5 |
|
Of which: |
Agriculture, Forestry, Animal Husbandry and Fishery |
366 |
-2.1 |
15 |
-44.5 |
|
|
Manufacturing |
4244 |
9.6 |
1855 |
-16.1 |
|
|
Production and Supply of Electricity, Heat Power, Gas and Water |
313 |
-28.7 |
243 |
-14.5 |
|
|
Transport, Storage and Post |
1054 |
25.8 |
88 |
-21.1 |
|
|
Information Transmission, Software and Information Technology Services |
5567 |
39.6 |
440 |
-16.3 |
|
|
Wholesale and Retail |
25053 |
20.1 |
514 |
-11.9 |
|
|
Real Estate |
624 |
2.0 |
218 |
-46.2 |
|
|
Leasing and Business Services |
12757 |
14.3 |
1896 |
4.5 |
|
|
Household Services, Repair and Other Services |
1104 |
28.5 |
20 |
-43.3 |
In 2025, the non-financial outbound direct investment reached 1,040.4 billion yuan, up by 1.6 percent over that of the previous year. Of this total, the investment to countries along the Belt and Road reached 283.4 billion yuan, up by 18.0 percent.
Table 15: Total Value and Growth Rates of Non-financial Outbound Direct Investment in 2025
|
Sector |
Value (100 million yuan) |
Increase over 2024 (%) | |
|
Total |
10404 |
1.6 | |
|
Of which: |
Agriculture, Forestry, Animal Husbandry and Fishery |
151 |
54.1 |
|
|
Mining |
801 |
-10.3 |
|
|
Manufacturing |
2011 |
-4.6 |
|
|
Production and Supply of Electricity, Heat Power, Gas and Water |
143 |
-69.0 |
|
|
Construction |
299 |
4.2 |
|
|
Wholesale and Retail |
2555 |
27.3 |
|
|
Transport, Storage and Post |
709 |
34.8 |
|
|
Information Transmission, Software and Information Technology Services |
369 |
-11.1 |
|
|
Real Estate |
89 |
-27.5 |
|
|
Leasing and Business Services |
2719 |
-5.6 |
In 2025, the accomplished business revenue through contracted overseas engineering projects was 1,277.3 billion yuan, up by 8.1 percent over that of the previous year. Specifically, the accomplished business revenue from countries along the Belt and Road was 1,090.2 billion yuan, up by 9.6 percent, accounting for 85.4 percent of the accomplished business revenue through contracted overseas engineering projects. The number of labor forces sent abroad through overseas labor contracts was 0.43 million.
The national general public budget revenue reached 21,604.5 billion yuan in 2025, down by 1.7 percent over that of the previous year, of which the tax revenue amounted to 17,636.3 billion yuan, up by 0.8 percent. The national general public budget expenditure reached 28,739.5 billion yuan, up by 1.0 percent over that of the previous year. The current main policies supporting sci-tech innovation and the development of manufacturing saw the tax cuts, fee reductions and tax refunds totaling 2,855.7 billion yuan in 2025.
Figure 18: National General Public Budget Revenue 2021-2025
Note: Data for the general public budget revenue from 2021 to 2024 as shown in the figure were final accounts and that of 2025 was the executive accounts.
By the end of 2025, money supply of broad sense (M2) was 340.3 trillion yuan, an increase of 8.5 percent over that by the end of the previous year. Money supply of narrow sense (M1)[53] was 115.5 trillion yuan, up by 3.8 percent. Currency in circulation (M0) was 14.1 trillion yuan, up by 10.2 percent.
In 2025, the aggregate financing to the real economy (AFRE) (flow)[54] reached 35.6 trillion yuan, or 3.3 trillion yuan more than that in 2024 on a comparable basis. The AFRE (stock)[55] totaled 442.1 trillion yuan at the end of 2025, up by 8.3 percent over that at the end of 2024 on a comparable basis. Specifically, the outstanding RMB loans to the real economy stood at 268.4 trillion yuan, up by 6.3 percent. The outstanding amount of RMB and foreign currencies deposits in all financial institutions totaled 336.1 trillion yuan at the end of 2025, an increase of 27.8 trillion yuan compared with that at the beginning of the year. Of this total, the outstanding amount of RMB deposits stood at 328.6 trillion yuan, an increase of 26.4 trillion yuan. The outstanding RMB and foreign currencies loans in all financial institutions reached 275.7 trillion yuan, an increase of 16.2 trillion yuan. Of this total, the outstanding RMB loans were 271.9 trillion yuan, an increase of 16.3 trillion yuan. The outstanding inclusive loans to small and micro businesses in RMB[56] reached 36.6 trillion yuan, an increase of 3.6 trillion yuan. The outstanding loans for agriculture-related purposes in RMB and foreign currencies were 53.6 trillion yuan, an increase of 3.4 trillion yuan. The outstanding medium to long-term loans to the manufacturing sector reached 14.9 trillion yuan, an increase of 1.0 trillion yuan. The outstanding green loans were 44.8 trillion yuan, an increase of 7.7 trillion yuan. In 2025, the weighted average interest rate on newly issued corporate loans[57] stood at 3.22 percent, down 41 basis points from a year earlier.
Table 16: Outstanding Amount of Deposits and Loans in RMB and Foreign Currencies in All Financial Institutions and the Growth Rates at the End of 2025
|
Item |
Year-end figure (100 million yuan) |
Increase over the end of 2024 (%) |
|
Savings deposit |
3361383 |
9.0 |
|
Domestic households |
1670357 |
9.7 |
|
Deposits in RMB |
1658935 |
9.7 |
|
Domestic non-financial enterprises |
844668 |
3.7 |
|
Loans |
2757435 |
6.2 |
|
Domestic short-term loans |
691635 |
5.8 |
|
Domestic medium- and long-term loans |
1812965 |
5.8 |
The outstanding RMB loans from rural financial institutions (rural credit cooperatives, rural cooperation banks and rural commercial banks) totaled 33.1 trillion yuan by the end of 2025, an increase of 1.6 trillion yuan compared with that at the beginning of the year. The outstanding consumption loans in RMB from all financial institutions totaled 58.2 trillion yuan, a decrease of 0.5 trillion yuan. Of the total, the outstanding household short-term consumption loans totaled 9.5 trillion yuan, a decrease of 0.7 trillion yuan, and the outstanding household medium and long-term consumption loans reached 48.7 trillion yuan, an increase of 0.2 trillion yuan.
Funds raised through A-shares issued on Shanghai and Shenzhen Stock Exchanges[58] amounted to 1,258.3 billion yuan in 2025, an increase of 833.2 billion yuan over that of the previous year. A total of 90 new A-shares issued on Shanghai and Shenzhen Stock Exchanges raised 124.2 billion yuan worth of capital altogether, up by 62.0 billion yuan over that of the previous year. Of the total, 19 shares issued on the Science and Technology Innovation Board raised 38.1 billion yuan; refinancing of A-shares on Shanghai and Shenzhen Stock Exchanges (including public offerings, private placements, right issues, preferred shares and conversions of convertible bonds) raised 1,134.1 billion yuan, an increase of 771.2 billion yuan. Beijing Stock Exchanges[59] publicly issued 26 shares, raising 7.6 billion yuan with 0.4 billion yuan in refinancing. Market entities raised 16.3 trillion yuan through issuing bonds (including corporate bonds, enterprise bonds, asset-backed securities, national and local government bonds) on Shanghai, Shenzhen and Beijing Stock Exchanges. A total of 20 Real Estate Investment Trust Funds (REITs) in infrastructure sector were listed on Shanghai and Shenzhen Stock Exchanges, raising 40.2 billion yuan. There were 5,960 companies listed on National Equities Exchange and Quotations and 7.4 billion yuan raised by listed companies[60] at the end of 2025.
In 2025, the issuance of corporate credit bonds[61] reached 15.6 trillion yuan, an increase of 0.9 trillion yuan over that of the previous year.
The premium of primary insurance received by the insurance companies[62] totaled 6,119.4 billion yuan in 2025, up by 7.4 percent over that of the previous year on a comparable basis. Of this total, life insurance premium of primary insurance amounted to 3,555.7 billion yuan, health and casualty insurance premium of primary insurance 1,093.5 billion yuan, and property insurance premium of primary insurance 1,470.3 billion yuan. An indemnity worth of 2,443.2 billion yuan was paid, of which, life insurance indemnity was 1,001.6 billion yuan, health and casualty insurance indemnity 445.4 billion yuan, and property insurance indemnity 996.2 billion yuan.
IX. Household Income and Consumption and Social Security
In 2025, the per capita disposable income nationwide was 43,377 yuan, an increase of 5.0 percent over that of the previous year or a real increase of 5.0 percent after deducting price factors. The median[63] of per capita disposable income nationwide was 36,231 yuan, up by 4.4 percent. In terms of permanent residence, the per capita disposable income of urban households was 56,502 yuan, up by 4.3 percent over that of 2024, or a real growth of 4.2 percent after deducting price factors. The median of per capita disposable income of urban households was 51,115 yuan, up by 3.7 percent. The per capita disposable income of rural households was 24,456 yuan, up by 5.8 percent over that of the previous year, or 6.0 percent in real terms after deducting price factors. The median of per capita disposable income of rural households was 20,711 yuan, up by 5.6 percent. The urban-rural per capita disposable income ratio was 2.31, narrowed by 0.03 over that of the previous year. Grouped by income quintile[64], the per capita disposable income of low-income group reached 10,150 yuan, the lower-middle-income group 22,702 yuan, the middle-income group 35,536 yuan, the upper-middle-income group 55,586 yuan and the high-income group 103,778 yuan. The per capita monthly income of migrant workers was 5,075 yuan, increased by 2.3 percent over that of the previous year. In 2025, the per capita disposable income of rural households from counties lifted out of poverty[65] was 18,627 yuan, up by 6.3 percent over that of 2024, or a real growth of 6.5 percent after deducting price factors.
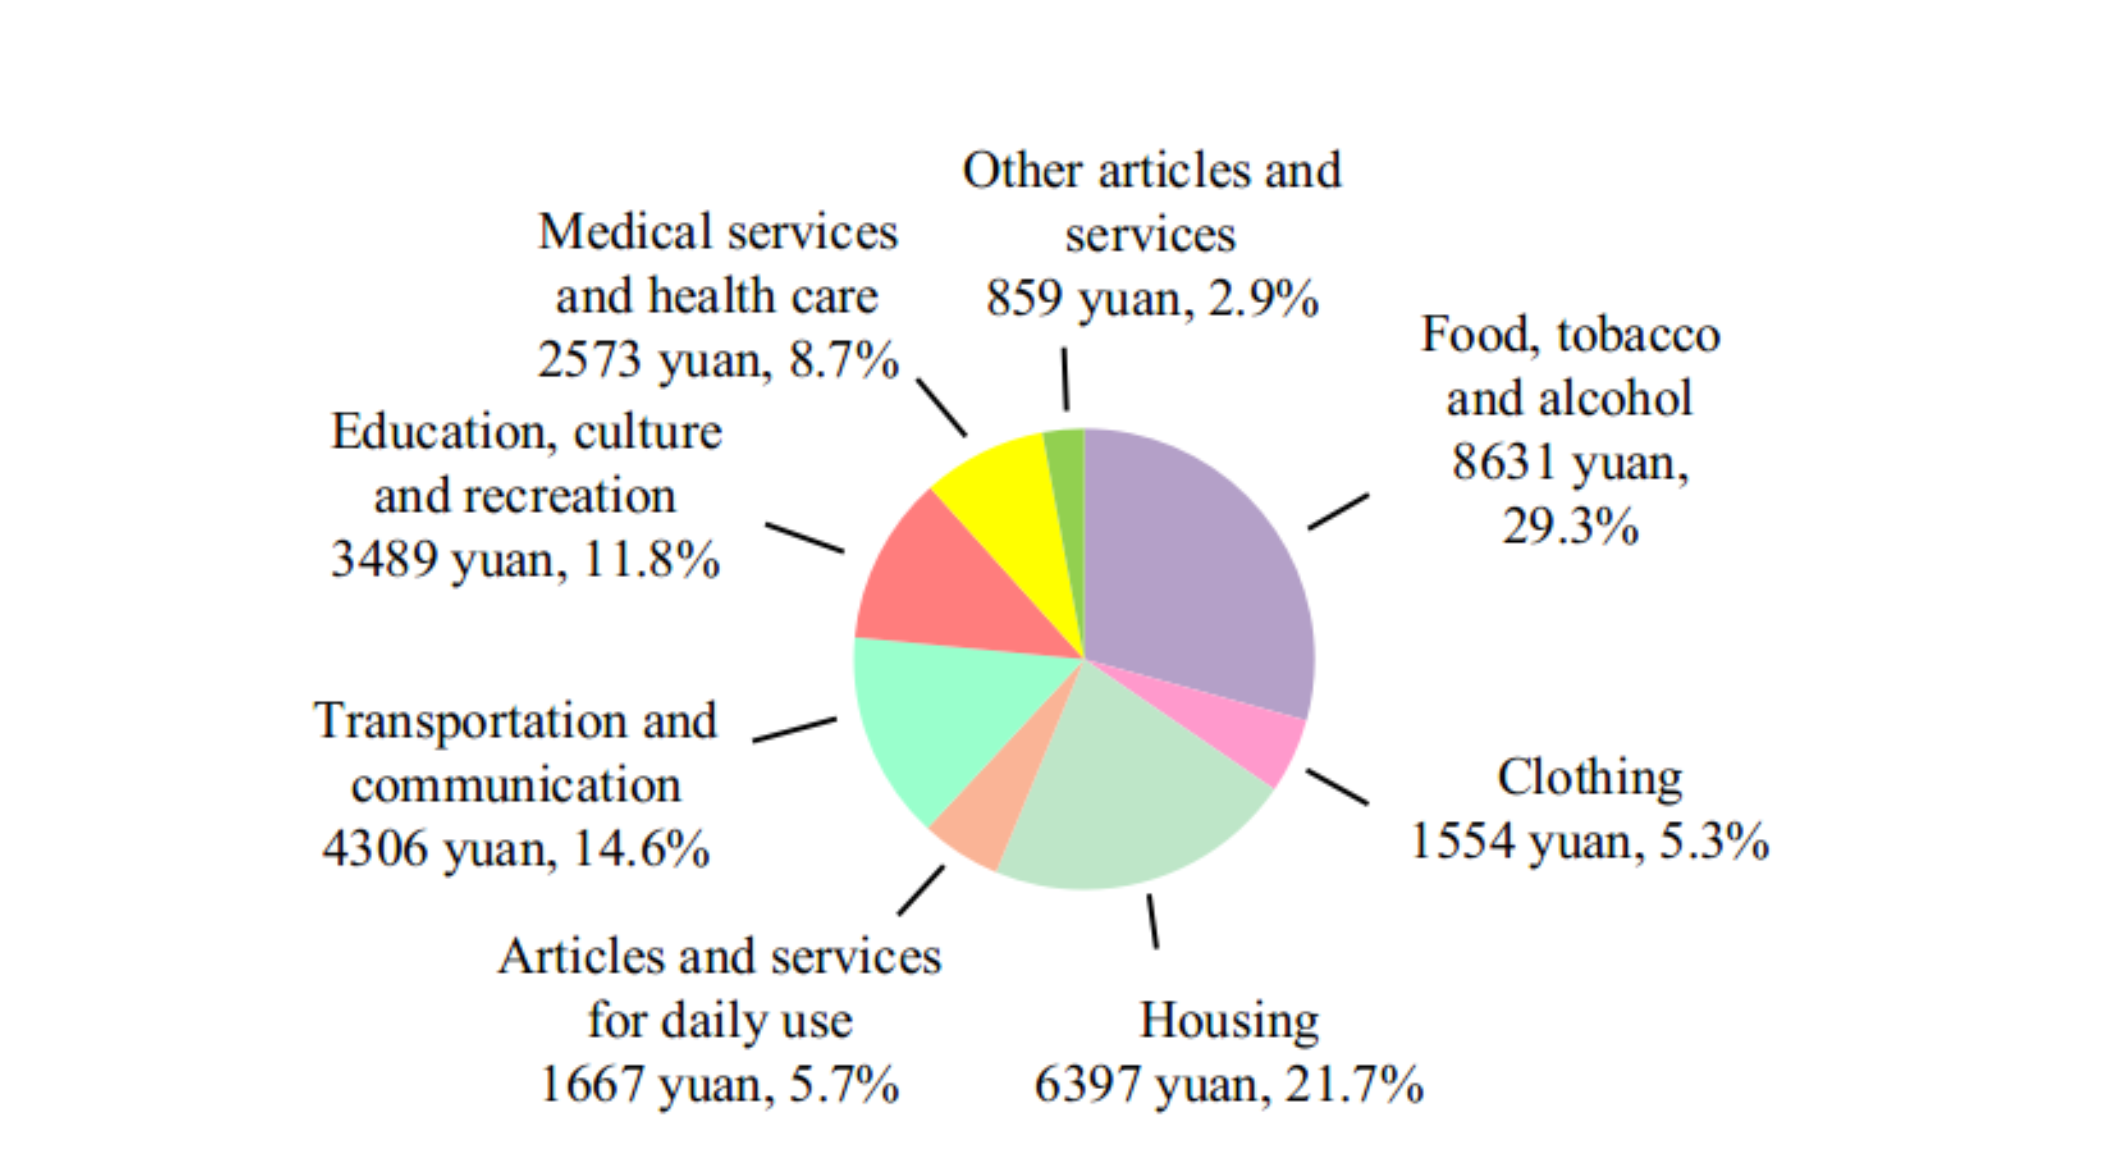
The national per capita consumption expenditure was 29,476 yuan, up by 4.4 percent over that of the previous year, or a real increase of 4.4 percent after deducting price factors. Specifically, the per capita consumption expenditure on services[66] totaled 13,602 yuan, up by 4.5 percent over that of the previous year, accounting for 46.1 percent of the per capita consumption expenditure. In terms of permanent residence, the per capita consumption expenditure of urban households was 35,869 yuan, up by 3.8 percent, or up by 3.7 percent in real terms after deducting price factors. The per capita consumption expenditure of rural households was 20,259 yuan, up by 5.1 percent, or a real increase of 5.3 percent after deducting price factors. The national Engel’s Coefficient stood at 29.3 percent, with that of urban and rural households standing at 28.3 percent and 31.8 percent respectively.
Figure 19: National Per Capita Disposable Income and the Growth Rates 2021-2025
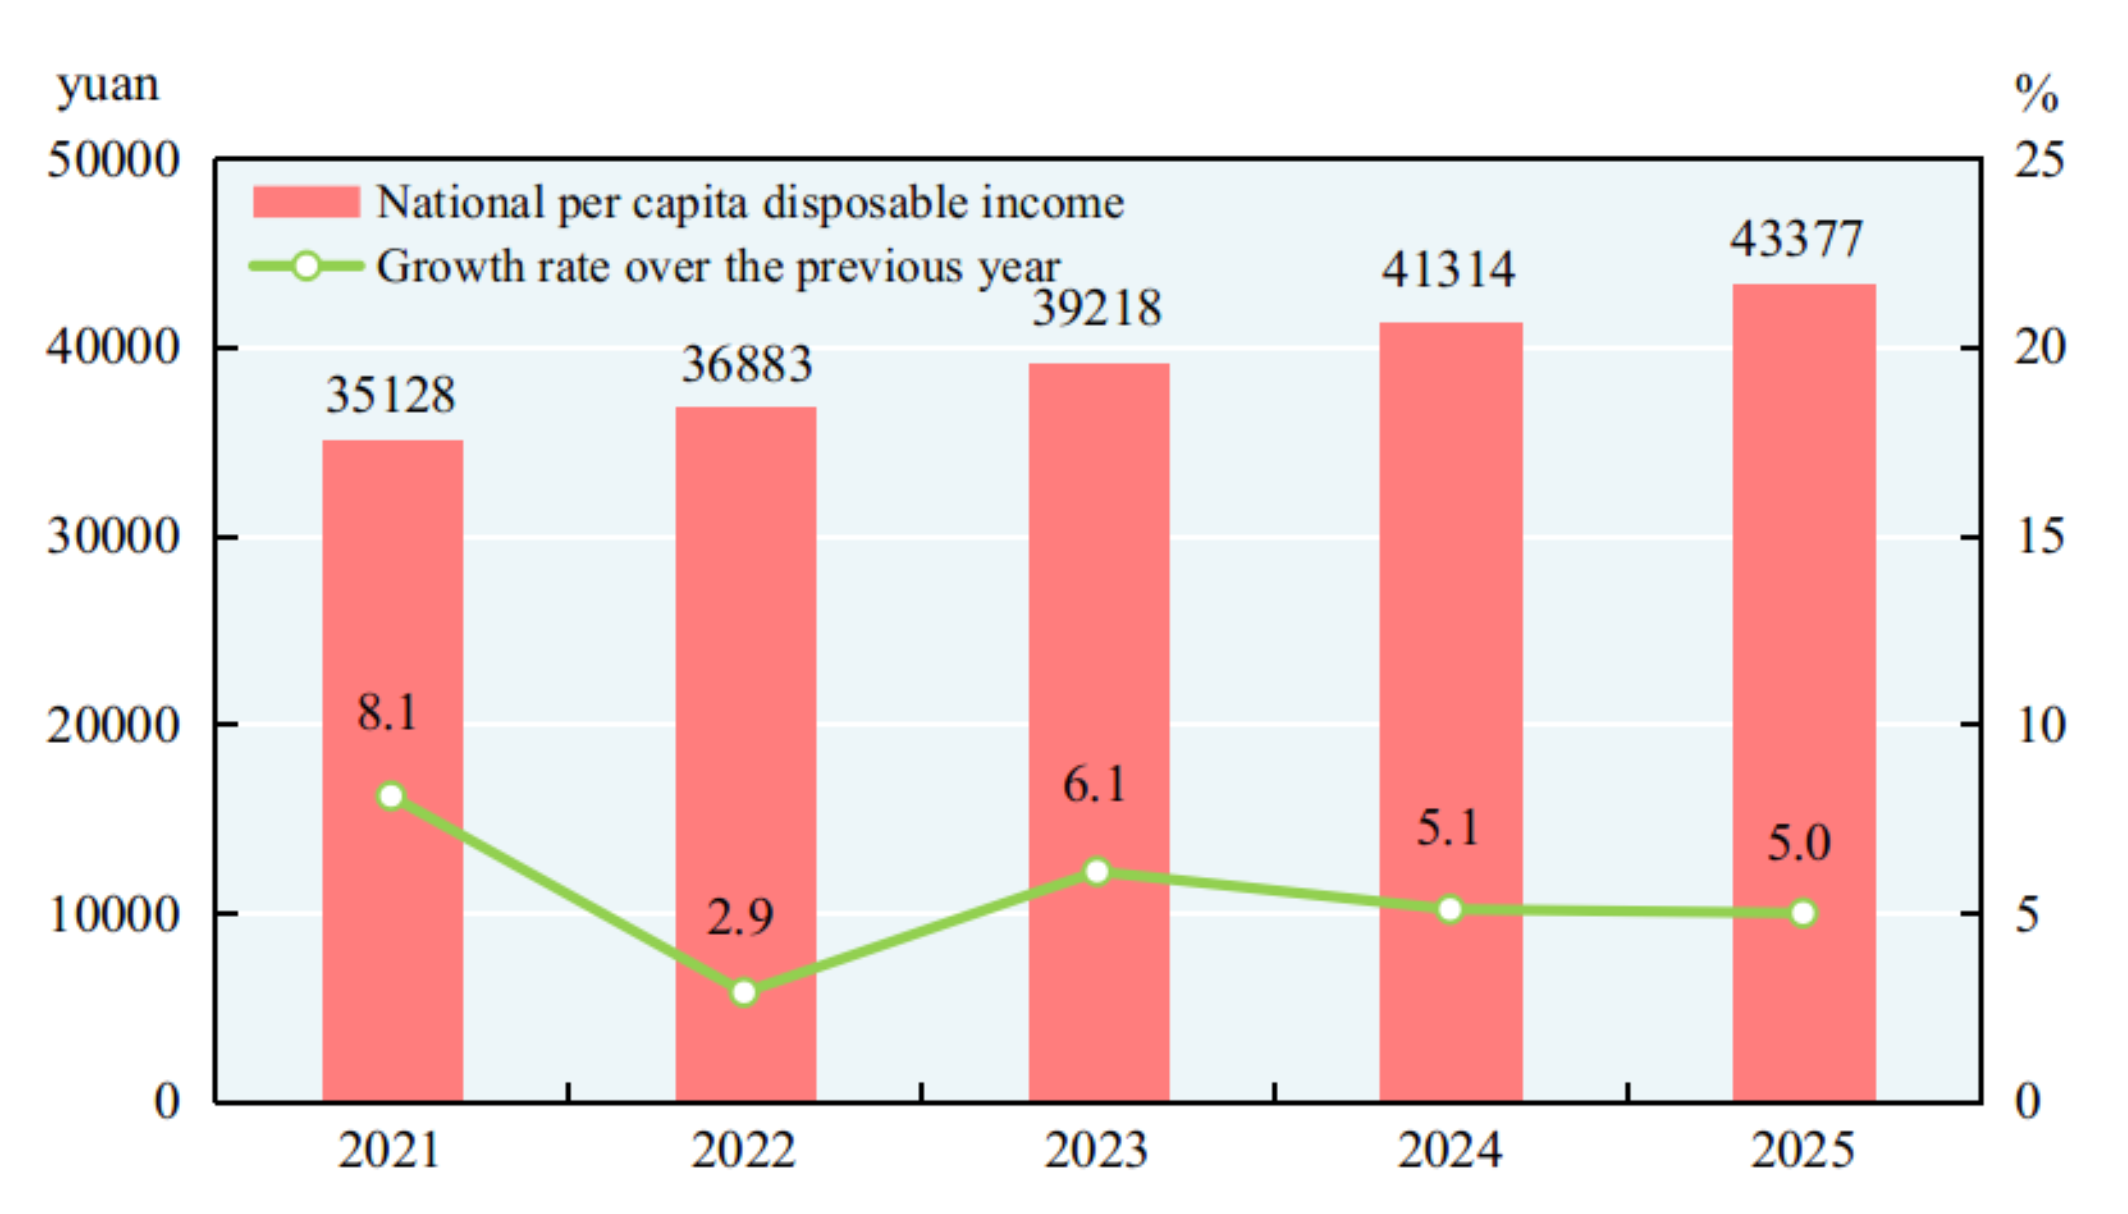
Figure 20: National Per Capita Consumption Expenditure and Composition in 2025
By the end of 2025, a total of 1,075.99 million people participated in the basic endowment insurance program, an increase of 3.16 million over that by the end of 2024. Among which, a total of 546.80 million people participated in the basic old-age insurance scheme for enterprise employees, and 529.19 million people participated in the basic old-age insurance scheme for urban and rural residents. A total of 1,330.68 million people participated in basic medical insurance program, an increase of 4.06 million. Of this total, 388.56 million people participated in the program for enterprise employees, and 942.12 million people participated in the program for urban and rural residents. A total of 249.18 million people participated in unemployment insurance program, an increase of 3.29 million. A total of 305.00 million people participated in work-related injury insurance, an increase of 1.02 million. A total of 259.66 million people participated in maternity insurance programs, an increase of 6.66 million. By the end of 2025, minimum living allowances were granted to 5.95 million urban residents and 33.40 million rural residents, 4.45 million extremely needy rural residents[67] received relief and assistance and 23.99 million person-times of temporary assistance[68] were provided. National pensions and subsidies were regularly provided to 8.13 million ex-servicemen and other entitled people in 2025.
By the end of 2025, there were altogether 42 thousand social welfare institutions providing accommodation, of which 39 thousand were elderly care institutions and 1,196 were institutions for child welfare, assistance and protection. The social welfare institutions provided 7.940 million beds[69], of which 7.680 million were for the elderly and 96 thousand were for children.
X. Science & Technology and Education
Expenditures on research and experimental development activities (R&D) were 3,926.2 billion yuan in 2025, up by 8.1 percent over that of 2024, accounting for 2.80 percent of GDP. Of this total, 277.8 billion yuan was used for basic research programs, up by 11.1 percent over that of 2024, accounting for 7.08 percent of expenditures on R&D. A total of 58.8 thousand projects were financed by the National Natural Science Foundation. By the end of 2025, there were altogether 207 national engineering research centers included into the new sequence management and 1,921 enterprise technology centers recognized by the National Development and Reform Commission. The National Guiding Fund for Transformation of Scientific and Technological Achievements established 36 sub-funds, with a total funding of 62.4 billion yuan. A total of 0.972 million invention patents were authorized, down by 7.0 percent over that of the previous year. The number of PCT patent applications accepted[70] was 78 thousand. By the end of 2025, the number of valid invention patents was 6.318 million, up by 11.1 percent over that by the end of 2024. The number of high-value invention patents per 10,000 people[71] was 16. Trademark registration totaled 4.206 million, down by 12.0 percent over that of the previous year. A total of 1.04 million technology contracts were signed with 7,573.4 billion yuan worth of contracted technology transactions, up by 10.8 percent over that of the previous year. The proportion of citizens with scientific literacy[72] in China reached 16.74 percent.
Figure 21: Expenditure on Research and Experimental Development Activities (R&D) and the Growth Rates 2021-2025
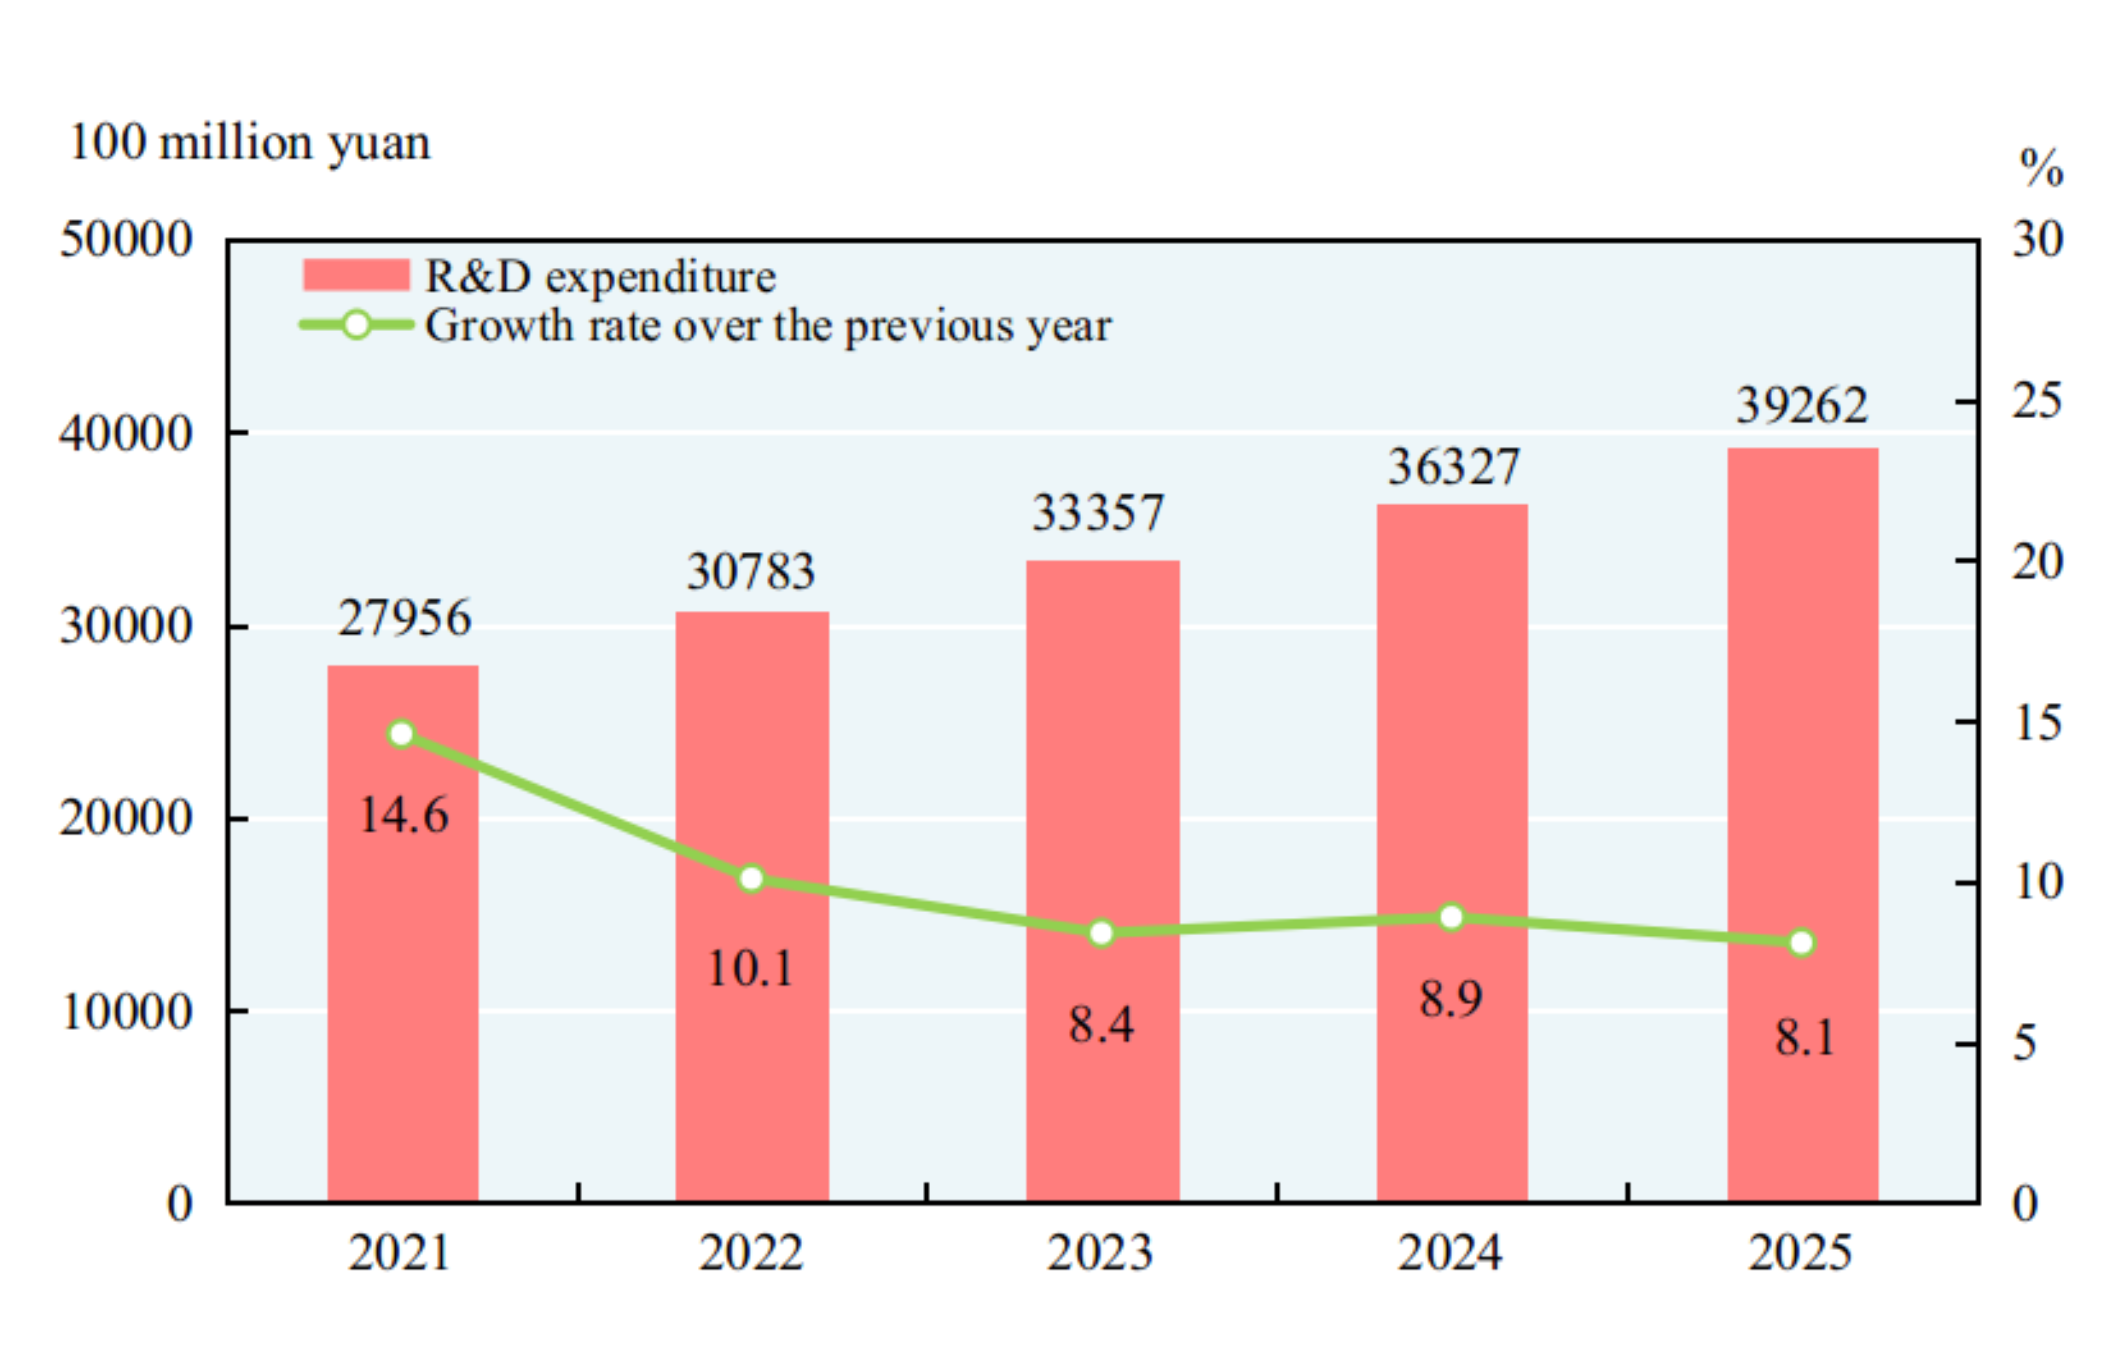
Table 17: Number of Patents Authorized and Valid Patents in 2025
|
Item |
Patents (10,000) |
Increase over 2024 (%) |
|
Number of invention patents authorized |
97.2 |
-7.0 |
|
Of which: domestic |
89.7 |
-3.7 |
|
Number of utility model patents authorized |
146.1 |
-27.3 |
|
Number of appearance design patents authorized |
66.6 |
3.6 |
|
Number of valid invention patents at the end of the year |
631.8 |
11.1 |
|
Of which: domestic |
532.0 |
13.6 |
|
Number of valid utility model patents at the end of the year |
1153.0 |
-1.1 |
|
Number of valid appearance design patents at the end of the year |
317.1 |
3.2 |
The year 2025 saw 92 space launches completed, including 50 commercial space launches. China’s Tianwen-2 mission successfully embarked on its asteroid sample-return journey. Breakthroughs in reusable launch vehicle technologies accelerated, with the maiden flights of Zhuque-3 and Long March-12A achieving successful second-stage orbital insertion. China’s first domestically designed and built electromagnetic catapult-equipped aircraft carrier, Fujian, was officially commissioned. The superconducting quantum computing prototype “Zuchongzhi-3” was successfully constructed. China’s “artificial sun” set a world record of “100-million-degree plasma sustained for 1,000 seconds”. The Jiangmen Underground Neutrino Observatory (JUNO) large-scale scientific facility officially commenced operations. China’s homegrown large AI model DeepSeek drew global attention. The first clinical trial of an invasive brain–computer interface in China was successfully conducted. The first domestically developed cryogenic high-current ion implanter achieved industrial-scale production capability.
By the end of 2025, there were altogether 874 national quality inspection centers. There were 1,216 agencies for product quality, management system and service certification which certified accumulatively 1.17 million enterprises. A total of 4,929 national standards were developed or revised in the year, including 2,481 new standards. The qualification rate of manufactured products[73] reached 94.36 percent.
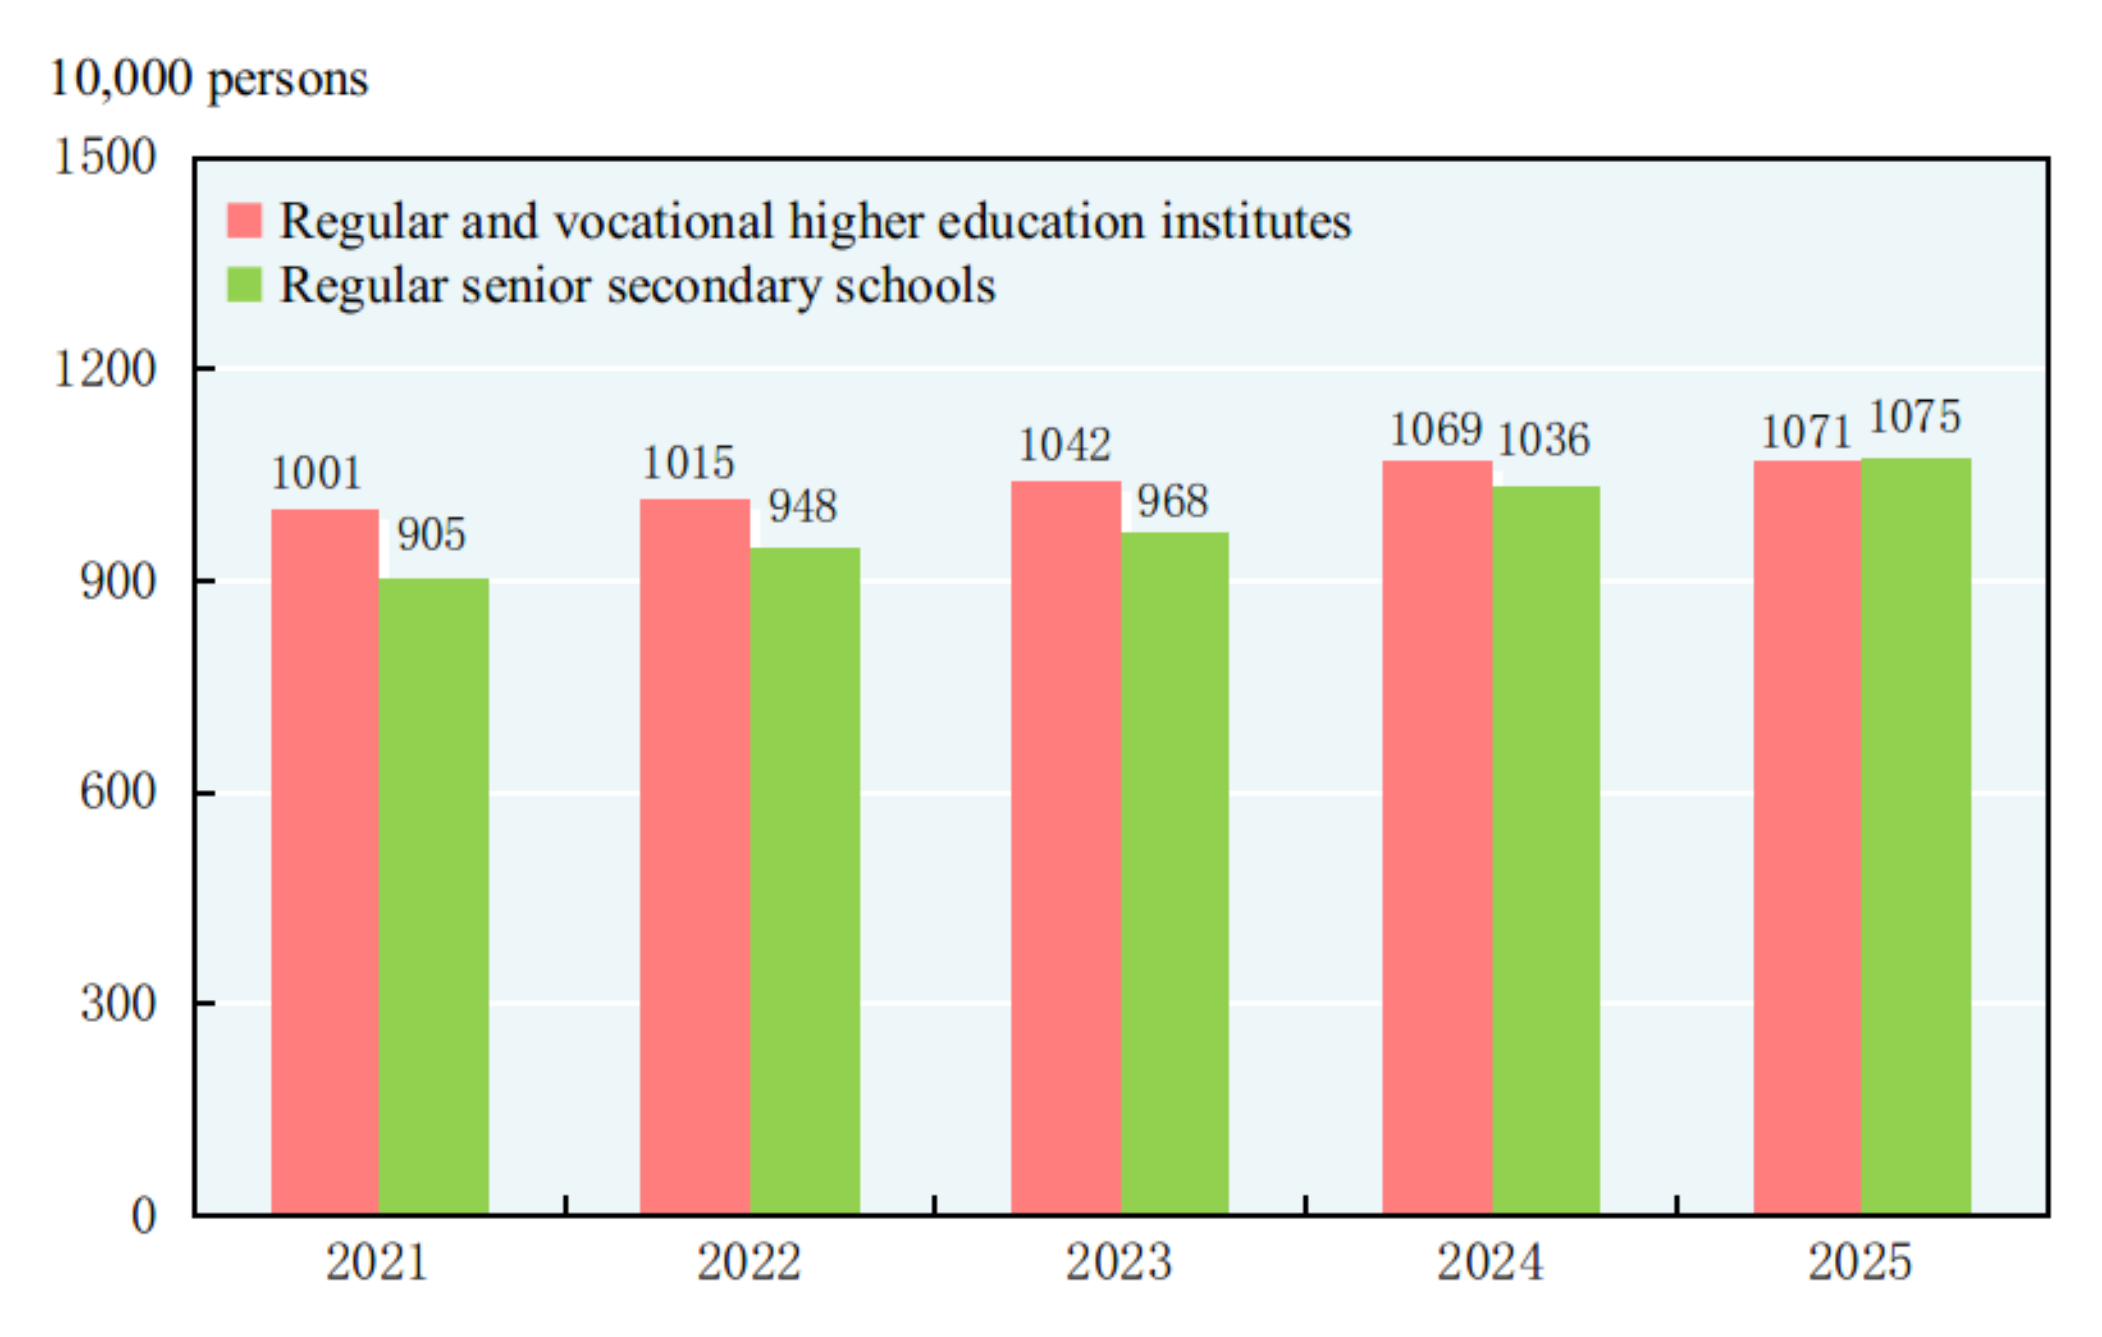
In 2025, graduate institutes enrolled 4.300 million students with 1.438 million entrants and 1.167 million graduates. Total enrollment in undergraduate programs in regular and vocational higher education institutes[74] was 39.540 million with 10.708 million entrants and 11.051 million graduates. The enrollment in secondary vocational education[75] was 15.378 million with 5.265 million entrants and 5.219 million graduates. Regular senior secondary schools had 30.395 million enrolled students, including 10.749 million entrants and 9.246 million graduates. Students enrolled in junior secondary schools totaled 55.093 million, including 18.528 million entrants and 17.237 million graduates. The country had a primary education enrollment of 101.783 million, including 14.617 million entrants and 18.605 million graduates. There were 0.927 million students enrolled in special education schools, with 0.164 million entrants and 0.184 million graduates. Kindergartens accommodated 32.255 million children. The retention rate in nine-year compulsory education reached 96.1 percent, and the gross enrollment ratio for senior secondary education reached 92.0 percent. The average years of schooling of the population aged 16–59 reached 11.3 years, an increase of 0.1 years over the previous year.
Figure 22: Entrants in Education 2021-2025
XI. Culture and Tourism, Public Health and Sports
By the end of 2025, there were 1,879 art-performing groups affiliated to government culture and tourism departments throughout China. A total of 3,253 public libraries received[76] 1,469.83 million person-times of visits nationwide. There were 3,517 cultural centers. Subscribers to cable television programs numbered 207 million, among which 200 million subscribed to digital cable television programs. By the end of 2025, the coverage rates of radio broadcasting and television programs were 99.8 percent and 99.8 percent respectively. A total of 3,376 episodes of 110 TV series and 93,874 minutes of 336 TV cartoons were produced in 2025. The country developed 511 feature movies and 253 popular science movies, documentaries, animation, virtual reality[77] and special movies[78]. A total of 23.0 billion copies of newspapers and 1.6 billion copies of magazines were issued, and 10.8 billion copies of books were published. The average number of books possessed per person[79] was 7.71 copies. By the end of the year, there were 4,227 archives in China and 267.26 million files were accessible to the public. The business revenue of enterprises above the designated size engaged in culture and related industries reached 15,213.5 billion yuan, up by 7.4 percent over that of the previous year on a comparable basis. Among them, the business revenue of enterprises of the 16 classes with prominent characteristics of new cultural business forms[80] increased by 14.3 percent.
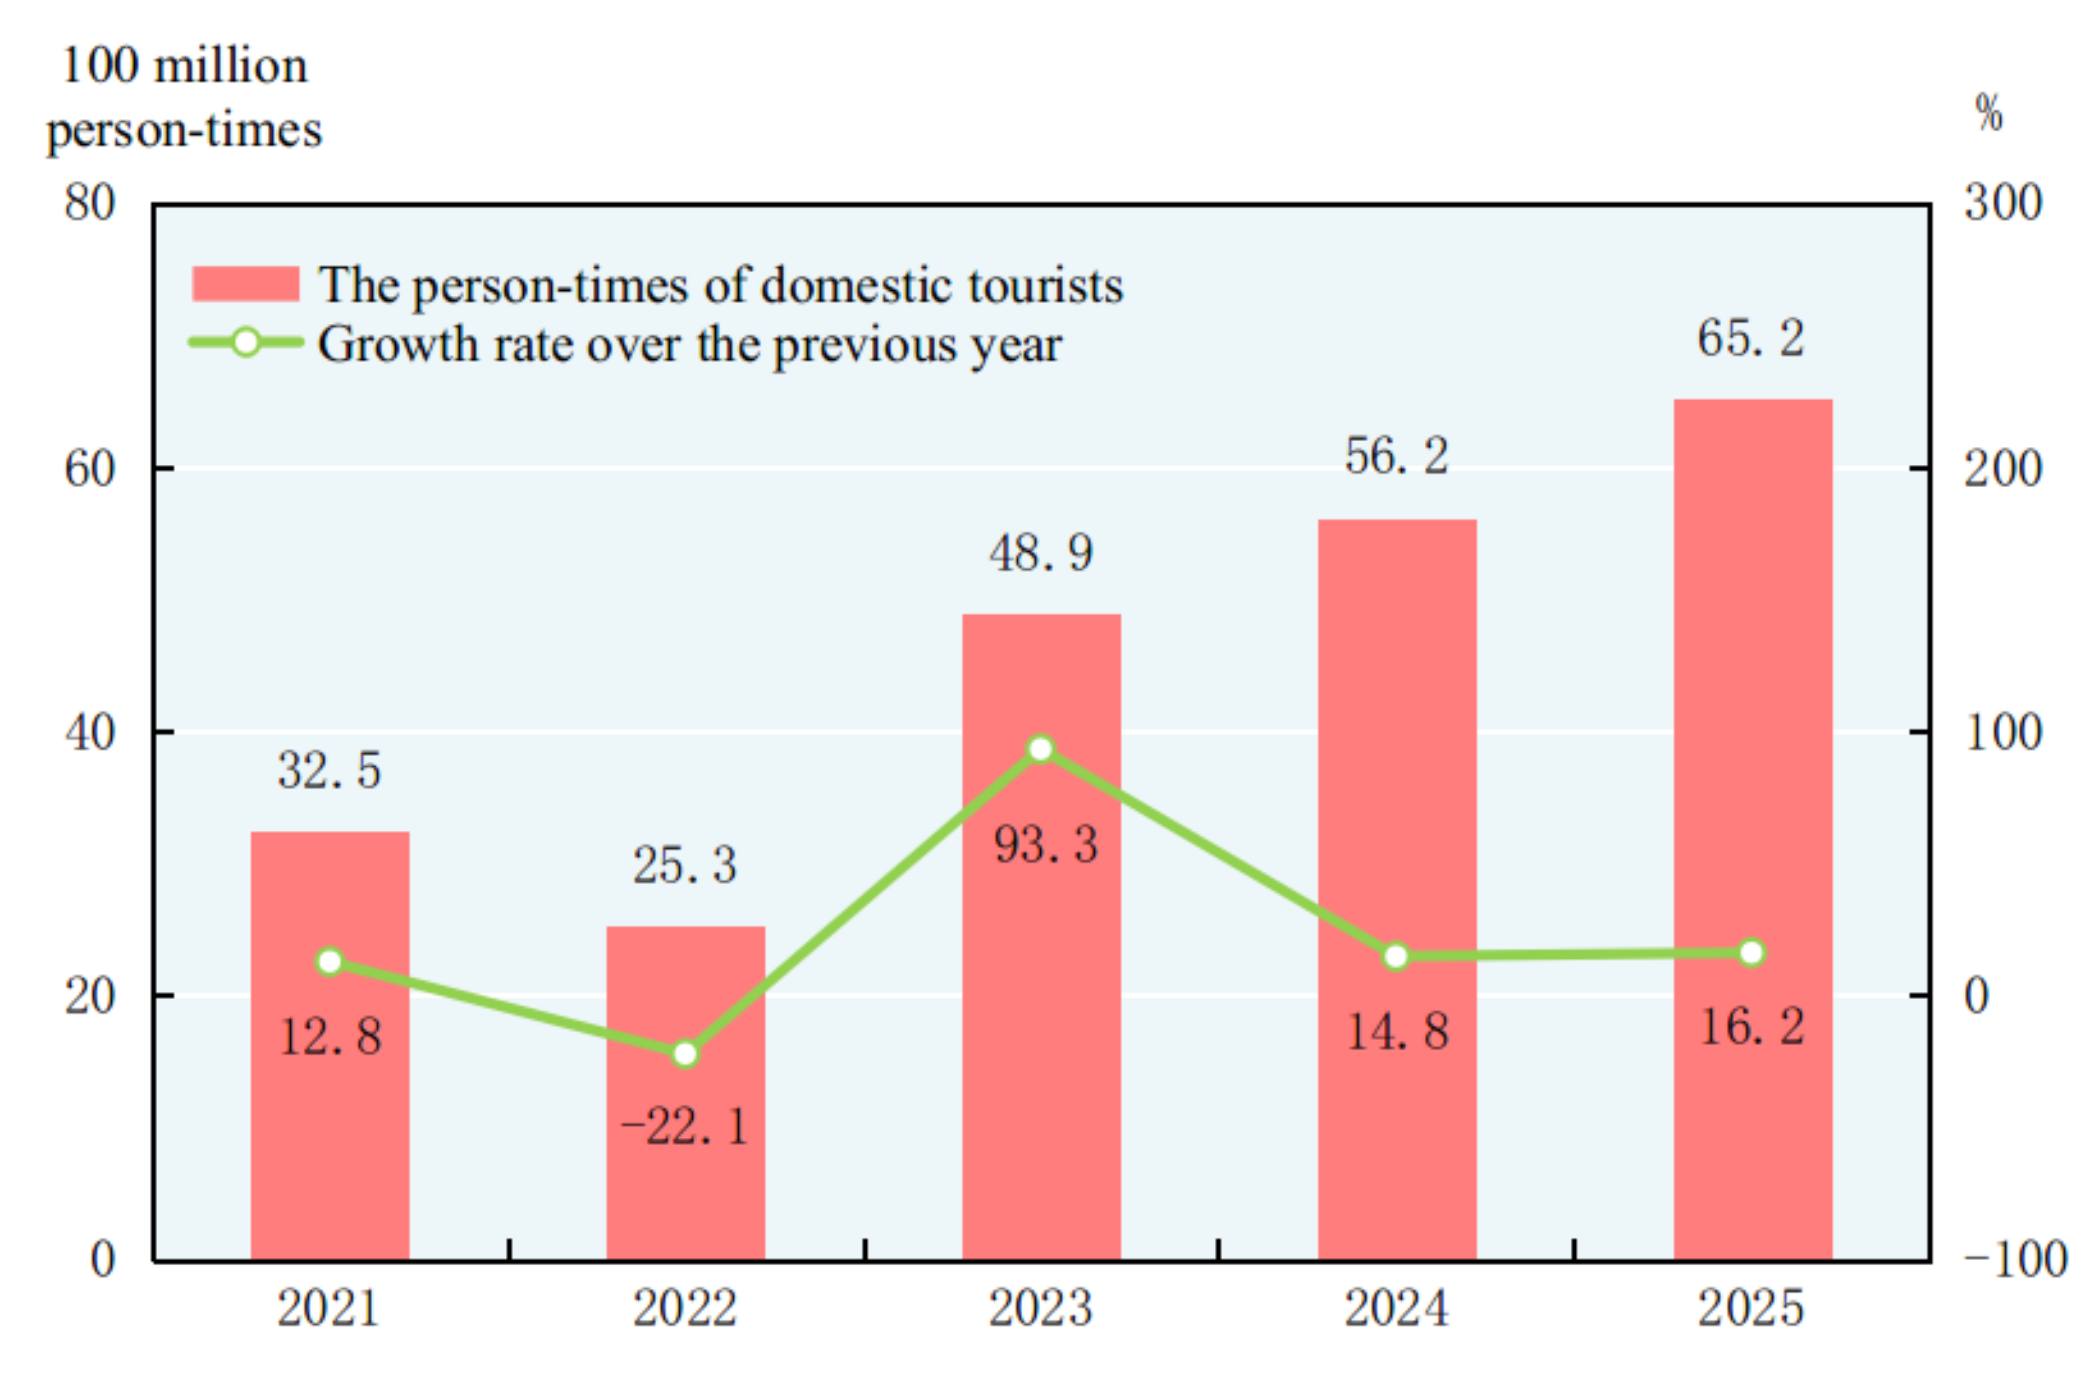
In 2025, a total of 6.52 billion domestic trips were made, up by 16.2 percent over that of the previous year. Of this total, the number of trips made by urban residents was 5.00 billion, an increase of 14.3 percent; and the number of trips made by rural residents was 1.53 billion, an increase of 22.6 percent. The expenditure of domestic tourists was 6,300.3 billion yuan, an increase of 9.5 percent. Of this total, tourists from urban areas spent 5,299.0 billion yuan, an increase of 7.5 percent; and tourists from rural areas spent 1,001.2 billion yuan, an increase of 21.4 percent. The number of inbound visits to China totaled 154.50 million, up by 17.1 percent. Of this total, 35.17 million were made by foreigners and 119.32 million by Chinese compatriots from Hong Kong, Macao and Taiwan. The expenditures of inbound visitors to China totaled 131.1 billion US dollars, up by 39.2 percent. The number of inbound trips made by foreigners to China under the visa-free policies totaled 30.08 million, up by 49.5 percent. The number of outbound visits by Chinese mainland residents totaled 167.92 million. Of this total, 161.66 million were private visits and 112.71 million were to Hong Kong, Macao and Taiwan.
Figure 23: Person-times of Domestic Tourists and the Growth Rates 2021-2025
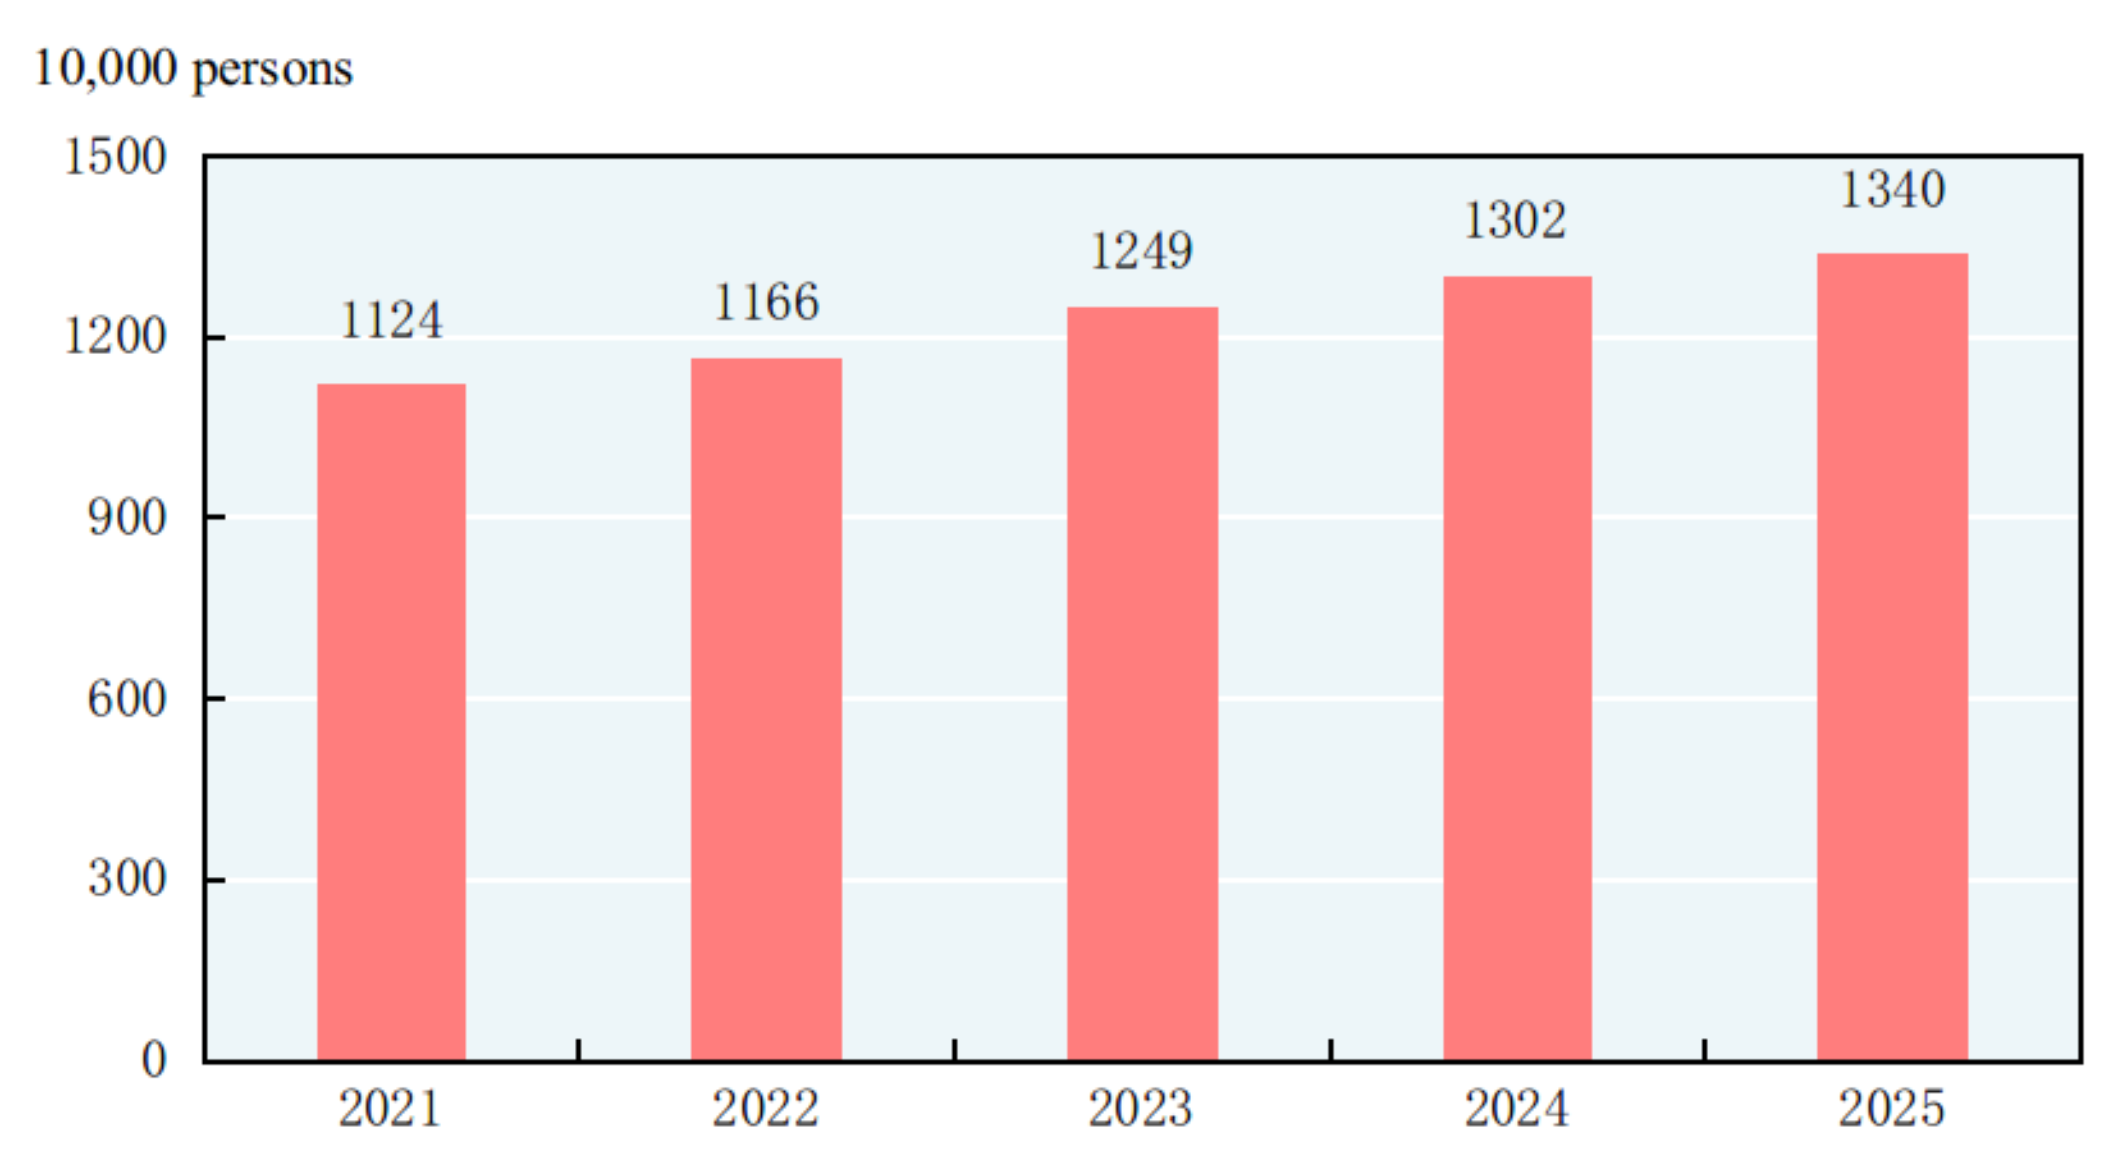
By the end of 2025, there were 1.107 million medical and health institutions in China, including 38 thousand hospitals. Of all the hospitals, 12 thousand were public, and 26 thousand were private. Of the 1.055 million medical and health institutions at grass-root level, 33 thousand were town and township health centers, 38 thousand community health service centers, 424 thousand clinics and 560 thousand village clinics. Of the 9,231 professional public health institutions (excluding health monitoring institutions), 3,478 were disease control and prevention centers. There were 13.40 million medical technical personnel in China, including 5.29 million licensed doctors and licensed assistant doctors and 6.03 million registered nurses. The medical and health institutions in China had 10.09 million beds, of which hospitals had 7.99 million and township health centers had 1.44 million. The total number of medical visits[81] and hospital discharges[82] in 2025 reached 10.58 billion and 0.30 billion respectively.
Figure 24: Year-end Number of Medical Technical Personnel 2021-2025
There were altogether 5.004 million sports venues[83]. The sports venue area[84] totaled 4.37 billion square meters and the per capita sports venue area was 3.1 square meters. In 2025, Chinese athletes won 146 world championships in 31 sport competitions and broke 17 world records. At the 9th Asian Winter Games in Harbin, Chinese athletes won 32 gold medals, 27 silver medals and 26 bronze medals, with a total of 85 medals, ranking first in both the gold medal tally and the overall medal standings, marking the best performance by a Chinese delegation in the history of the Asian Winter Games. Chinese athletes with disabilities won 179 world championships in 23 international sporting events.
XII. Resources, Environment and Emergency Management
In 2025, the total supply of state-owned land for construction use[85] was 471 thousand hectares, a decrease of 22.2 percent over that of the previous year. Of this total, the land supply for industry, mining and warehousing was 138 thousand hectares, down by 10.8 percent; that for real estate[86] was 62 thousand hectares, down by 14.4 percent; and that for infrastructure facilities was 272 thousand hectares, down by 28.4 percent.
In 2025, the total area of afforestation reached 3.56 million hectares, of which 0.83 million hectares were afforested by manpower, accounting for 23.2 percent of the total. The land area improved by grass plantation[87] was 4.93 million hectares. By the end of 2025, there were 5 national parks.
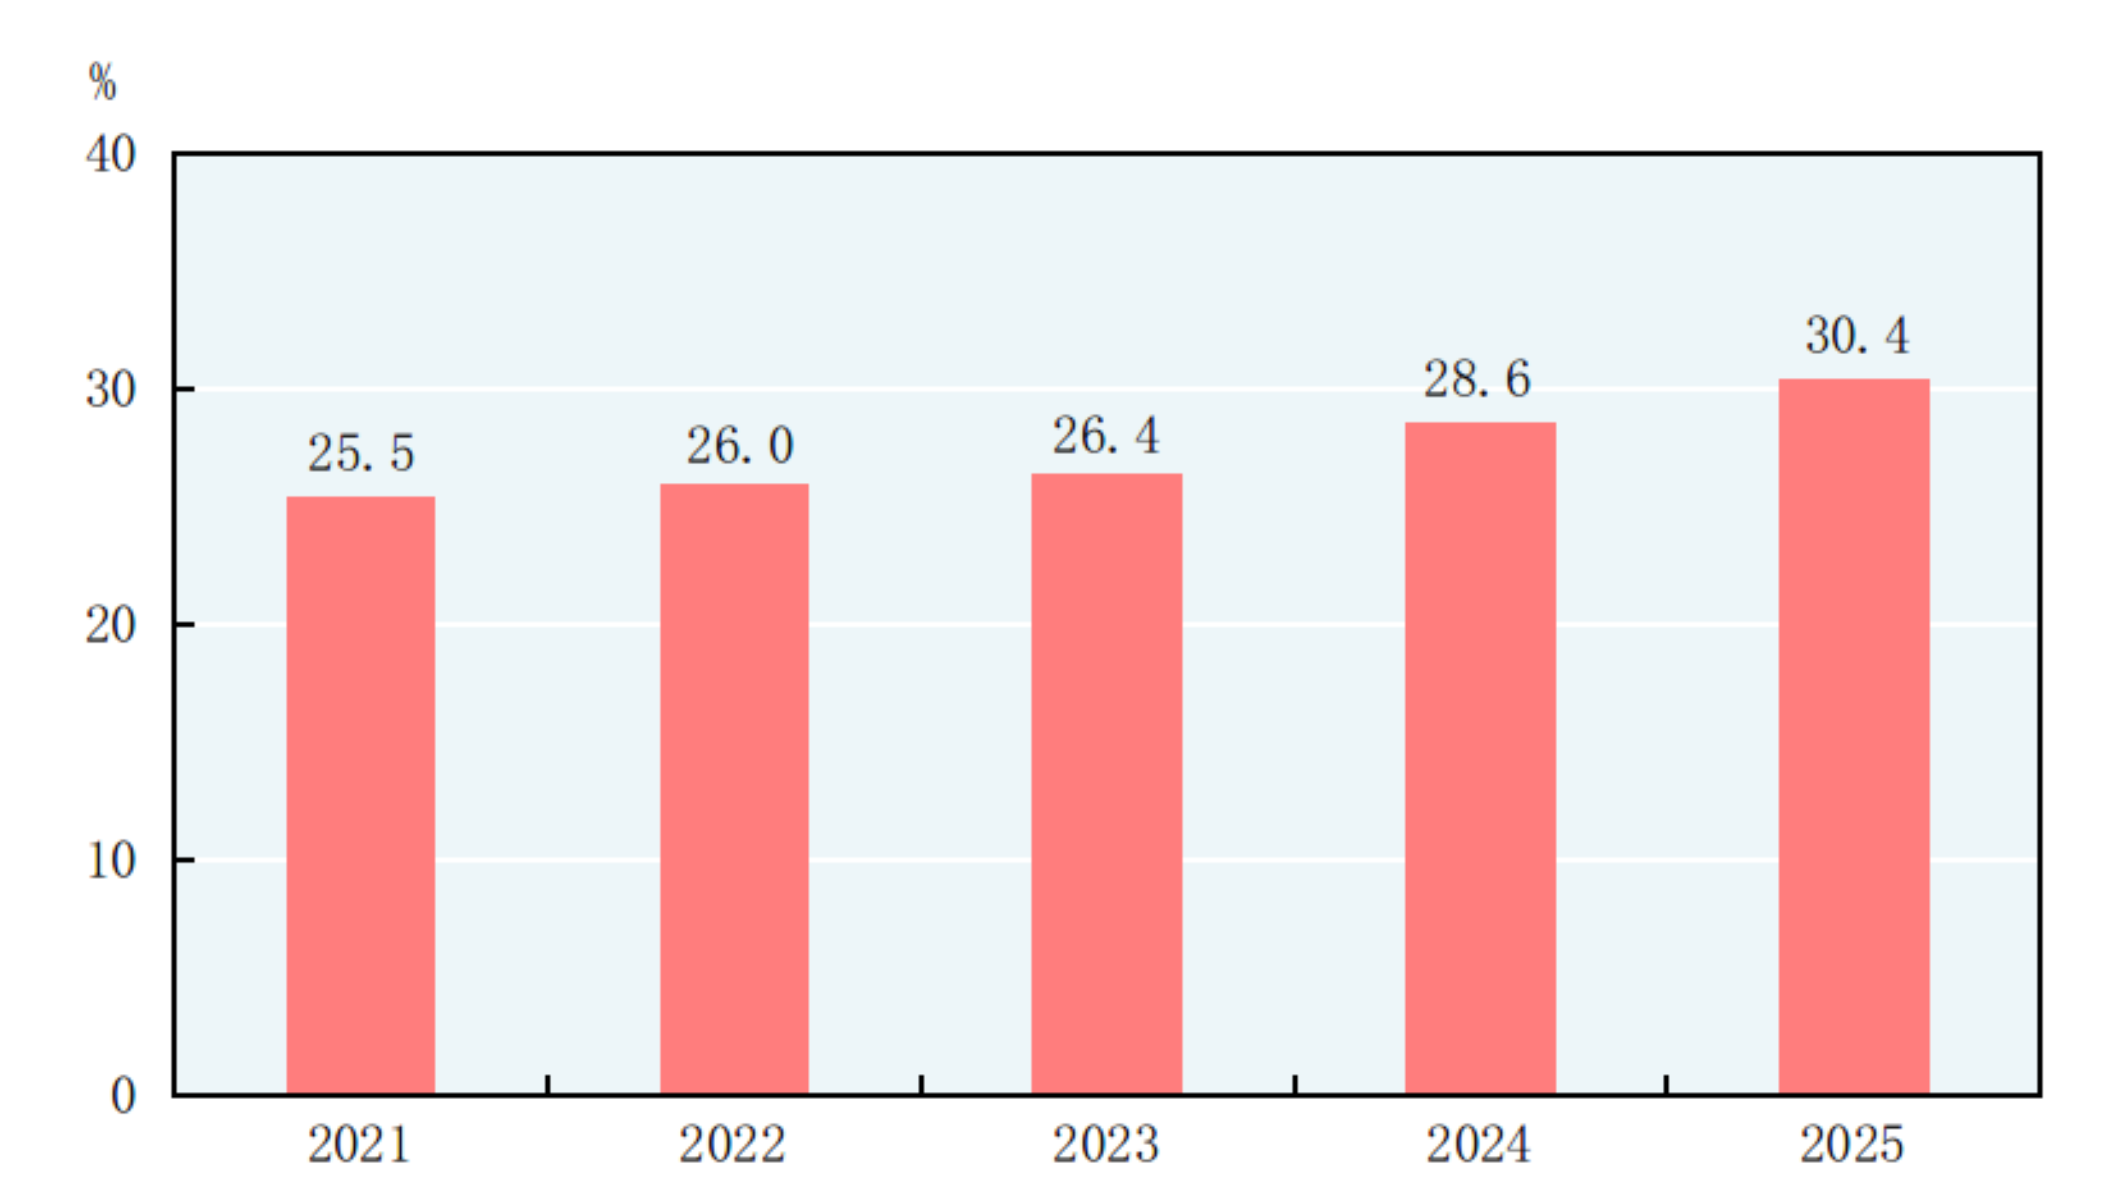
Preliminary estimation indicated that the total energy consumption in 2025 amounted to 6.17 billion tons of standard coal equivalent, up by 3.5 percent over that of 2024. The consumption of coal increased by 0.1 percent; crude oil, up by 3.6 percent; natural gas, up by 2.0 percent; and electric power, up by 5.0 percent. The consumption of coal accounted for 51.4 percent of the total energy consumption, 1.8 percentage points lower than that of 2024, while clean energy consumption, such as natural gas, hydropower, nuclear power, wind power and solar power accounted for 30.4 percent, 1.8 percentage points higher. The comprehensive energy consumption per unit of calcium carbide by major energy-intensive industrial enterprises went down by 0.7 percent, per unit of synthetic ammonia down by 2.3 percent, per ton of steel up by 1.9 percent and per unit of electrolytic aluminium down by 0.9 percent. The standard coal consumption per kilowatt-hour of thermal power generation maintained the same as that of the previous year. According to preliminary estimates, the energy consumption per 10,000 yuan worth of GDP[88] decreased by 5.1 percent over that of the previous year after deducting energy consumed for raw materials and non-fossil energy consumption. The trade volume of carbon emission quotas[89] at the China Carbon Emissions Trading Market reached 235 million tons with a turnover totaling 14.63 billion yuan.
Figure 25: Proportion of Clean Energy Consumption in the Total Energy Consumption 2021-2025
The area of offshore oceanic water[90] that met the national quality standard Grade I and II accounted for 84.9 percent; that met Grade III 4.6 percent; and that of Grade IV or inferior quality 10.5 percent.
Of the monitored 339 cities at prefecture level and above, the annual average concentration of particulate matter (PM2.5) was 28.0 micrograms per cubic meter, down by 4.4 percent over the previous year.
Of the 332 cities subject to urban regional daytime acoustic environment monitoring, 9.3 percent enjoyed excellent environment, 65.1 percent had good environment, 25.0 percent had average environment, 0.6 percent had relatively poor environment and no city had poor environment in 2025.
The average temperature in 2025 was 10.9℃, same as that of the previous year. Typhoons hit China 10 times in 2025.
In 2025, natural disasters hit 6.07 million hectares of crops, of which 0.69 million hectares suffered from complete crop failure. Flood, waterlogging and geological disasters caused a direct economic loss of 166.6 billion yuan. Droughts caused a direct economic loss of 8.6 billion yuan. Disasters caused by low temperature, frost and snow made a direct economic loss of 0.9 billion yuan. Oceanic disasters caused a direct economic loss of 8.9 billion yuan. The country recorded 11 earthquakes with magnitude 5.0 and above, and a total direct economic loss of 9.7 billion yuan was caused by earthquakes of different magnitudes. The year 2025 witnessed 225 forest fires, with 5 thousand hectares of forests damaged.
The death toll due to work accidents amounted to 18,261 people in 2025, down by 7.0 percent over that of the previous year. Work accidents in industrial, mining and commercial companies caused 1.040 deaths out of every 100 thousand employees, down by 4.5 percent over that of 2024. The death toll for one million tons of coal produced in coal mines was 0.045 people, down by 23.7 percent. The road traffic death toll per 10 thousand vehicles was 1.25 people, down by 4.6 percent.
Notes:
[1] All figures in this Communiqué are preliminary statistics. Statistics in this Communiqué do not include Hong Kong SAR, Macao SAR and Taiwan Province. Due to the rounding-off reasons, the subentries may not add up to the aggregate totals.
[2] Gross domestic product (GDP), value added of the three and related industries, regional GDP, per capita GDP and gross national income (GNI) as quoted in this Communiqué are calculated at current prices whereas their growth rates are at constant prices.
[3] Gross national income, also known as gross national product, refers to the total primary distribution of the income created by all the resident units of a country (or a region) during a certain period of time. It equals to gross domestic product plus the net primary distribution of income from abroad.
[4] The overall labor productivity refers to the ratio between the GDP (at 2020 constant prices) and the total number of persons employed.
[5] The national population refers to the population of the 31 provinces, autonomous regions and municipalities directly under the central government and servicemen of the Chinese mainland, excluding residents of Hong Kong, Macao and Taiwan and foreigners living in the 31 provinces, autonomous regions and municipalities directly under the central government.
[6] By the end of 2025, the population aged 0 to 14 (under the age of 15) was 212.76 million and that aged 15 to 59 (under the age of 60) was 868.75 million.
[7] The number of newly increased employed people in urban areas equals the number of cumulative new employment minus the number of natural attrition in urban areas during the reporting period.
[8] The number of migrant workers includes those who are employed outside their villages and towns for more than six months in the year and those who are engaged in non-agricultural work in their villages and towns for more than six months in the year.
[9] The producer prices for farm products refer to the actual unit prices of farm products sold firsthand by producers.
[10] The prices for housing include prices for rent, maintenance and management, water, electricity and fuel, and services of owner-occupied dwellings etc.
[11] The growth rates and rate changes of relevant indicators of the industrial enterprises above the designated size in 2025 were calculated on a comparable basis due to adjustments of survey coverage in the statistical survey programs, statistical law enforcement and removal of duplicated data.
[12] Equipment manufacturing includes manufacture of metal products, manufacture of general purpose equipment, manufacture of special purpose equipment, manufacture of automobiles, manufacture of railway, ship, aerospace and other transport equipment, manufacture of electrical machinery and apparatus, manufacture of computers, communication and other electric equipment, and manufacture of measuring instrument and meter.
[13] High-tech manufacturing includes manufacture of medicine, manufacture of aerospace vehicle and equipment, manufacture of electronic and communication equipment, manufacture of computers and office equipment, manufacture of medical equipment and measuring instrument and meter, and manufacture of information chemicals.
[14] Digital products manufacturing includes manufacture of computers, manufacture of communication and radar equipment, manufacture of digital media equipment, manufacture of intelligent devices, manufacture of electronic components and equipment, and manufacture of other digital products.
[15] The enterprises above the designated size in select service sectors refer to legal entities of transport, storage and post, information transmission, software and information technology services, management of water conservancy, environment and public facilities, and health with annual business revenue of 20 million yuan and above; legal entities of real estate (excluding real estate development and operation), leasing and business services, scientific research and technical services, and education with annual business revenue of 10 million yuan and above; and legal entities of household services, repair and other services, culture, sports and entertainment, and social services with annual business revenue of 5 million yuan and above. Legal entities of finance, wholesale and retail trades, hotels and catering services, and real estate development and operation are not included. The growth rates of financial indicators of the enterprises above the designated size in select service sectors in 2025 were calculated on a comparable basis.
[16] Strategic emerging services refer to the related service sectors of information technology of new generation, manufacture of high-end equipment, new materials, biotech, new energy vehicles, new energy, energy-saving and environmental protection and digital creative industries, and service industries related to new technology, innovation and entrepreneurship.
[17] High-tech services include information services, e-commerce services, inspection and testing services, high-tech services in professional technical services, research, development and design services, services for transformation of scientific and technological achievements, intellectual property and related legal services, as well as environmental monitoring and treatment services.
[18] E-commerce transactions refer to the transactions of goods and services realized through e-commerce trading platforms (including self-built and third-party platforms), including transactions with entities and individuals. The growth rate of 2025 was calculated on a comparable basis.
[19] Online retail sales refer to the retail sales of goods and services realized through internet trading platforms (online platforms mainly in trading physical goods, including self-built websites and third-party platforms). The growth rate of 2025 was calculated on a comparable basis.
[20] The growth rates of relevant indicators of the investment in fixed assets in 2025 were calculated on a comparable basis due to methodology reform of investment statistics and statistical law enforcement.
[21] The eastern region includes 10 provinces and municipalities: Beijing, Tianjin, Hebei, Shanghai, Jiangsu, Zhejiang, Fujian, Shandong, Guangdong and Hainan; the central region covers 6 provinces: Shanxi, Anhui, Jiangxi, Henan, Hubei and Hunan; the western region includes 12 provinces, autonomous regions and municipalities: Inner Mongolia, Guangxi, Chongqing, Sichuan, Guizhou, Yunnan, Xizang, Shaanxi, Gansu, Qinghai, Ningxia and Xinjiang; the northeastern region includes 3 provinces: Liaoning, Jilin and Heilongjiang.
[22] The carbon dioxide emissions per 10,000 yuan worth of GDP include carbon dioxide emissions in the process of energy activities and industrial production, and was calculated at 2020 constant prices.
[23] See Note 11.
[24] The data included the steel reprocessed among enterprises.
[25] See Note 11.
[26] Capacity utilization rate refers to the ratio of the actual production to the production capacity (in terms of value). Actual production refers to the total industrial output value during the enterprise’s reporting period. Production capacity refers to the production which can be realized and sustained for a long term under the condition of the supply of labor force, raw materials, fuel and transportation guaranteed and the production equipment in proper operation during the reporting period.
[27] Thermal power refers to electricity generated by coal, oil, gas, residual heat, pressure and gas, and biomass.
[28] A few installed power generation capacity (e.g. geothermal) is not listed.
[29] The growth rate of profits made by construction enterprises in 2025 was calculated on a comparable basis due to statistical law enforcement and removal of duplicated data.
[30] See Note 15.
[31] The total freight traffic and flows include the traffic and flows by railways, highways, waterways, civil aviation and pipelines. The growth rates in 2025 were calculated on a comparable basis.
[32] The vehicle occupancy rate of ride-hailing services was adjusted in 2025, leading to corresponding revisions in data of indicators such as passenger traffic of urban taxi services for both the year and the same period of the previous year. The growth rates of total passenger traffic, passenger flows, highway passenger traffic and highway passenger flows in 2025 were calculated on a comparable basis.
[33] The volume of postal and delivery services refers to the total volume of universal postal services and express delivery services provided by enterprises.
[34] The turnover of telecommunication services was calculated based on the prices of the previous year.
[35] The number of mobile phone base stations refers to the total number of wireless transceivers serving communities that handle the wireless communication between the base stations and mobile stations, relay between the mobile switchboards and mobile stations, and monitor the quality of wireless transmission at the end of the reporting period.
[36] Fixed broadband internet users refer to those who subscribed to the telecommunication enterprises and accessed the Internet through xDSL, FTTx+LAN, FTTH/O and other broadband access ways as well as general dedicated lines at the end of the reporting period.
[37] Users of broadband with the speed of 1000M and above refer to those who enjoy a downstream rate of 1000Mbit/s or above at the end of the reporting period.
[38] Users of mobile internet of things terminals refer to those who access the mobile internet and subscribe to the internet of things services at the end of the reporting period. Internet of things terminals refers to the internet of things devices that connect the sensing network layer and the transmission network layer to implement remote data collection and data transmission to the network layer.
[39] Software and information technology services industry includes software development, integrated circuit design, information system integration and internet of things technology services, operation maintenance services, information processing and storage support services, IT consulting services, digital content services and other IT services industry. The growth rate of software revenue of software and information technology services industry in 2025 was calculated on a comparable basis.
[40] The statistical coverage of the express delivery was adjusted in 2024, and the growth rate in the year was calculated on a comparable basis.
[41] The retail sales of services refer to the total value of services directly provided by enterprises (establishments, self-employed units) to individuals and other units for non-production and non-operating purposes in the form of transactions. It aims to reflect the value of services with the nature of consumption sold by service providers in monetary terms, including the retail sales of services in transportation, accommodation, catering, education, health, sports, entertainment and other fields.
[42] See Note 19.
[43] See Note 20.
[44] See Note 21.
[45] Investment in infrastructure includes investment in railway transportation, highway transportation, waterway transportation, civil aviation transportation, pipeline transportation, multi-modal transportation and forwarding agency, loading, unloading and delivery, postal service, telecommunication, radio, TV and satellite transmission, internet and related services, management of water conservancy, ecological conservation and environmental governance, and management of public facilities.
[46] Investment in social sector includes investment in education, health and social services, culture, sports and entertainment.
[47] Private investment refers to investment in the construction or purchase of fixed assets in the country by domestic collective, private and individual-owned survey units or their holding units (including absolute holding and relative holding).
[48] The investment in real estate includes the investment in real estate development, construction of buildings for own use, property management, intermediary services and other real estate investment.
[49] According to the methodology of real estate development statistics and regulations of the statistical law enforcement, data of indicators such as investment in real estate development and floor space of newly-built commercial buildings sold for the same period of the previous year were revised. The growth rates of 2025 were calculated on a comparable basis.
[50] The floor space of newly-built commercial buildings sold refers to the total contract floor space of newly-built commercial buildings sold by real estate development enterprises within the reporting period.
[51] The floor space of second-hand housing online transactions refers to the total contract floor space of second-hand housing online transactions in urban areas within the reporting period.
[52] Other Regional Comprehensive Economic Partnership (RCEP) member countries include Brunei, Myanmar, Cambodia, Indonesia, Laos, Malaysia, Philippines, Singapore, Thailand, Vietnam, Japan, Republic of Korea, Australia and New Zealand.
[53] Starting from January 2025, the People’s Bank of China adopted the revised statistical coverage of money supply of narrow sense (M1). The revised M1 includes currency in circulation (M0), corporate demand deposits, personal demand deposits and customers’ reserve funds with non-bank payment institutions. The growth rate of 2025 is calculated on a comparable basis.
[54] The AFRE (flow) refers to the total volume of financing provided by the financial system to the real economy within a certain period of time.
[55] The AFRE (stock) refers to the outstanding financing provided by the financial system to the real economy at the end of a period of time (a month, a quarter or a year).
[56] Inclusive loans to small and micro businesses include loans to small and micro businesses with single-client credit line under 10 million yuan, operating loans to self-employed businesses and owners of small and micro businesses.
[57] Weighted average interest rate on newly issued corporate loans refers to the weighted average interest rate calculated using the total amount of newly issued corporate loans (Renminbi and foreign currency) throughout the year as the weight.
[58] Funds raised through Shanghai and Shenzhen Stock Exchanges are calculated by the money raised on the listing date, and the funds raised include the actual exchanged convertible bonds, which were 169.4 billion yuan in 2024 and 226.7 billion yuan in 2025.
[59] Funds raised through Beijing Stock Exchanges are calculated by the money raised on the listing date.
[60] Preferred shares were excluded from the funds raised by listed companies in the National Equities Exchange and Quotations. Funds raised by shares are calculated based on the listing date of newly issued shares.
[61] Corporate credit bonds include debt financing instruments issued by non-financial businesses, enterprise bonds, corporate bonds and convertible bonds.
[62] The premium of primary insurance received by the insurance companies refers to the premium income from primary insurance contracts confirmed by the insurance companies.
[63] The median of per capita disposable income refers to the per capita income of household lied in the middle of all surveyed households which are ranked from low to high based on per capita disposable income level.
[64] The income quintile refers to the five equal partitions of all surveyed households, who are ranked from low to high based on per capita income level. The bottom 20 percent with the lowest income are classified as low-income group, and the other four levels are lower-middle-income group, middle-income group, upper-middle-income group and high-income group.
[65] Counties lifted out of poverty include 832 key counties under the national poverty alleviation and development program and counties in contiguous poor areas as well as 7 cities and counties in Aksu prefecture, Xinjiang.
[66] The consumption expenditure on services refers to the spending by households on services for daily lives including catering, clothing and footwear processing, housing, family, transportation and communication, education, culture and recreation, medical services and others.
[67] Extremely needy rural residents refer to the aged, the disabled and the minors under 16 years of age in rural areas who have no ability to work, no sources of income and no statutory obligors to provide for them, bring them up or support them, or whose statutory obligors have no ability to fulfill their obligations.
[68] Temporary assistance refers to emergent and transitional assistance provided by the government to families or individuals who experience hardships because of emergencies, unexpected harm, major diseases or other unusual factors and are not covered by other forms of social assistance programs or still suffer hardships after receiving other social assistance programs as well as other transitional assistance including winter heating assistance, temporary price subsidies and festive visits and condolences.
[69] The beds provided by social welfare institutions include beds provided by adoption agencies, aid agencies and community agencies.
[70] PCT is the abbreviation of Patent Cooperation Treaty, which is a treaty for international cooperation in the field of patents. The number of PCT patent applications accepted refers to the number of PCT patent application accepted by the State Intellectual Property Office which acts as the receiving office of PCT patent application.
[71] The number of high-value invention patents per 10,000 people refers to the number of valid invention patents owned per 10,000 national residents which are authorized by the China National Intellectual Property Administration and meet any of the following conditions: invention patents for strategic emerging industries; invention patents having corresponding foreign patents; invention patents maintained more than 10 years; invention patents with a relatively high pledge financing amount; and invention patents that won the National Science and Technology Award and the China Patent Award.
[72] Citizens with scientific literacy refer to citizens carrying out scientific spirit, spreading scientific philosophy, mastering basic scientific methods and scientific knowledge, and able to apply them to analysis and problem solving.
[73] The qualification rate of manufactured products is the ratio of the samples that have passed the sampling quality test, the process of which follows certain methods, procedure and standard, to the total amount of the sampled products.
[74] Regular and vocational higher education institutes include regular universities, vocational undergraduate education and higher vocational colleges.
[75] Secondary vocational education includes regular specialized secondary schools, adult specialized secondary schools, vocational high schools and skilled workers schools.
[76] The people received by the public libraries refer to the number of people who visit libraries and use library services in the year, including borrowing and reading books, consultation and attending readers’ programs.
[77] Virtual reality films refer to new forms of cinema produced using virtual reality technologies, including augmented reality and mixed reality, viewed through virtual reality terminals such as head-mounted displays, and publicly exhibited in fixed screening venues such as cinemas.
[78] Special movies refer to those using different display modes in terms of projection techniques, equipment and program as compared with the ordinary cinemas, such as IMAX movies, 3D movies, 4D movies, multidimensional movies and full dome movies.
[79] The average number of books possessed per person refers to the average number of books published in the year that can be possessed per person in China.
[80] The 16 classes with prominent characteristics of new cultural business forms include: integrated broadcasting and television control services; internet search services; other internet information services; digital publishing; other cultural and arts services; animation; digital content services for games; online game services; multimedia services; software development for games, animation and digital publishing; value-added telecommunications services for cultural industries; other digital cultural content services; online advertising services; online cultural entertainment platform services; copyright and cultural software services; manufacturing of intelligent unmanned aerial vehicles for entertainment purposes; manufacturing of wearable smart cultural devices; and manufacturing of other smart cultural consumer devices.
[81] The total number of medical visits refers to the number of people receiving medical services, including outpatient services, emergency treatment, home visits, appointment-based diagnosis and treatment, health check-up of a specific item, and health consultation and guidance (excluding health lectures and nucleic acid tests).
[82] The number of hospital discharges refers to the number of inpatients discharged from hospitals in the reporting period, including those who are discharged from hospitals or transferred to other medical institutions following doctors’ advice, discharged from hospitals without doctors’ permission, dead or in other situations. The number of people who are recovered from family sickbeds is excluded.
[83] The sports venues belonging to armed forces and the railway system are excluded in the census on sports venues.
[84] The sports venue area refers to area used for physical training, sports competitions and physical fitness.
[85] Total supply of state-owned land for construction use refers to the total amount of state-owned land for construction use with the land-use right transferred, allocated or leased to units or individuals through signed transaction contracts and allocation decisions by the municipal or county governments according to annual land supply plan and in line with relevant laws in the reporting period.
[86] Land used for real estate refers to the sum of land used for commercial service and for residence.
[87] The land area improved by grass plantation refers to the area of grasslands that are ecologically restored through manual grass plantation, aerial grass seeding, the quality improvement of grasslands and fencing enclosure.
[88] The energy consumption per 10,000 yuan worth of GDP is calculated at prices of 2020.
[89] The carbon emission quotas at the China Carbon Emissions Trading Market refers to the emission quotas of greenhouse gases such as carbon dioxide allocated to major emission entities for the prescribed period at the China Carbon Emissions Trading Market. One unit of carbon emission quota is equivalent to one ton of carbon dioxide equivalent emitted into the atmosphere.
[90] Offshore oceanic water quality is evaluated by the area method.
Data Sources:
In this Communiqué, data of newly increased employed people in urban areas, endowment insurance, unemployment insurance, work injury insurance and skilled workers schools in secondary vocational education are from the Ministry of Human Resources and Social Security; data of foreign exchange reserves and exchange rates are from the State Administration of Foreign Exchange; data of business entities, quality inspection, the formulation and revision of national standards and qualification rate of manufactured products are from the State Administration for Market Regulation; data of motor vehicles for civilian use and traffic accidents are from the Ministry of Public Security; data of environment quality and carbon emission trading are from the Ministry of Ecology and Environment; data of output of aquatic products are from the Ministry of Agriculture and Rural Affairs; data of production of timber, area of afforestation, area of grass planting and improvement and national parks are from the National Forestry and Grassland Administration; data of installed power generation capacity, newly increased alternating current transformer equipment with a capacity of over 220 kilovolts and electricity consumption are from the China Electricity Council; data of volume of freight handled by ports, container shipping of ports, highway transportation, waterway transportation, new and rebuilt highways and new throughput capacity of berths for over 10,000-tonnage ships are from the Ministry of Transport; data of railway transportation are from the National Railway Administration; data of civil aviation and new civil transportation airports are from the Civil Aviation Administration of China; data of pipeline transportation are from China National Petroleum Corporation, China Petrochemical Corporation, China National Offshore Oil Corporation and China Oil & Gas Piping Network Corporation; data of postal service are from the State Post Bureau; data of telecommunication, software revenue, new lines of optical-fiber cables and technology contracts are from the Ministry of Industry and Information Technology; data of internet users and internet coverage are from the China Internet Network Information Center; data of new railways put into operation, extended or new double-track railways put into operation and electrified railways put into operation are from China Railway; data of floor space of second-hand housing online transactions, government-subsidized housing, renovation of dilapidated housing in urban areas, renovation of old urban residential compounds and renovation of housing in rural areas are from the Ministry of Housing and Urban-Rural Development; data of imports and exports of goods are from the General Administration of Customs; data of imports and exports of services, foreign investment, outbound direct investment, overseas contracted projects and overseas labor contracts are from the Ministry of Commerce; data of finance are from the Ministry of Finance; data of tax cuts, fee deductions and tax refunds are from the State Taxation Administration; data of monetary finance and corporate credit bonds are from the People’s Bank of China; data of funds raised through domestic exchange markets are from China Securities Regulatory Commission; data of the insurance sector are from the National Financial Regulatory Administration; data of medical insurance and maternity insurance are from the National Healthcare Security Administration; data of urban and rural minimum living allowances, relief and assistance granted to extremely needy rural residents, temporary assistance and social welfare are from the Ministry of Civil Affairs; data of entitled people are from the Ministry of Veterans Affairs; data of natural science foundation projects are from the National Natural Science Foundation; data of national engineering research centers and enterprise technology centers recognized by the National Development and Reform Commission are from the National Development and Reform Commission; data of National Guiding Fund for Transformation of Scientific and Technological Achievements are from the Ministry of Science and Technology; data of patents and trademarks are from the National Intellectual Property Administration; data of the proportion of citizens with scientific literacy are from the China Association for Science and Technology; data of aerospace launches are from the State Administration of Science, Technology and Industry for National Defense; data of education are from the Ministry of Education; data of art-performing groups, public libraries, cultural centers and tourism are from the Ministry of Culture and Tourism; data of television and radio programs are from the National Radio and Television Administration; data of movies are from the China Film Administration; data of newspapers, magazines and books are from the National Press and Publication Administration; data of archives are from the State Archives Administration; data of inbound trips made by foreigners to China under the visa-free policies, China’s outbound visits are from the National Immigration Administration; data of medical care and health are from the National Health Commission; data of sports are from the General Administration of Sport; data of physically-challenged athletes are from the China Disabled Persons’ Federation; data of supply of state-owned land for construction use and direct economic loss caused by oceanic disasters are from the Ministry of Natural Resources; data of average temperature and typhoons are from the China Meteorological Administration; data of areas of crops hit by natural disasters, direct economic loss caused by flood, waterlogging and geological disasters, direct economic loss caused by droughts, direct economic loss caused by low temperature, frost and snow, the number of earthquakes, direct economic loss caused by earthquakes of different magnitudes, forest fires, areas of forests damaged and workplace accidents are from the Ministry of Emergency Management; all the other data are from the National Bureau of Statistics.
In case of any differences between English translation and the original Chinese text, the Chinese edition shall prevail.