Accelerating the Establishment of Coordinated Development Paradigm Beijing-Tianjin-Hebei Coordinated Development Index Continues to Rise in 2024
Statistics & Monitoring Office for Beijing-Tianjin-Hebei Coordinated Development
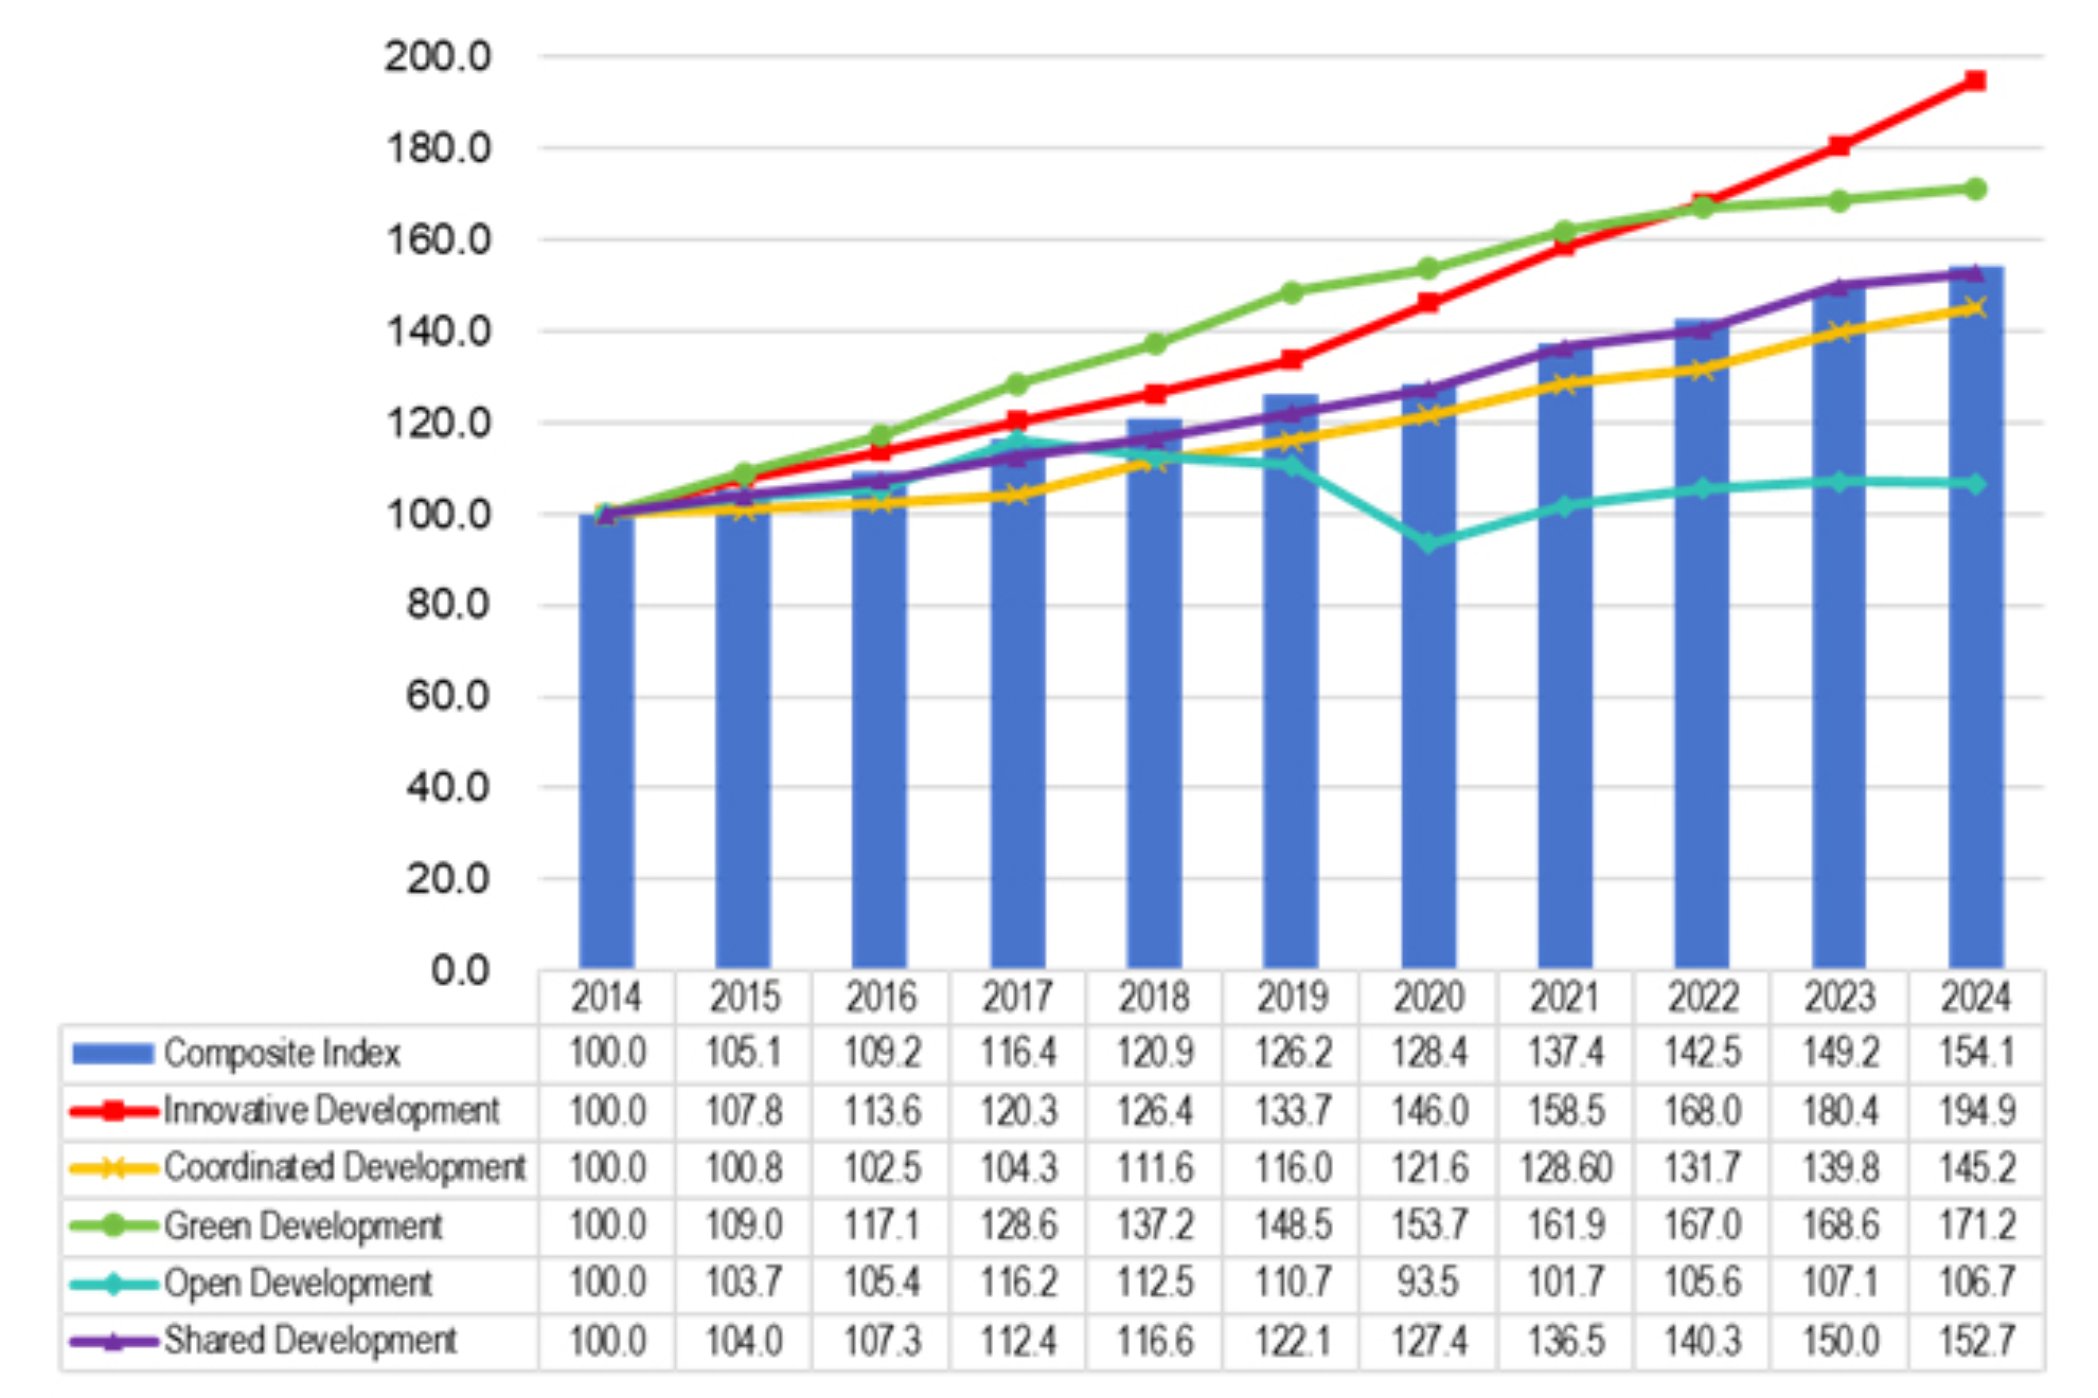
In 2024, Beijing, Tianjin, and Hebei thoroughly implemented the guiding principles of General Secretary Xi Jinping’s important speeches on Beijing-Tianjin-Hebei (“BTH”) Coordinated Development, adhered to the general principle of pursuing progress while ensuring stability, solidly promoted innovative coordination and industrial cooperation, and constantly deepened coordinated development. The calculation results showed that the BTH Coordinated Development Index was 154.1 (with 2014 as the baseline), an increase of 4.9 compared with 2023. Among them, the two sub-indices of innovative development (194.9) and green development (171.2) were higher than the composite index, increasing by 14.5 and 2.6, respectively, compared with 2023, acting as the key drivers of the overall increase; the shared development index and coordinated development index steadily rose, standing at 152.7 and 145.2, up 2.7 and 5.4 from 2023, respectively; the open development index moderated, with a value of 106.7, down 0.4 from 2023.
I. Achievements in innovative development were outstanding, stimulating new momentum for coordinated development
In 2024, innovative investment and output in the region grew rapidly. Beijing’s original innovation capability led the country, with the breadth and depth of innovative cooperation gradually enhancing. The innovation development index was 194.9, an increase of 14.5 from 2023, with both the index level and growth rate topping all sub-indices.
The region’s overall social R&D expenditure intensity was 4.22%, up 0.2 percentage points from the previous year [1]. Among them, the intensity was 6.58% in Beijing, remaining at the top position among all provinces, autonomous regions, and municipalities, and ranking among the world’s leading innovation clusters. The number of patents granted in the region was 355 thousand, up 2.9% from the previous year. The number of effective invention patents per 10,000 people was 74.3, an increase of 15.7%. Among them, the number was 303.9 in Beijing, firmly holding the top position among all provinces, autonomous regions, and municipalities. The efficiency of innovation-driven output continued to improve, and the region’s overall labor productivity was 215 thousand yuan per person, up 4.4% from the previous year.
The technology contract transaction value in the region reached 1.3 trillion yuan, accounting for nearly 20% of the country’s total; Beijing’s innovation radiating and driving role became prominent. Since the beginning of the “14th Five-year Plan” (2021 to 2024), the technology contract transaction value flowing from Beijing to Tianjin and Hebei reached 230.87 billion yuan, nearly double that in the “13th Five-year Plan” period. The number of branches of Zhongguancun enterprises established in Tianjin and Hebei increased from over 3,500 in 2013 to more than 10,000 in 2024. At the 2024 Zhongguancun Forum, Beijing, Tianjin, and Hebei jointly released 72 advanced computing innovation application scenarios, a supply list of over 100 scientific and technological achievements in Beijing, and a list of over 80 technical demands in Tianjin and Hebei, and signed 34 coordinated innovation projects on site.
II. Coordinated development continued to strengthen, with key regions bursting with vitality
In 2024, the region focused on cultivating and expanding emerging industries, accelerating cross-regional industrial cooperation, continuously narrowing the urban-rural development gap, and strengthening the role of the “Two Wings” to the capital city in functional integration and innovative element aggregation. The coordinated development index was 145.2, an increase of 5.4 compared with 2023.
The value added of the high-tech manufacturing industry in Beijing, Tianjin, and Hebei grew by 9.6%, 8.9%, and 11.2%, respectively, compared with the previous year. Industrial cooperation continued to deepen, and the total number of branches established by legal entities above the designated size from Beijing, Tianjin, or Hebei in the other two areas within the region exceeded 10,000, an increase of 4.6% over the previous year. Coordinated urban and rural development was constantly promoted. The urbanization rate in the region was 71.2%, an increase of 0.6 percentage points compared with the previous year, and the urban-rural income ratio decreased to 2.51.
The spatial connection intensity of the city cluster in the region increased by 8.9% compared with the previous year, the core position of “twin cities” of Beijing and Tianjin was further consolidated, and the construction of the “Two Wings” to the capital city was vigorously advanced. Beijing’s sub-center achieved an investment scale of 100 billion yuan for 5 consecutive years, high-end factors and innovative resources gradually gathered, and the number of national high-tech enterprises exceeded 1,200; in the 8 years since the establishment of the Xiong’an New Area, fixed-asset investment has maintained double-digit growth. Around 300 central enterprise institutions have been set up in the new area, 17 academician teams plan to settle in Xiong’an, and more than 15,000 people have applied for the “Xiongcai Card”.
III. Green development was steadily advancing, with constant improvement in the ecological environment
In 2024, the region adhered to joint prevention and control of the ecological environment, working together to create a beautiful and livable BTH region. The green development index was 171.2, an increase of 2.6 compared with 2023.
The average PM2.5 concentrations in Beijing, Tianjin, and Hebei were 30.5 µg/m³, 38.1 µg/m³, and 37.7 µg/m³, respectively, decreasing by 4.7%, 8.0%, and 2.3%, respectively, compared with 2023. The proportion of national surface water assessment sections with water quality at or better than Grade III reached 82.6%, up 2.2 percentage points from the previous year. Coordinated protection of key river basins was strengthened, the horizontal ecological protection compensation mechanism for transboundary rivers was expanded, and comprehensive governance of transboundary rivers such as the Chaobai River, the Luanhe River, and the Yongding River was actively promoted. In the BTH governance area, shallow groundwater and deep groundwater recovered by 3.29 m and 7.67 m, respectively, compared with the end of the “13th Five-year Plan”. The average green space per 10,000 people was 23.8 hectares, an increase of 1.1 hectares from the previous year.
IV. Open development continued to recover, and exports of high-tech products grew rapidly
In 2024, the region steadily expanded institutional opening-up, built high-quality pilot free trade zones, and developed world-class ports at a steady and rapid pace. However, given significant challenges faced by global trade, the actual utilized foreign investment in the region declined, and the open development index was 106.7, down 0.4 from 2023.
The total import and export value of the region was 5.03 trillion yuan, an increase of 0.1% compared with the previous year, maintaining growth for 4 consecutive years; among them, exports in the field of high-tech manufacturing grew rapidly, with exports of automobiles, mobile phones, and wind turbines increasing by 56.4%, 24.7%, and 58.3%, respectively. Port and shipping capabilities were significantly improved, and the port cluster continued to unleash its hub functions. The international cargo throughput of the region was 820 million tons, an increase of 10.6% over the previous year, and 12 new direct RCEP (Regional Comprehensive Economic Partnership) maritime container liner routes were newly added. Passenger flows recovered rapidly, as the international flight passenger throughput reached 17,633 thousand person-times, achieving a multiple-fold increase. Significant progress was made in the operation of China-Europe Railway Express and China-Central Asia Railway Express. Beijing launched its first China-Central Asia Railway Express, and the China-Europe Railway Express and China-Central Asia Railway Express departing from Shijiazhuang, Hebei, increased by more than 1.6 times compared with 2023. Nonetheless, the foreign investment sector declined due to changes in the external environment, leading to a drop in the actual utilized foreign investment in the region.
V. The benefits of shared development were significant, and people’s well-being continued to improve
In 2024, the region further promoted the joint construction and sharing of infrastructure and public services, accelerated the development of an interconnected transportation network, and constantly strengthened and improved public services and social security. The shared development index was 152.7, an increase of 2.7 compared with 2023.
As of 2024, the operating mileage of railways and expressways in the region both exceeded 11 thousand kilometers. Beijing, Tianjin, and Xiong’an are accessible within half an hour, and a 1 to 1.5-hour transportation circle connecting major cities in the region has taken shape. A total of 11 main lines and 39 sub-lines have been opened for the Beijing-Tianjin-Hebei customized commuter express buses, with an average daily passenger volume of over 7,450 person-times; among them, 11 customized commuter express bus routes have been opened from Sanhe, Hebei, to Beijing, with an average daily passenger volume of over 6,000 person-times.
In terms of general public budget expenditure in the region, per capita expenditure on education, social security, employment, and healthcare was 8,159.5 yuan, an increase of 0.6% over the previous year. The per capita disposable income of residents in Beijing, Tianjin, and Hebei was 85,415 yuan, 53,581 yuan, and 34,665 yuan, respectively, a nominal increase of 4.5%, 4.5%, and 5.4% over the previous year, respectively. The number of people covered by basic endowment insurance in the region was 86,361 thousand, an increase of 747 thousand compared with the previous year.
Note:
[1] According to the final verified data of the regional GDP in 2023, the R&D expenditure intensity in 2023 has been revised to 4.04%.
Figure
BTH Coordinated Development Index from 2014 to 2024
Annotations:
Evaluation Indicator System and Calculation Method for the BTH Coordinated Development Index
1. Evaluation Indicator System for the BTH Coordinated Development Index
|
Tier-1 indicator |
Tier-2 indicator |
Tier-3 indicator |
Weight |
|
Innovative development |
Innovation investment |
Full-time equivalent of R&D personnel per 10,000 permanent residents |
2.50 |
|
Overall social R&D expenditure intensity |
2.50 | ||
|
Innovation output |
Number of valid invention patents per 10,000 permanent residents |
2.50 | |
|
Proportion of technology contract transaction value in China |
2.50 | ||
|
Innovation efficiency |
Number of patents granted per 100 million yuan of R&D expenditure |
2.50 | |
|
Overall labor productivity |
2.50 | ||
|
Coordinated innovation |
Technology contract transaction value among Beijing, Tianjin, and Hebei |
2.50 | |
|
Number of patents under regional cooperation and transfer |
2.50 | ||
|
Coordinated development |
Regional coordination |
Proportion of regional GDP in the country |
1.50 |
|
Per capita regional GDP gap at the provincial (municipal) level |
1.50 | ||
|
Spatial connection intensity of the city cluster |
1.50 | ||
|
Development of the “Two Wings” to the capital city |
1.50 | ||
|
Urban-rural coordination |
Ratio of per capita disposable income between urban and rural residents |
2 | |
|
Urbanization rate of permanent residents |
2 | ||
|
Industrial development and cooperation |
Proportion of the output value of strategic emerging industries in industries above the designated size |
1.50 | |
|
Proportion of revenue from high-tech service industries above the designated size |
1.50 | ||
|
Total number of branches established by legal entities above the designated size from Beijing, Tianjin, or Hebei in the other two areas within the region |
1.50 | ||
|
Number of government service items handled with “same standards for same service” within the region |
1.50 | ||
|
Element flow |
Inter-provincial railway freight volume within the region |
2 | |
|
Inter-provincial railway passenger volume within the region and the number of commuters around Beijing |
2 | ||
|
Green development |
Green investment |
Proportion of energy-saving and environmental protection expenditure in the general public budget expenditure |
3 |
|
Green production |
Energy consumption per 10,000 yuan of regional GDP |
3 | |
|
Water consumption per 10,000 yuan of regional GDP |
3 | ||
|
Output value of the energy-saving and environmental protection industry |
2 | ||
|
Ecological environment |
Average PM2.5concentration |
3 | |
|
Per capita green space |
3 | ||
|
Proportion of national surface water assessment sections with water quality at or better than Grade III in the region |
3 | ||
|
Open development |
Two-way investment |
Actual utilized foreign investment |
3 |
|
Non-financial direct investment abroad |
3.5 | ||
|
Trade opening up |
Total imports and exports of goods |
3 | |
|
Proportion of high-tech product exports in total exports |
3.5 | ||
|
World-class port construction |
International cargo throughput of ports in the region |
2.35 | |
|
International flight passenger throughput in the region |
2.3 | ||
|
Number of China-Europe Railway Express and China-Central Asia Railway Express in the region |
2.35 | ||
|
Shared development |
Joint infrastructure construction |
Proportion of infrastructure investment in fixed-asset investment |
2 |
|
Expressway density |
2 | ||
|
Railway network density |
2 | ||
|
Shared public service |
Per capita expenditure on education, social security, employment, and healthcare |
1 | |
|
Number of health professionals per 1,000 permanent residents |
1 | ||
|
Number of out-of-area medical visits by insured people within the region |
2 | ||
|
Ratio of full-time teachers to students in primary and secondary schools |
1 | ||
|
Number of university alliances in the region |
1.50 | ||
|
Number of elderly with Beijing household registration received by nursing institutions in Tianjin and Hebei |
2 | ||
|
Resident life and social security |
Per capita disposable income of residents |
2 | |
|
Number of employed permanent population |
2 | ||
|
Number of people covered by basic endowment insurance in the region |
1.50 |
2. Definitions of Key Indicators
Research and Development (R&D) expenditure refers to all expenses actually incurred for carrying out R&D activities. R&D refers to creative and systematic work performed to increase knowledge (including knowledge concerning humanity, culture, and society) and to design new applications of existing knowledge, including three types: basic research, applied research, and experimental development.
Overall social R&D expenditure intensity refers to the ratio of R&D expenditure to GDP.
Technology contract transaction value refers to the transaction value of contracts for technology development, technology transfer, technology consulting, and technology services in this region during the reporting period.
Overall labor productivity refers to the ratio of regional GDP to the average employed population, with the growth rate calculated at current prices.
Number of patents under regional cooperation and transfer refers to the number of patents under regional cooperation and the number of times patents are licensed or transferred within the region.
Spatial connection intensity of the city cluster is measured using a gravity model, with the formula as ![]() . Rij represents the intensity of economic connection between city i and city j; Dij is the highway operating distance between city i and city j; Pi and Pj represent the resident populations of city i and city j, respectively; and Vi and Vj represent the regional GDP of city i and city j, respectively.
. Rij represents the intensity of economic connection between city i and city j; Dij is the highway operating distance between city i and city j; Pi and Pj represent the resident populations of city i and city j, respectively; and Vi and Vj represent the regional GDP of city i and city j, respectively.
Development of the “Two Wings” to the capital city refers to the development of Beijing’s sub-center and Xiong’an New Area. It is a composite index calculated from the regional GDP and fixed asset investment indicators of Tongzhou District and Xiong’an New Area.
Per capita disposable income of residents refers to the total amount residents can use for final consumption expenditure and savings, that is, the income that residents can use for free disposal. It includes both cash income and in-kind income.
Proportion of revenue from high-tech service industries above the designated size refers to the ratio of the total revenue from high-tech service industries above the designated size within the region to the total revenue from service industries above the designated size.
Total number of branches established by legal entities above the designated size from Beijing, Tianjin, or Hebei in the other two areas within the region refers to the total number of branches established by Beijing in Tianjin and Hebei, by Tianjin in Beijing and Hebei, and by Hebei in Beijing and Tianjin. Branches refer to industrial activity units under legal entities above the designated size (branches, dispatched agencies, subsidiaries, divisions, sub-factories, outlets, etc.).
Average PM2.5 concentration refers to the arithmetic mean of daily average concentrations of fine particulate matter (PM2.5) within a calendar year.
Actual utilized foreign investment refers to the actual amount of foreign investment executed under the contract, including the paid-in registered capital and operating funds by overseas investors, as well as the actual transaction consideration paid for the transfer of equity from domestic investors.
Total imports and exports of goods refer to the total amount of goods that actually enter and exit China’s customs territory and result in a change in the stock of goods within China.
Health professionals refer to health personnel such as practicing physicians, assistant practicing physicians, registered nurses, pharmacists (assistant pharmacists), laboratory technicians (junior technicians), imaging technicians, health supervisors, as well as doctors (assistant doctors), pharmacists (assistant pharmacists), nurse practitioners (nurses), and technicians (junior technicians) on probation. They do not include personnel engaged in management work (such as hospital president, vice president, Party secretaries, etc.).
Number of people covered by basic endowment insurance refers to the sum of the number of people covered by basic endowment insurance for urban employees and the number of people covered by endowment insurance for urban and rural residents.
3. Calculation Method
The year 2014 is taken as the baseline, and the index value is set at 100. The trend of changes in the indicator values of the 5 sub-fields, namely, innovative development, coordinated development, green development, open development, and shared development, is tracked. 5 sub-indices of innovative development, coordinated development, green development, open development, and shared development are calculated separately, and then combined into a composite index for the BTH coordinated development. For some indicators with a starting year of statistics later than 2014, the data from the first year in which the indicator is available are used to fill in earlier missing values.
(1) Determination of weight
First, equal weighting is adopted for tier-1 indicators in the indicator system, with 20 points for each.
Second, tier-3 indicators are assigned weights through expert scoring, and the final weights are determined through comprehensive analysis and assessment.
(2) Standardization
To ensure the additivity of indicators at each level, each indicator value is standardized first. The 2014 value of the indicator is taken as the baseline 1, and each indicator is standardized according to the differences between positive and negative indicators. The processing method is as follows: yt is the calculated value of an indicator, y2014 is the calculated value of an indicator in 2014, and pt is the standardized indicator value. Where, t = 2014, ..., 2024.
Standardization of positive indicator:
![]()
Standardization of negative indicator:
![]()
(3) Index synthesis
The index weighting method is used for comprehensive evaluation to obtain the index values of indicators at each level. The basic formula for the weighted analysis method of the index is as follows:
Composite index S =ΣPi * Wi
Pi is the evaluation value obtained after unitless processing. The score of a sub-indicator can be obtained by multiplying the value by the corresponding weight Wi. Wi is the weight value of the i-th sub-indicator; after calculating the scores of all sub-indicators, they are summed to obtain the composite index of indicators at each level.