Yangtze River Delta Development Index Steadily Increases in 2024 Stable and Sustained High-Quality Development Achieved in the Region
Statistics & Monitoring Office for the Integrated Development of the Yangtze River Delta
In 2024, the Yangtze River Delta thoroughly studied and implemented the guiding principles of the important speeches delivered by General Secretary Xi Jinping at the Symposium on Further Promoting the Integrated Development of the Yangtze River Delta. Its role as a dynamic growth engine and a model zone of high-quality development was increasingly consolidated. With cross-regional coordination in scientific and technological innovation as well as industrial innovation continuously deepened, new strides made toward high-standard opening-up, fresh progress achieved in the joint protection and governance of the ecological environment, and people’s well-being taken to a new height, it continued to play a leading and demonstration role in Chinese modernization. Calculation results show that the Yangtze River Delta Development Index was 135.0 in 2024 (with 2015 as the baseline), up by 2.6 from 2023. Since the integrated development of the Yangtze River Delta was elevated to a national strategy in 2018, the index has increased by an average of 3.3 annually. Specifically, the sub-indices for Collaborative Innovation and Joint Environmental Protection rose rapidly, reaching 160.6 and 163.8 in 2024, up by 8.2 and 6.3 from 2023, respectively. Those for Demonstration & Leadership, Coordinated Development, and Shared Public Services rose steadily, standing at 129.8, 131.0, and 130.4, an average annual increase of 2.3, 4.4, and 3.1 from 2018, respectively. The Win-Win Opening-up sub-index showed fluctuations, recording 106.6 in 2024.
I. With high-quality economic development, the region manifested a strong demonstration and leading role
The Demonstration & Leadership sub-index of the Yangtze River Delta has been on the rise year by year, reaching 129.8 in 2024, an increase of 2.4 from 2023, and an average annual increase of 2.3 compared with 2018. In 2024, the region achieved high-quality economic development, giving full play to its demonstration and leading role.The regional economic scale continued to expand, with the regional GDP reaching 33.17 trillion yuan, 1.5 times that of 2018 (calculated at current prices), and representing 24.7% of the national total, up by 0.1 percentage points from 2023. The digital economy was thriving, with the added value of information transmission, software, and information technology services hitting 1.88 trillion yuan, 2.3 times that of 2018, and nearly 30% of the national total. Efforts have been made to foster new quality productive forces. Among the industrial enterprises above the designated size, strategic emerging industries kept expanding, with their share of the region’s total industrial output value rising year by year.
II. With further improvements in innovation origination capacity, collaborative innovation efforts delivered notable results
The Collaborative Innovation sub-index of the Yangtze River Delta rose significantly, reaching 160.6 in 2024, an increase of 8.2 from 2023 and an average annual increase of 6.4 compared with 2018. In 2024, with accelerated R&D investment, the region saw continuously enhanced innovation origination capacity, which delivered notable results. Input in scientific and technological innovation increased continuously. Regional investment in research and experiment reached 1.12 trillion yuan, increasing by 10.5% from 2023, accounting for 30.9% of the national total; regional R&D intensity reached 3.39%. Scientific and technological innovation yielded fruitful results. The region recorded nearly 300,000 new invention patents, and the number of new invention patents per 10,000 people exceeded 12, 1.6 times that of 2018. The number of patent transfers within the region exceeded 16,000, an increase of 19.9% from 2023. The innovation origination capacity was further enhanced. The five national laboratories played a prominent role as “the master platform and the chain leader”, undertaking major tasks such as national major science and technology projects and the establishment of platform facilities. The Yangtze River Delta Science and Technology Resource Sharing Service Platform has pooled together 46,000 sets of large-scale scientific instruments, with more than 530 sets newly added in 2024. The total value of the instruments exceeded 60 billion yuan.
III. Enhanced connectivity drove steady progress in coordinated development
The Coordinated Development sub-index of the Yangtze River Delta remained stable, standing at 131.0 in 2024, flat with 2023, an average annual increase of 4.4 compared with 2018. In 2024, the level of infrastructure connectivity across the region continued to improve, steadily advancing coordinated development.Railway construction in the region was accelerated, with Xuancheng-Jixi High-speed Railway, Hangzhou-Wenzhou High-speed Railway, and Shanghai-Suzhou-Huzhou High-speed Railway built and opened to traffic. As at the end of 2024, the total railway operating mileage in the region exceeded 15,000 km, an increase of 43.6% from the end of 2018. Among them, the total mileage of high-speed railway was nearly 7,800 km, representing more than half of the total for the first time. The connectivity of the highway network was further deepened. As at the end of 2024, the mileage of expressways in the region was about 18,000 km, an increase of 20.8% from the end of 2018, with a density of 4.98 km per 100 km2.Steady progress was made in regional coordinated development. In 2024, the inter-provincial gap in per capita disposable income of residents within the region narrowed from 2.68:1 in 2018 to 2.40:1. The urban-rural income ratio in Shanghai, Jiangsu, Zhejiang, and Anhui continued to decline, down from 2.08, 2.07, 1.86, and 2.24 in 2023 to 2.04, 2.04, 1.83, and 2.20, respectively.
IV. Better ecological and environmental quality demonstrated remarkable achievements in joint environmental protection
The Joint Environmental Protection sub-index of the region recorded the fastest growth among all sub-indices, reaching 163.8 in 2024, an increase of 6.3 from 2023 and an average annual growth of 5.6 compared with 2018. In 2024, the region strengthened the joint protection and governance of the ecological environment, which yielded notable results as evidenced by a further improvement in ecological and environmental quality. Regional air quality continued to improve. The average proportion of days with good ambient air quality (based on the Air Quality Index, AQI) of 41 cities in the region was 84.5%, up by 0.8 percentage points from 2023. The average concentration of PM2.5 was 32µg/m³, largely unchanged from 2023. Supervision over key cross-border water bodies was further intensified. Jiangsu, Zhejiang, Anhui, and Shanghai worked together to protect and restore the ecological environment of the Yangtze River, and continuously deepened the comprehensive governance of the Taihu Lake. The overall water quality of the Taihu Lake reached Grade III, the best in 30 years. The Taipu River (including the “Watertown Living Room”) became the first cross-provincial excellent case for the beautiful river/lake initiative. The share of quality water bodies among 594 national surface water assessment sections was 94.3%, increasing by 0.9 percentage points year on year, the best in history. Progress was achieved in the green and low-carbon transition. The proportion of renewable energy in the region’s total energy consumption rose by 1.8 percentage points from 2023.
V. Export-oriented economy exhibited resilience, and win-win opening-up advanced steadily
The Win-Win Opening-Up sub-index of the region experienced fluctuations, standing at 106.6 in 2024. In 2024, as the region remained committed to high-standard opening-up, the export-oriented economy demonstrated strong resilience, and win-win opening-up advanced steadily. The scale of foreign trade hit a record high. The total imports and exports of goods in the region exceeded 16 trillion yuan, accounting for 36.5% of the national total. Specifically, the exports of goods reached nearly 10 trillion yuan, comprising 39.1% of the national total export. The actual utilized foreign investment decreased by 23.3% year on year, but its proportion to the national total rose from 43.9% in 2023 to 46.3% in 2024. Remarkable progress has been made in the construction of a world-class port cluster. The cargo throughput of coastal ports in the region exceeded 3 billion tons, representing 27.2% of the national total. Among these ports, Ningbo Zhoushan Port recorded a cargo throughput of 1.38 billion tons, ranking first in the world for 16 consecutive years. The container throughput of coastal ports exceeded 100 million TEUs, accounting for 35.8% of the national total. In particular, the container throughput of Shanghai Port reached 51.506 million TEUs, ranking first worldwide for 15 consecutive years. The China International Import Expo (CIIE) continued to serve as a high-level platform for opening up. The 7th CIIE in 2024 saw a record-breaking exhibition scale, drawing 3,496 exhibitors from 129 countries and regions, among which there were 297 Fortune Global 500 companies and industry leaders. The annualized intended transaction value exceeded 80 billion dollars, 34% of which was contributed by the Yangtze River Delta region.
VI. Convenient and shared access to public services was expanded to improve people’s well-being
The Shared Public Services sub-index of the region maintained steady growth, reaching 130.4 in 2024, an increase of 0.9 from 2023 and an average annual rise of 3.1 from 2018. In 2024, the region continued to improve the accessibility of public services, further enhancing people’s sense of gain. People’s well-being kept improving. The per capita disposable income of residents in the region reached 57,137 yuan, a nominal year-on-year increase of 5.2%. The per capita public fiscal expenditure reached 19.6 thousand yuan, 1.3 times that of 2018. Medical services continued to advance. As at the end of 2024, the number of beds in medical and health institutions across the region was 1.6525 million, 361.8 thousand more than that at the end of 2018, and the number of beds per 1,000 people was nearly 7. The coverage of cross-provincial settlement of medical expenses kept expanding, enabling direct cross-provincial expense settlement for general outpatient services, inpatient treatment, outpatient treatment for chronic and special diseases, and drug purchases at pharmacies. Direct cross-provincial settlement of medical expenses was available at 25 thousand medical institutions in 41 cities across the region. Public services became more accessible. Under the initiative of “one-stop government services”, cross-regional and inter-departmental services became more coordinated and convenient. As at the end of 2024, 40 categories of electronic certificates had been mutually recognized among Jiangsu, Zhejiang, Anhui, and Shanghai, and a total of 179 government service items or application scenarios had been implemented, enabling residents in the region to enjoy one-stop online services, cross-regional processing, and have services handled by nearby service points.
Figure (Table)
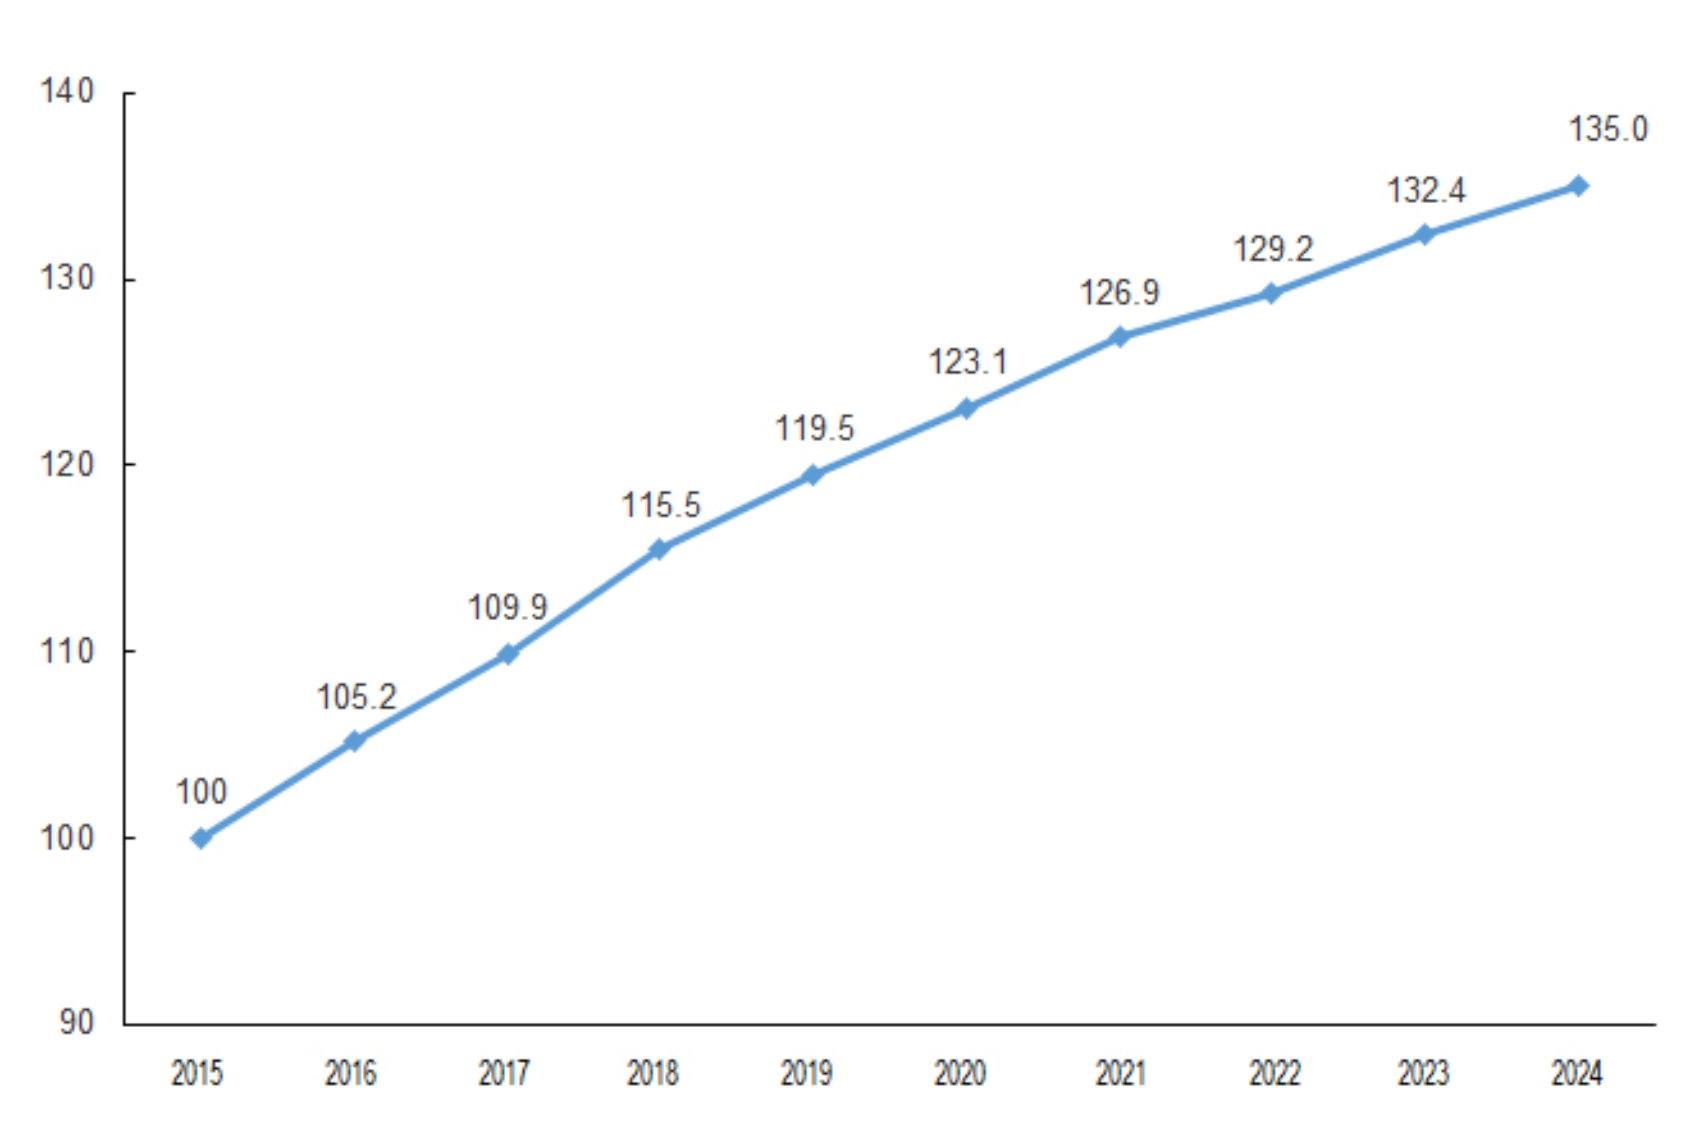
Figure: Yangtze River Delta Development Index from 2015 to 2024
(taking 2015 as the baseline, which equals 100)
Table: Yangtze River Delta Development Index and Sub-indices
|
Classification |
Index | |||||
|
2015 |
2018 |
2021 |
2022 |
2023 |
2024 | |
|
Composite index |
100.0 |
115.5 |
126.9 |
129.2 |
132.4 |
135.0 |
|
Demonstration & Leadership |
100.0 |
115.8 |
123.2 |
124.9 |
127.4 |
129.8 |
|
Collaborative Innovation |
100.0 |
122.5 |
145.2 |
148.0 |
152.4 |
160.6 |
|
Coordinated Development |
100.0 |
104.8 |
123.7 |
128.9 |
131.0 |
131.0 |
|
Joint Environmental Protection |
100.0 |
130.3 |
141.7 |
149.4 |
157.5 |
163.8 |
|
Win-Win Opening-up |
100.0 |
107.3 |
110.0 |
108.0 |
108.2 |
106.6 |
|
Shared Public Services |
100.0 |
111.6 |
126.0 |
126.4 |
129.5 |
130.4 |
Note: In accordance with China’s national accounts data revision policy and international practices, after the fifth national economic census, the National Bureau of Statistics organized statistics bureaus of all provinces (autonomous regions and municipalities directly under the Central Government) to conduct a systematic revision of the historical regional GDP data. The Yangtze River Delta Development Index and its sub-indices were recalculated based on the revised data.
Annotations:
Indicator System and Calculation Method for the Yangtze River Delta Development Index
I. Indicator System
The Yangtze River Delta Development Index comprises six tier-1 indicators, 20 tier-2 indicators, and 49 tier-3 indicators. Specifically, five tier-1 indicators, i.e., Collaborative Innovation, Coordinated Development, Joint Environmental Protection, Win-Win Opening-up, and Shared Public Services, are established in accordance with the “fundamental principles of adhering to collaborative innovation, coordinated development, joint environmental protection, win-win opening-up, and shared public services” as specified in the Outline of the Integrated Regional Development of the Yangtze River Delta. In addition, a tier-1 indicator of the demonstration & leadership is established, incorporating the key indicators that best reflect the high-quality integrated development of the Yangtze River Delta across the above five fields.
Indicator System for the Yangtze River Delta Development Index
|
Tier-1 indicator |
Tier-2 indicator |
Tier-3 indicator | |||
|
No. |
Indicator name |
Unit |
Weight | ||
|
Demonstration & Leadership |
Development quality and efficiency |
1 |
GDP |
100 million yuan |
2.67% |
|
2 |
Aggregate labor productivity |
10,000 yuan per person |
2.67% | ||
|
3 |
Proportion of the Yangtze River Delta’s fiscal revenue in the national total |
% |
2.67% | ||
|
4 |
Per capita disposable income of residents |
yuan |
2.67% | ||
|
5 |
Surveyed urban unemployment rate |
% |
2.67% | ||
|
Growth momentum |
6 |
Proportion of the total imports and exports of customs districts in the Yangtze River Delta in the national total |
% |
2.67% | |
|
7 |
Proportion of private investment in total fixed asset investment |
% |
2.67% | ||
|
8 |
Proportion of operating income in the manufacturing sector of the three leading industries in that of industrial enterprises above the designated size |
% |
2.67% | ||
|
9 |
Proportion of total R&D expenditure in regional GDP |
% |
2.68% | ||
|
10 |
Development level of Digital China |
- |
2.67% | ||
|
Sustainable development |
11 |
Energy consumption per unit of regional GDP |
tce per 10,000 yuan |
2.67% | |
|
12 |
Good ambient air quality rate |
% |
2.67% | ||
|
13 |
Proportion of blue and green spaces in the demonstration zone for integrated ecological and green development of the Yangtze River Delta |
% |
2.67% | ||
|
14 |
Business facilitation level |
- |
2.67% | ||
|
15 |
Number of deaths from production safety accidents per 100 million yuan of GDP |
persons per 100 million yuan |
2.67% | ||
|
Collaborative Innovation |
Innovation-Driven Development |
16 |
Number of new invention patents per 10,000 persons |
Patent |
2.00% |
|
17 |
Proportion of the total output value of strategic emerging industries in the total industrial output value |
% |
2.00% | ||
|
Innovation outcomes |
18 |
Full-time equivalent of R&D personnel per 10,000 population |
Person-year |
2.00% | |
|
19 |
Added value of the software and information service industry |
100 million yuan |
2.00% | ||
|
Innovation collaboration |
20 |
Proportion of the transaction value of regional technology contracts in the total regional transaction value |
% |
2.00% | |
|
21 |
Number of patent transfers in the region |
10,000 patents |
2.00% | ||
|
Coordinated Development |
Industrial coordination |
22 |
Regional coordination level of the industrial structure of the manufacturing industry |
- |
1.71% |
|
23 |
Regional coordination level of the industrial structure of producer services |
- |
1.71% | ||
|
Market coordination |
24 |
Number of co-developed “regional standards for the Yangtze River Delta” |
Standard |
1.71% | |
|
Infrastructure coordination |
25 |
Coordination level of railway density |
- |
1.71% | |
|
26 |
Coordination level of expressway density |
- |
1.71% | ||
|
Urban-rural coordination |
27 |
Coordination level of the ratio of urban and rural residents’ income |
- |
1.71% | |
|
Factor coordination |
28 |
Coordination level of aggregate labor productivity |
- |
1.71% | |
|
Joint Environmental Protection |
Joint protection of the blue sky |
29 |
Coordination level of the average concentration of PM2.5 |
- |
2.00% |
|
30 |
Emissions of major industrial air pollutants |
10,000 tons |
2.00% | ||
|
Joint governance of clear waters |
31 |
Proportion of surface water bodies reaching or better than Grade III |
% |
2.00% | |
|
32 |
Emissions of major industrial water pollutants |
10,000 tons |
2.00% | ||
|
Resources intensification |
33 |
Construction land use per unit of regional GDP |
Hectares per 100 million yuan |
2.00% | |
|
34 |
Proportion of renewable energy in the total energy consumption |
% |
2.00% | ||
|
Win-Win Opening-up |
International trade |
35 |
Proportion of the total imports and exports of goods in the national total |
% |
1.71% |
|
36 |
Proportion of service trade imports and exports in the national total |
% |
1.71% | ||
|
37 |
Proportion of the total imports and exports of free trade zones in the Yangtze River Delta in that of the national free trade zones |
% |
1.71% | ||
|
International investment |
38 |
Per capita foreign direct investment (FDI) |
USD |
1.71% | |
|
39 |
Actual utilized foreign investment |
100 million USD |
1.71% | ||
|
Opening to internal sectors |
40 |
Inter-regional railway freight traffic in the Yangtze River Delta |
10,000 tons |
1.71% | |
|
41 |
Number of corporate mergers and acquisitions (M&A) in the Yangtze River Delta |
M&A |
1.71% | ||
|
Shared Public Services |
Public services |
42 |
Coordination level of the number of college and university students per 10,000 permanent residents |
- |
1.50% |
|
43 |
Coordination level of public library collections per 10,000 persons |
- |
1.50% | ||
|
44 |
Number of beds in Grade A tertiary medical institutions per 1,000 persons |
Bed |
1.50% | ||
|
45 |
Direct settlement amount for insured patients’ cross-provincial medical treatment |
100 million yuan |
1.50% | ||
|
Social security |
46 |
Per capita general public budget expenditure |
10,000 yuan per capita |
1.50% | |
|
47 |
Coordination level of beds in elderly welfare institutions per 1,000 elderly persons |
- |
1.50% | ||
|
Quality of life |
48 |
Life expectancy |
Years old |
1.50% | |
|
49 |
Engel’s coefficient |
% |
1.50% | ||
|
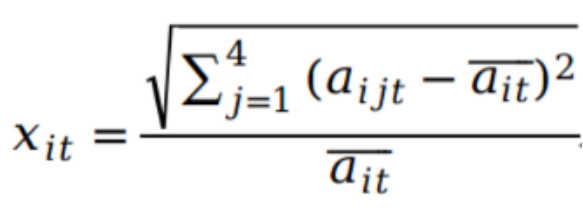
Note: The coordination level of unitless indicators is measured by the standard deviation, while that of other indicators is calculated using the Coefficient of Variation (CV), which is the ratio of the standard deviation to the mean value. The calculation formula for the CV is as follows:
aijtdenotes the basic data of the basic indicator i in the region j in year t, and | |||||
II. Definitions of Key Indicators
GRP refers to the final output of production activities by all resident units in a region during a given period. Data source: Statistical departments.
Surveyed urban unemployment rate refers to the percentage of the urban unemployed population in the total of the urban employed and unemployed population. Data source: Statistical departments.
Business facilitation level refers to the comprehensive evaluation of the convenience of the business environment. Data source: Development and reform departments.
Number of deaths from production safety accidents per 100 million yuan of GDP refers to the actual deaths in production safety accidents corresponding to every 100 million yuan of regional GDP. Data source: Emergency management departments.
Proportion of private investment in total fixed asset investment refers to the ratio of private fixed asset investment in total fixed asset investment. Data source: Statistical departments.
Actual utilized foreign investment refers to the actual execution amount of contracted foreign investment, including the paid-in registered capital and operating funds by overseas investors, as well as the actual transaction consideration paid for the transfer of equity from domestic investors. Data source: Commerce departments.
Number of co-developed “regional standards for the Yangtze River Delta” refers to the number of unified regional standards jointly established by Shanghai, Jiangsu, Zhejiang, and Anhui. Data source: Market supervision and management departments.
Energy consumption per unit of regional GDP refers to the amount of energy consumed for the production of one unit of regional GDP in a region during a given period. Data source: Statistical departments.
Proportion of renewable energy in the total energy consumption refers to the ratio of renewable energy (including wind, solar, hydro, biomass, and geothermal energy) in total energy consumption. Data source: Statistical departments.
Average concentration of PM2.5 refers to the arithmetic mean of the daily average concentrations of fine particulate matter (PM2.5) in a calendar year. Data source: Ecology and environment departments.
Proportion of surface water bodies reaching or better than Grade III refers to the percentage of surface water sections that meet or exceed Grade III water quality standards. Data source: Ecology and environment departments.
Railway density refers to the ratio of the total length of railway to the land area. Data source: Railway management departments.
Expressway density refers to the ratio of the total length of expressways to the land area. Data source: Transportation departments.
Number of college and university students per 10,000 permanent residents refers to the number of students enrolled in colleges and universities per 10,000 permanent residents. Data source: Education departments.
Public library collections per 10,000 persons refers to the total collections of public libraries per 10,000 permanent residents. Data source: Culture and tourism departments.
Number of beds in Grade A tertiary medical institutions per 1,000 persons refers to the number of beds in Grade A tertiary medical institutions per 1,000 permanent residents. Data source: Healthcare departments.
Direct settlement amount for insured patients’ cross-provincial medical treatment refers to the total medical expenses incurred when insured persons under basic medical insurance receive inpatient treatment in other provinces within the Yangtze River Delta region, where they only need to pay the personal portion of hospitalization expenses as prescribed, and the rest is settled between the treating hospital and the local medical insurance agency. Data source: Medical insurance departments.
Development level of Digital China refers to the development level of digital infrastructure, digital technology innovation, digital economy, digital government, digital society, cybersecurity, and the digital development environment. Data source: Cyberspace Administration of China.
Proportion of blue and green spaces in the demonstration zone for integrated ecological and green development of the Yangtze River Delta refers to the ratio of green space and water area in the demonstration zone for integrated ecological and green development to the total area in the region. Data source: Natural resources departments.
Number of patent transfers within the Yangtze River Delta refers to the number of invention patent transfers and patent license authorization among Jiangsu, Zhejiang, Anhui, and Shanghai in the region. Data source: Research findings of the Shanghai Institute for Science of Science.
Inter-regional railway freight traffic in the Yangtze River Delta refers to the total volume of inter-regional railway cargo traffic among Jiangsu, Zhejiang, Anhui, and Shanghai in the region. Data source: Railway management departments.
Number of corporate mergers and acquisitions (M&A) in the Yangtze River Delta refers to the total number of M&As initiated by companies in Jiangsu, Zhejiang, Anhui, and Shanghai targeting other companies within the region. Data source: Research findings of the Shanghai Academy of Social Sciences.
III. Calculation Method
The Yangtze River Delta Development Index adopts a multi-indicator composite calculation method.
Step 1: Standardize the tier-3 indicators using 2015 as the baseline, with a base value of 100, to obtain individual indices. The specific processing methods are as follows:
Standardization of positive indicators:
![]()
Standardization of negative indicators:
![]()
Step 2: Determine weights by combining the expert weighting method and the equal weighting method. Among the tier-1 indicators, the weight of “demonstration & leadership” is 40%, and the weights of the remaining five tier-1 indicators are 12% each; all the tier-3 indicators under each tier-1 indicator are assigned equal weights.
Step 3: Index synthesis. Weight and aggregate the individual indices of tier-3 indicators to obtain the composite Yangtze River Delta Development Index, with the calculation formula as follows:
![]()
Where: Yit is the individual index of the i-th tier-3 indicator in year t; wi is the weight of the i-th tier-3 indicator; St is the total index in year t.
Sub-indices of tier-1 indicators are obtained by averaging the individual indices of their respective tier-3 indicators.