China’s Innovation Index in 2024
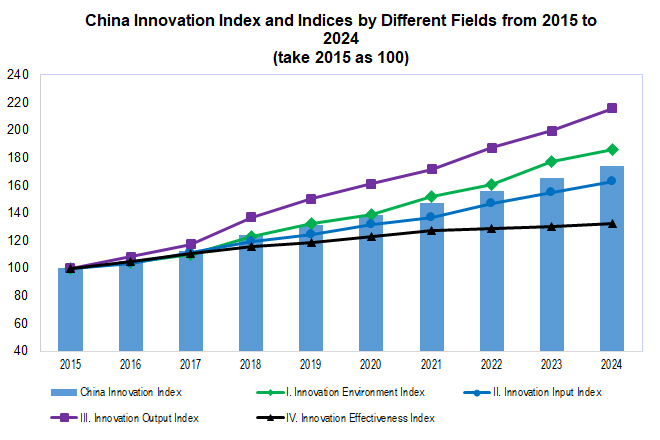
According to the calculation of the research group of Department of Social, Science and Technology, and Cultural Statistics of National Bureau of Statistics on China’s innovation index, the innovation index of China was 174.2 in 2024 (take 2015 as 100), an increase of 5.3% over the previous year[1]. By field, the innovation environment index, innovation input index, innovation output index and innovation effectiveness index were 186.0, 162.6, 215.8, and 132.4 respectively, up by 4.9%, 5.1%, 8.1%, and 1.9% over the previous year. The results indicated that China’s innovation index maintained a steady growth in 2024. The scientific and technological innovation capability kept advancing, innovation output showed a relatively rapid increase, and new development drivers continuously grew, providing solid support for high-quality economic development.
I. Innovation Environment Index. In 2024, China’s innovation environment index was 186.0, an increase of 4.9% over the previous year. By sub-index, all five sub-indices in this field achieved growth. Among them, the index of the proportion of science and engineering graduates in the relevant age cohort increased by 10.8% over the previous year, maintaining a double-digit growth for three consecutive years; the per capita GDP index increased by 5.1% over the previous year; the index of the proportion of enterprises enjoying tax exemption and deduction, the index of the number of people with college degree or above per 10,000 employed persons, and the index of the proportion of science and technology allocation in financial allocation increased by 3.8%, 3.5%, and 1.6% respectively over the previous year.
II. Innovation Input Index. In 2024, China’s innovation input index was 162.6, an increase of 5.1% over the previous year. By sub-index, all four sub-indices in this field achieved growth. Among them, the index of per capita funding for basic researchers grew relatively fast, up by 6.6% over the previous year; the index of the proportion of enterprise R&D funds in business revenue, the index of the full-time equivalent of R&D personnel per 10,000 people, and the index of the proportion of R&D funds in GDP increased by 4.7%, 4.6%, and 4.5% respectively over the previous year.
III. Innovation Output Index. In 2024, China’s innovation output index was 215.8, an increase of 8.1% over the previous year. By sub-index, all four sub-indices in this field achieved growth. Among them, the index of the number of high-value invention patents owned per 10,000 R&D personnel increased by 12.5% over the previous year, maintaining a double-digit growth for three consecutive years; the index of the proportion of enterprises with registered trademarks increased by 8.4% over the previous year; the index of the number of scientific and technological papers per 10,000 people and the index of the average contract value for technology market transactions both increased by 5.8% over the previous year.
IV. Innovation Effectiveness Index. In 2024, China’s innovation effectiveness index was 132.4, an increase of 1.9% over the previous year. By sub-index, among the five sub-indices in this field, three increased, one remained flat, and one decreased. Among them, the overall labor productivity index grew relatively fast, up by 4.9% over the previous year; the index of the proportion of added value from the “three new” economy in GDP and the index of the proportion of new product sales revenue in business revenue increased by 4.3% and 1.2% respectively over the previous year; the index of the proportion of added value from patent-intensive industries in GDP remained flat over the previous year; the index of the proportion of high-tech product export value in goods export value decreased by 1.0% over the previous year, with the decline rate narrowing by 5.7 percentage points.
China’s Innovation Index
|
(take 2015 as 100) | |||||
|
|
2015 |
2021 |
2022 |
2023 |
2024 |
|
China Innovation Index |
100 |
147.1 |
155.9 |
165.4 |
174.2 |
|
I. Innovation Environment Index |
100 |
151.9 |
160.6 |
177.3 |
186.0 |
|
1. Index of the number of people with college degree or above per 10,000 employed persons |
100 |
123.1 |
128.2 |
136.7 |
141.5 |
|
2. Per capita GDP index |
100 |
140.6 |
145.1 |
153.2 |
161.0 |
|
3.Index of the proportion of science and engineering graduatesin the relevant agecohort |
100 |
145.1 |
161.7 |
186.0 |
206.1 |
|
4. Index of the proportion of science and technology appropriation in financial appropriation |
100 |
110.0 |
107.2 |
109.7 |
111.4 |
|
5. Index of the proportion of enterprises enjoying tax exemption and deduction |
100 |
294.4 |
332.4 |
412.2 |
427.9 |
|
II. Innovation Input Index |
100 |
137.1 |
146.7 |
154.7 |
162.6 |
|
1. Index of the full-time equivalent of R&D personnel per 10,000 people |
100 |
148.9 |
165.6 |
189.0 |
197.8 |
|
2. Index of the proportion of R&D funds in GDP |
100 |
118.1 |
123.7 |
127.8 |
133.5 |
|
3. Index of per capita funding for basic researchers |
100 |
136.1 |
140.5 |
138.9 |
148.1 |
|
4. Index of the proportion of enterprise R&D funds in business revenue |
100 |
147.7 |
161.0 |
170.9 |
179.0 |
|
III. Innovation Output Index |
100 |
171.6 |
187.5 |
199.7 |
215.8 |
|
1. Index of the number of scientific and technological papers per 10,000 people |
100 |
121.5 |
128.3 |
129.8 |
137.3 |
|
2. Index of the number of high-value invention patents owned per 10,000 R&D personnel |
100 |
200.9 |
227.7 |
263.3 |
296.2 |
|
3. Index of the proportion of enterprises with registered trademarks |
100 |
205.2 |
219.3 |
229.6 |
248.9 |
|
4. Index of the average contract value for technology market transactions |
100 |
173.7 |
193.2 |
202.9 |
214.7 |
|
IV. Innovation Effectiveness Index |
100 |
127.6 |
128.8 |
130.0 |
132.4 |
|
1. Index of the proportion of new product sales revenue in business revenue |
100 |
165.4 |
181.0 |
184.6 |
186.9 |
|
2. Index of the proportion of high-tech product export value in goods export value |
100 |
102.0 |
92.7 |
86.5 |
85.6 |
|
3. Index of the proportion of added value from patent-intensive industries in GDP |
100 |
115.2 |
117.7 |
120.7 |
120.7 |
|
4. Index of the proportion of added value from the “three new” economy in GDP |
100 |
119.1 |
117.6 |
119.3 |
124.4 |
|
5. Overall labor productivity index |
100 |
146.4 |
152.8 |
161.7 |
169.7 |
|
Note: Based on the final verified data of gross domestic product (GDP), the data from 2021 to 2023 were revised accordingly. | |||||
Note:
[1] The calculating results of China’s innovation index were revised in accordance with situations such as the final verified GPD data after the fifth national economic census.
Annex:
Brief Explanation of China’s Innovation Index System and Index Compilation Method
I. China’s Innovation Index System
China’s innovation index system is divided into three levels. The first level is the overall development of innovation in China, which is reflected by the calculation of the total innovation index; the second level reflects the development of China in four subfields, including innovation environment, innovation input, innovation output, and innovation effectiveness, reflected by the calculation of their respective sub-indices; the third level is the specific development status of various aspects of innovation capabilities, which is reflected by the 18 sub-indices selected from the above-mentioned four subfields (see the attached table for the detailed framework of index system). A brief explanation is as follows:
i. Innovation Environment
The field primarily reflects the support conditions necessary for driving innovative development, including essential resources such as human and financial resources, as well as the policy guidance and support required for fostering innovation.
1. Number of people with college degree or above per 10,000 employed persons
It refers to the average number of employees possessing a certain level of educational qualifications. This index is used to reflect the comprehensive quality of the labor force in China.
2. Per capita GDP
It refers to the per capita gross domestic product (GDP, at constant prices). This is the most representative indicator of a country’s economic strength, which can reflect the interdependence and mutual promotion between economic growth and innovation capability development.
3. Proportion of science and engineering graduates in the relevant age cohort
This index reflects the situation of potential innovative human resources in China. Science and engineering graduates refer to the number of graduates of science, engineering, agriculture and medicine at or above the undergraduate level, and the relevant age cohort refers to the population aged 20 to 34 in China.
4. Proportion of science and technology allocation in financial allocation
The government’s financial allocation for science and technology plays a leading and guiding role in the innovation input and innovation activities of the whole society. This index reflects the government’s direct input in innovation as well as the planning and guidance on key, important and frontier fields.
5. Proportion of enterprises enjoying tax exemption and deduction
The policy allowing additional pre-tax deductions for R&D expenses is one of the most direct and effective measures to encourage enterprises to increase their input in research and development. This index can reflect the implementation of relevant government policies, and then reflect the innovation environment of enterprises from one aspect. The data of this index pertain to industrial enterprises above the designated size.
ii. Innovation Input
This field mainly reflects the scale and intensity of human and financial resources input for innovation, and input in crucial areas. R&D is the most crucial link in realizing innovation, and the R&D input indicators here reflect the innovation input.
1. Full-time equivalent of R&D personnel per 10,000 people
It refers to the full-time equivalent of R&D personnel based on the average of the total resident population. This index reflects the input scale and intensity of human resources for independent innovation. R&D personnel include R&D personnel of enterprises, scientific research institutions, and higher education institutions, representing a collective input of R&D human resources from various innovative entities across society. The full-time equivalent of R&D personnel refers to the R&D personnel converted by workload.
2. Proportion of R&D funds in GDP
This index, also known as R&D input intensity, is the core index that is commonly used in the world and reflects the level of national or regional scientific and technological input, and is also an important evaluation index in China’s relevant scientific and technological innovation planning.
3. Per capita funding for basic researchers
It refers to the average basic research funds according to the full-time equivalent of basic researchers. Basic research is the foundation of scientific and technological development, and its level can represent a country’s original innovation capability to a certain extent. The index system uses this index to reflect the national efforts to strengthen the original innovation capability.
4. Proportion of enterprise R&D funds in business revenue
Enterprises are the main entities of innovation activities, while industrial enterprises play a leading role in enterprise innovation activities. This index reflects the input intensity of the main entities of innovation activities. The data of this index pertain to industrial enterprises above the designated size.
iii. Innovation Output
This field reflects the intermediate innovation output through papers, patents, trademarks, and technological markets.
1. Number of scientific and technological papers per 10,000 people
Scientific and technological papers refer to the academic papers produced by scientific and technological projects initiated by enterprises and institutions and published in officially registered journals. Scientific and technological papers are one of the important forms of achievements produced in the process of innovation activities. This index reflects the output level and efficiency of R&D activities.
2. Number of high-value invention patents owned per 10,000 R&D personnel
It refers to the number of high-value and valid invention patents, averaged over R&D personnel. Patent is another important form of intermediate output of innovation activities. High-value invention patents refer to those that are in line with the development direction of national key industry, and those with high patent quality or high value. The specific scope of high-value patent is defined by the China National Intellectual Property Administration, reflecting a transformation to high-quality development in the patent landscape. This index, as a part of the monitoring of the relevant planning, is an important indicator reflecting the output and efficiency of R&D activities.
3. Proportion of enterprises with registered trademarks
An enterprise with a registered trademark refers to a company that is the primary registrant of a trademark that has been approved and registered by domestic and international trademark authorities and is currently valid. This index serves as a reflection of the enterprise’s ownership of its own brand to some extent. The data of this index pertain to industrial enterprises above the designated size.
4. Average contract value for technology market transactions
It refers to the average transaction amount in the technology market, calculated by the number of contract projects in the technology market. This index reflects the quality and efficiency of technology transfer and transformation of scientific and technological achievements. The transaction amount in the technology market refers to the total amount of the contract projects in the national technology market.
iv. Innovation Effectiveness
The field reflects the impact of innovation on socio-economic development through aspects such as economic growth, economic transformation, adjustments in product structure, and international competitiveness in industrial technology.
1. Proportion of new product sales revenue in business revenue
Sales revenue of new products is an indicator that reflects the innovation achievements of enterprises, that is, successfully pushes new products to the market. It can reflect the impact of innovation on the adjustment of product structure. The data of this index pertain to industrial enterprises above the designated size.
2. Proportion of high-tech product export value in goods export value
There is an interactive relationship between high-tech industry and innovation. This index reflects the impact of innovation on the international competitiveness of the industry through the changes in high-tech product export.
3. Proportion of added value from patent-intensive industries in GDP
Patent-intensive industries reflect the close integration of intellectual property rights, scientific and technological innovation, and the industrial economy. They are a strong support and important development direction for high-quality development. The proportion of their added value in GDP can demonstrate the effectiveness of innovation on economic development from the perspective of guiding the transformation and upgrading of the industrial structure.
4. Proportion of added value from the “three new” economy in GDP
“Three new” economy plays a crucial role in promoting high-quality development. Its added value in GDP can demonstrate the effectiveness of innovation on economic development from the perspective of economic transition and development and economic vitality enhancement driven by the emerging economy.
5. Overall labor productivity
It refers to the ratio of gross domestic product (GDP, at constant price) to employed persons in a certain period of time. Innovation is an important factor affecting labor productivity, and improving labor productivity is one of the purposes of innovation. This index can reflect the role of innovation in promoting economic development.
II. Evaluation Method of China’s Innovation Index
i. Select the Base Year
On the basis of a comprehensive assessment of the availability, consistency, and continuity of indicators, 2015 is selected as the base year.
ii. Determine the Index Weight
The “level-by-level equal weight method” is adopted to distribute the weights, whereby the weight of each subfield is set at 1/4; within a certain subfield, the weight of each index is calculated as 1/n of the total weight for that field (where n represents the number of indices within that field); the final weight for each index is determined as 1/4n. See the attached table for the weight of each index.
iii. Calculate the Index Growth Rate
When calculating the development speed with a fixed base, the usual method is to calculate the growth rate of each index and then carry out a weighted average. The original method of setting the benchmark value of index growth rate as the two-year average value of the index when calculating the development speed with a fixed base is continued to be applied for this index. The range of growth rate of each index is controlled within the range of [-200, 200] to enhance the stability of data, and to reduce the distortion of the whole index system due to excessive fluctuation of values of certain indices. The calculation formula is: ![]() , where i is the serial number of indices, t is the year, and t>=2016.
, where i is the serial number of indices, t is the year, and t>=2016.
iv. Compose Indices of Subfields and the Total Index
1. Calculate the weighted growth rate of the indices in each field:
 , where i is the serial number of indices, t is the year,
 ![]() is the weight of each index to the field it belongs to,
is the weight of each index to the field it belongs to, ![]() is the calculated growth rate of each index, k is the number of indices within this field, and t>=2016.
is the calculated growth rate of each index, k is the number of indices within this field, and t>=2016.
2. Calculate sub-indices of accumulative development in each field with a fixed base:
 , where t is the year, t>=2015, and E2015=100.
3. Calculate the total index of the accumulative development with a fixed base:
 , where t is the year,
 ![]() is the weight of each field to the total index.
is the weight of each field to the total index.
Framework of China’s Innovation Index System
|
Item |
Indicators |
Unit |
Weight※ |
|
Innovation Environment (1/4)
|
1.1 Number of people with college degree or above per 10,000 employed persons |
person / 10,000 persons |
1/5 |
|
1.2. Per capita GDP |
yuan / person |
1/5 | |
|
1.3 Proportion of science and engineering graduates in the relevant age cohort |
% |
1/5 | |
|
1.4 Proportion of science and technology allocation in financial allocation |
% |
1/5 | |
|
1.5 Proportion of enterprises enjoying tax exemption and deduction |
% |
1/5 | |
|
Innovation Input (1/4)
|
2.1 Full-time equivalent of R&D personnel per 10,000 people |
man-year / 10,000 persons |
1/4 |
|
2.2 Proportion of R&D funds in GDP |
% |
1/4 | |
|
2.3 Per Capita funding for basic researchers |
10,000 yuan / man-year |
1/4 | |
|
2.4. Proportion of enterprise R&D funds in business revenue |
% |
1/4 | |
|
Innovation Output (1/4) |
3.1 Number of scientific and technological papers per 10,000 people |
paper / 10,000 persons |
1/4 |
|
3.2. Number of high-value invention patents owned per 10,000 R&D personnel |
patent / 10,000 persons |
1/4 | |
|
3.3 Proportion of enterprises with registered trademarks |
% |
1/4 | |
|
3.4 Average contract value for technology market transactions |
10,000 yuan / contract |
1/4 | |
|
Innovation Effectiveness (1/4) |
4.1 Proportion of new product sales revenue in business revenue |
% |
1/5 |
|
4.2 Proportion of high-tech product export value in goods export value |
% |
1/5 | |
|
4.3 Proportion of added value from patent-intensive industries in GDP |
% |
1/5 | |
|
4.4 Proportion of added value from the “three new” economy in GDP |
% |
1/5 | |
|
4.5 Overall labor productivity |
yuan / person |
1/5 | |
|
※Note: The weight of each subfield is 1/4, and the weight of an index within a specific subfield relative to its parent field is 1/n (where n is the number of indices in that subfield). | |||