The Profit of Industrial Enterprises above Designated Size from January to August in 2025
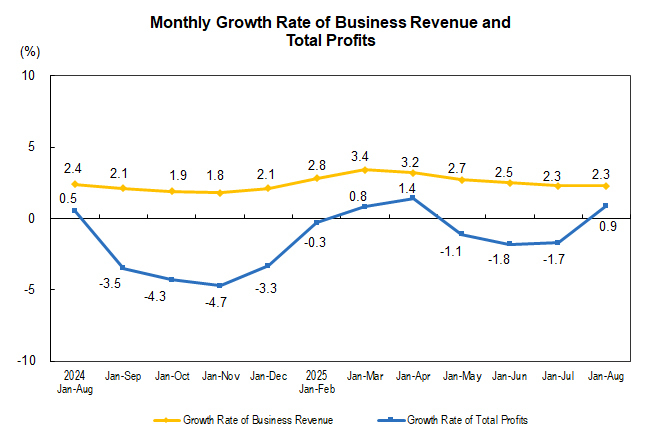
From January to August, the total profits of industrial enterprises above the designated size nationwide reached 4,692.97 billion yuan, a year-on-year increase of 0.9 percent (calculated on a comparable basis, see Annotation 2 for details).
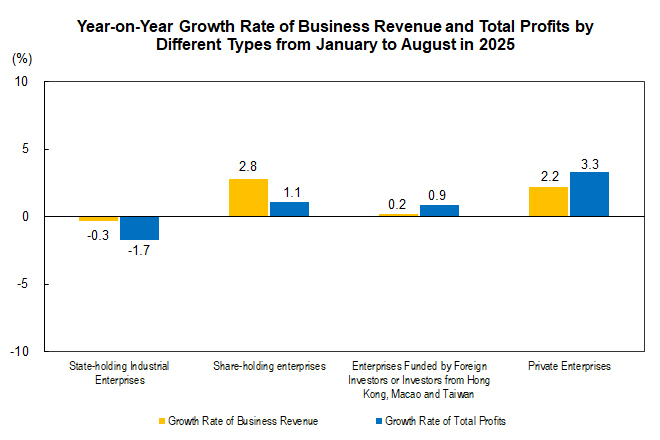
From January to August, among industrial enterprises above the designated size, state-holding enterprises realized a total profit of 1,515.65 billion yuan, a year-on-year decrease of 1.7 percent; share-holding enterprises realized a total profit of 3,493.19 billion yuan, an increase of 1.1 percent; enterprises funded by foreign investors or investors from Hong Kong, Macao and Taiwan realized a total profit of 1,172.36 billion yuan, an increase of 0.9 percent; and private enterprises realized a total profit of 1,307.61 billion yuan, an increase of 3.3 percent.
From January to August, the mining industry realized a total profit of 566.11 billion yuan, a year-on-year decrease of 30.6 percent; the manufacturing industry realized a total profit of 3,523.35 billion yuan, an increase of 7.4 percent; the production and supply of electricity, thermal power, gas and water realized a total profit of 603.51 billion yuan, an increase of 9.4 percent.
From January to August, the profits of main industries were as follows: the total profit of production and supply of electricity and thermal power increased by 13.0 percent year on year; the total profit of the smelting and pressing of non-ferrous metals increased by 12.7 percent; the total profit of the processing of food from agricultural and sideline products increased by 11.8 percent; the total profit of the manufacture of electrical machinery and apparatus increased by 11.5 percent; the total profit of the manufacture of computers, communication equipment and other electronic equipment increased by 7.2 percent; the total profit of the manufacture of special-purpose machinery increased by 6.9 percent; the total profit of the manufacture of general-purpose machinery increased by 5.8 percent; the processing of petroleum, coal and other fuel reduced losses year on year; the smelting and pressing of ferrous metals showed a turn from loss to profit year on year; the total profit of the manufacture of automobiles decreased by 0.3 percent; the total profit of the manufacture of non-metallic mineral products decreased by 2.2 percent; the total profit of manufacture of raw chemical materials and chemical products decreased by 5.5 percent; the total profit of the textile industry decreased by 7.0 percent; the total profit of the extraction of petroleum and natural gas decreased by 12.4 percent; and the total profit of the mining and washing of coal decreased by 53.6 percent.
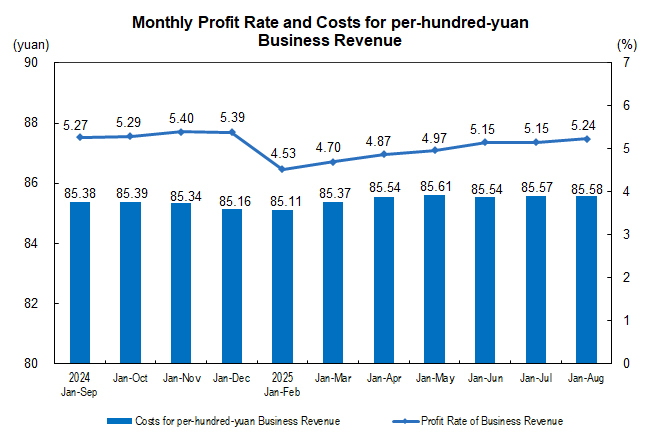
From January to August, industrial enterprises above the designated size achieved business revenue of 89.62 trillion yuan, a year-on-year increase of 2.3 percent; the operating cost incurred was 76.70 trillion yuan, an increase of 2.5 percent; the profit rate of business revenue was 5.24 percent, a year-on-year decrease of 0.06 percentage point.
At the end of August, the assets of industrial enterprises above the designated size totaled 185.08 trillion yuan, a year-on-year increase of 5.0 percent; the liabilities totaled 107.34 trillion yuan, an increase of 5.4 percent; the owner’s equity totaled 77.73 trillion yuan, an increase of 4.4 percent; the asset-liability ratio was 58.0 percent, a year-on-year increase of 0.2 percentage point.
At the end of August, the accounts receivable of industrial enterprises above the designated size totaled 27.24 trillion yuan, a year-on-year increase of 6.6 percent; the inventory of finished goods was 6.73 trillion yuan, an increase of 2.3 percent.
From January to August, the costs of industrial enterprises above the designated size for per-hundred-yuan business revenue were 85.58 yuan, a year-on-year increase of 0.19 yuan; the expenses for per-hundred-yuan business revenue were 8.37 yuan, a year-on-year decrease of 0.08 yuan.
At the end of August, the business revenue brought by per-hundred-yuan assets of industrial enterprises above the designated size was 74.0 yuan, a year-on-year decrease of 2.0 yuan; the per capita business revenue was 1.835 million yuan, a year-on-year increase of 57,000 yuan; the turnover days of finished goods were 20.5 days, a year-on-year increase of 0.1 days; the average collection period for accounts receivable was 70.1 days, a year-on-year increase of 3.7 days.
In August, the total profits of industrial enterprises above the designated size turned from a year-on-year decrease of 1.5 percent last month to an increase of 20.4 percent.
Key Financial Indicators of Industrial Enterprises above Designated Size from January to August in 2025
|
Indicators |
Business Revenue |
Operating Costs |
Total Profits | |||
|
Volume (100 million yuan) |
Growth Rate Y/Y (%) |
Volume (100 million yuan) |
Growth Rate Y/Y (%) |
Volume (100 million yuan) |
Growth Rate Y/Y (%) | |
|
Total |
896231.9 |
2.3 |
766960.8 |
2.5 |
46929.7 |
0.9 |
|
Of which: Mining |
33727.7 |
-13.1 |
23281.7 |
-8.5 |
5661.1 |
-30.6 |
|
Manufacturing |
778075.3 |
3.2 |
668649.6 |
3.2 |
35233.5 |
7.4 |
|
Production and Supply of Electricity, Thermal Power, Gas and Water |
84428.9 |
0.5 |
75029.6 |
-0.1 |
6035.1 |
9.4 |
|
Of which: State-holding Enterprises |
242490.8 |
-0.3 |
204111.3 |
0.2 |
15156.5 |
-1.7 |
|
Of which: Share-holding Enterprises |
722761.5 |
2.8 |
621219.2 |
3.1 |
34931.9 |
1.1 |
|
Enterprises Funded by Foreign Investors or Investors from Hong Kong, Macao and Taiwan |
168179.9 |
0.2 |
141219.8 |
0.0 |
11723.6 |
0.9 |
|
Of which: Private Enterprises |
330277.4 |
2.2 |
286017.4 |
2.0 |
13076.1 |
3.3 |
|
Notes: 1. Due to the overlap of economic type grouping, the sum of sub-items is greater than the total. 2. Due to the rounding-off reasons, the subentries may not add up to the aggregate totals, no adjustment. | ||||||
Quality Performance Indicators of Industrial Enterprises above Designated Size from January to August in 2025
|
Indicators |
Profit Rate of Business Revenue |
Costs for per-hundred-yuan Business Revenue |
Expenses for per-hundred-yuan Business Revenue |
Business Revenue Brought by per-hundred-yuan Assets |
Per Capital Business Revenue |
Asset-Liability Ratio |
Turnover Days of Finished Goods |
Average Collection Period for Accounts Receivable |
|
Jan-Aug |
Jan-Aug |
Jan-Aug |
By the end of August |
By the end of August |
By the end of August |
By the end of August |
By the end of August | |
|
(%) |
(yuan) |
(yuan) |
(yuan) |
(10 thousand yuan/person) |
(%) |
(days) |
(days) | |
|
Total |
5.24 |
85.58 |
8.37 |
74.0 |
183.5 |
58.0 |
20.5 |
70.1 |
|
Of which: Mining |
16.78 |
69.03 |
10.08 |
35.4 |
128.9 |
57.3 |
16.1 |
58.5 |
|
Manufacturing |
4.53 |
85.94 |
8.65 |
86.6 |
176.9 |
57.4 |
22.8 |
71.2 |
|
Production and Supply of Electricity, Thermal Power, Gas and Water |
7.15 |
88.87 |
5.07 |
38.9 |
378.3 |
60.7 |
1.2 |
64.4 |
|
Of which: State-holding Enterprises |
6.25 |
84.17 |
6.08 |
54.6 |
308.1 |
57.8 |
12.3 |
56.2 |
|
Of which: Share-holding Enterprises |
4.83 |
85.95 |
8.19 |
72.6 |
182.4 |
59.0 |
20.6 |
67.8 |
|
Enterprises Funded by Foreign Investors or Investors from Hong Kong, Macao and Taiwan |
6.97 |
83.97 |
9.15 |
80.3 |
191.6 |
53.1 |
19.8 |
79.9 |
|
Of which: Private Enterprises |
3.96 |
86.60 |
9.50 |
95.4 |
139.3 |
59.3 |
25.1 |
70.9 |
Key Financial Indicators of Industrial Enterprises above Designated Size from January to August in 2025 (Group by Industry)
|
Indicators |
Business Revenue |
Operating Costs |
Total Profits | |||
|
Volume |
Growth Rate Y/Y |
Volume |
Growth Rate Y/Y |
Volume |
Growth Rate Y/Y | |
|
(100 million yuan) |
(%) |
(100 million yuan) |
(%) |
(100 million yuan) |
(%) | |
|
Total |
896231.9 |
2.3 |
766960.8 |
2.5 |
46929.7 |
0.9 |
|
Mining and Washing of Coal |
16559.1 |
-20.8 |
12079.2 |
-13.4 |
1937.3 |
-53.6 |
|
Extraction of Petroleum and Natural Gas |
7706.5 |
-5.7 |
4236.6 |
1.8 |
2364.7 |
-12.4 |
|
Mining of Ferrous Metal Ores |
3056.4 |
-12.6 |
2461.2 |
-11.3 |
295.0 |
-30.3 |
|
Mining of Non-ferrous Metal Ores |
2664.1 |
13.2 |
1530.1 |
6.0 |
809.3 |
33.9 |
|
Mining and Processing of Nonmetal Ores |
2350.4 |
-0.4 |
1688.6 |
-1.0 |
231.7 |
-3.1 |
|
Mining and Its Support Service Activities |
1388.8 |
-7.5 |
1283.7 |
-8.1 |
22.9 |
2.2 |
|
Mining of Other Ores N.E.C |
2.5 |
-56.9 |
2.1 |
-58.8 |
0.2 |
(Note 1) |
|
Processing of Food from Agricultural and Sideline Products |
34097.9 |
2.6 |
31561.7 |
2.4 |
802.6 |
11.8 |
|
Manufacture of Foods |
14270.5 |
1.3 |
11212.1 |
1.7 |
1125.5 |
1.8 |
|
Manufacture of Wines, Beverages and Refined Tea |
10539.1 |
1.0 |
6875.9 |
2.6 |
2266.0 |
19.9 |
|
Manufacture of Cigarettes and Tobacco |
10580.4 |
3.2 |
2997.2 |
5.0 |
1435.1 |
0.9 |
|
Textile Industry |
15155.2 |
-2.2 |
13524.2 |
-2.2 |
426.4 |
-7.0 |
|
Manufacture of Textile Wearing Apparel and Ornament |
7620.5 |
-3.6 |
6531.0 |
-3.1 |
280.3 |
-17.9 |
|
Manufacture of Hides, Fur, Feather and Its Products and Footwear |
5341.9 |
-2.3 |
4633.5 |
-2.2 |
264.0 |
-9.2 |
|
Processing of Timbers, Manufacture of Wood, Bamboo, Rattan, Palm, and Straw Products |
5570.6 |
-3.1 |
5069.6 |
-3.0 |
155.1 |
-12.4 |
|
Manufacture of Furniture |
4038.3 |
-6.0 |
3348.8 |
-6.2 |
171.0 |
-16.7 |
|
Manufacture of Paper and Paper Products |
9167.1 |
-1.9 |
8108.1 |
-1.8 |
229.3 |
-18.8 |
|
Printing, Reproduction of Recording Media |
4215.7 |
-1.0 |
3520.1 |
-1.1 |
207.2 |
-5.2 |
|
Manufacture of Articles for Culture, Education, Artwork, Sport and Entertainment Activity |
9263.3 |
7.2 |
8138.5 |
8.7 |
337.5 |
-13.4 |
|
Processing of Petroleum, Coal and Other Fuel |
35457.6 |
-11.3 |
30446.2 |
-13.0 |
-104.6 |
(Note 2) |
|
Manufacture of Raw Chemical Materials and Chemical Products |
59475.9 |
0.9 |
51826.8 |
0.9 |
2460.8 |
-5.5 |
|
Manufacture of Medicine |
15833.1 |
-2.0 |
9297.2 |
-1.0 |
2129.5 |
-3.9 |
|
Manufacture of Chemical Fibers |
7065.1 |
-4.4 |
6537.5 |
-4.6 |
165.2 |
-2.6 |
|
Manufacture of Rubber and Plastics Articles |
20018.6 |
2.4 |
16989.3 |
2.6 |
985.3 |
-4.6 |
|
Manufacture of Non-metallic Mineral Products |
30907.8 |
-5.3 |
26473.4 |
-5.9 |
957.9 |
-2.2 |
|
Smelting and Pressing of Ferrous Metals |
50799.8 |
-5.3 |
48046.9 |
-7.5 |
837.0 |
(Note 3) |
|
Smelting and Pressing of Non-ferrous Metals |
62102.0 |
14.0 |
58456.7 |
14.6 |
2198.8 |
12.7 |
|
Manufacture of Metal Products |
30479.2 |
1.0 |
26985.8 |
0.9 |
1024.8 |
0.5 |
|
Manufacture of General-purpose Machinery |
32742.6 |
5.0 |
26641.0 |
5.0 |
2211.4 |
5.8 |
|
Manufacture of Special-purpose Machinery |
24247.6 |
2.5 |
18968.7 |
2.8 |
1701.4 |
6.9 |
|
Manufacture of Automobiles |
68048.9 |
7.5 |
59888.8 |
8.2 |
3035.1 |
-0.3 |
|
Manufacture of Railway, Ship, Aerospace and Other Transport Equipment |
10913.4 |
16.3 |
9043.9 |
15.2 |
895.6 |
37.3 |
|
Manufacture of Electrical Machinery and Apparatus |
73895.9 |
9.5 |
63714.7 |
10.4 |
3937.1 |
11.5 |
|
Manufacture of Computers, Communication Equipment and Other Electronic Equipment |
108098.8 |
8.8 |
94269.7 |
8.7 |
4149.6 |
7.2 |
|
Manufacture of Measuring Instrument and Meter |
6817.0 |
5.6 |
5060.6 |
5.9 |
648.7 |
4.6 |
|
Other Manufacturing |
1457.2 |
4.9 |
1203.8 |
5.7 |
75.8 |
-9.5 |
|
Waste Recycling and Recovery |
8169.4 |
5.0 |
7854.4 |
4.9 |
104.5 |
34.8 |
|
Repair of Fabricated Metal Products, Machinery and Equipment |
1685.0 |
15.9 |
1423.4 |
16.6 |
119.4 |
4.6 |
|
Production and Supply of Electricity and Thermal Power |
66821.7 |
0.2 |
59243.6 |
-0.6 |
5181.1 |
13.0 |
|
Production and Supply of Gas |
14505.0 |
1.9 |
13553.3 |
2.3 |
548.9 |
-8.7 |
|
Production and Supply of Water |
3102.2 |
0.1 |
2232.7 |
-1.5 |
305.1 |
-7.3 |
|
Notes: 1. As the total profit of mining of other ores N.E.C in the same period last year was 0.0 billion yuan, the year-on-year increase rate could not be calculated. 2. As the processing of petroleum, coal and other fuel recorded losses in the same period last year, the year-on-year increase rate could not be calculated. 3. As the smelting and pressing of ferrous metals recorded losses in the same period last year, the year-on-year increase rate could not be calculated. 4. Due to the rounding-off reasons, the subentries may not add up to the aggregate totals, no adjustment. | ||||||
Annotations:
I. Explanatory Notes:
1. Total Profits: refer to the surplus of various revenue deducting various costs in the production process of enterprises, reflecting the total profit and loss in the report period.
2. Business Revenue: refers to the inflow of economic benefits from the production and operation of enterprises, such as selling goods, providing labor services and transferring the right to use assets, including the total amount of revenue of enterprises recognized by the principal business and other business operations.
3. Operating Costs: refers to the actual costs from the production and operation of enterprises such as selling goods, providing labor services and transferring the right to use assets, including the total amount of costs of enterprises incurred by the principal business and other business operations. Operating costs should be matched with business revenue.
4. Total Assets: refers to the resources that are gotten from past transactions or events, owned or controlled by enterprises, and expected to bring economic benefits to the enterprises.
5. Total Liabilities: refers to the current obligation generated from past transactions or events, and expected an outflow of economic benefits from the enterprises.
6. Total Owners’ Equity: refers to the residual interests after deducting liabilities, which belong to the enterprise’s owners.
7. Accounts Receivable: refers to the amount that should be collected by an enterprise due to its business activities, such as selling goods and providing services, measured at amortized cost on the balance sheet date.
8. Inventory of Finished Goods: refers to products, with all production processes having been finished by enterprises, that are accepted and stored after inspection, can be delivered to ordering units according to conditions in the contract or can be taken as goods for external sales; and various goods purchased or accepted and stored after inspection with the completion of consigned processing for sales.
9. Profit Rate of Business Revenue = total profits / business revenue × 100%, unit: %.
10. Costs for per-hundred-yuan Business Revenue = operating costs/ business revenue× 100, unit: yuan.
11. Expenses for per-hundred-yuan Business Revenue = (selling expenses + administrative expenses + R&D expenses + financial expenses) / business revenue ×100, unit: yuan.
12. Business Revenue Brought by per-Hundred-Yuan Assets = business revenue / average assets / the cumulative number of months × 12 × 100, unit: yuan.
13. Per Capita Business Revenue = business revenue / average number of employees / the cumulative number of months × 12, unit: 10 thousand yuan/ person.
14. Asset-Liability Ratio = total liabilities / total assets × 100%, unit: %.
15. Turnover Days of Finished Goods = 360 × average finished goods / operating costs × the cumulative number of months / 12, unit: days.
16. Average Collection Period for Accounts Receivable = 360 ×average accounts receivable / business revenue ×the cumulative number of months / 12, unit: days.
17. In the columns of increase rate year-on-year of the three tables above, the “note” refers to negative total profits in the same period last year, which means loss, or 0.0 billion yuan; the positive value refers to a year-on-year increase of profits; the negative value which is greater than or equal to -100% refers to a year-on-year decrease of profits; the value less than -100% indicates turning gain in the same period last year into loss in current period; and the value of 0 indicates that the profits remain at the same level as last year.
II. The growth rates of the total profits and business revenue of industrial enterprises above the designated size are calculated on a comparable basis. There are incomparable factors between the data in the reporting period and the same indicator data published in the previous year, which cannot be directly compared to calculate the growth rate. The main reasons are: (1) According to the statistical system, the survey coverage of industrial enterprises above the designated size is adjusted regularly every year. Each year, some companies will be included in the survey after having reached the designated size, and some will exit the survey due to their smaller size, and there is also influence of new built and starting enterprises, bankruptcies, and companies that have been suspended or sold. (2) By strengthening the statistical law enforcement, the enterprises found in the statistical law enforcement inspection that do not meet the industrial statistics requirements above the designated size have been cleared, and relevant bases have been revised in accordance with regulations. (3) Strengthen data quality management and eliminate the cross-regional and cross-industry repeated calculation.
III. Statistical Coverage
Industrial enterprises above the designated size refer to industrial enterprises with revenue from principal activities over 20 million yuan.
IV. Survey Method
The Financial Report of Enterprises above the Designated Size conducts complete survey by month (the data for January are not required to be reported).
V. Industrial Classification Standard
The Industrial Classification for National Economic Activities (GB/T4754-2017) was implemented.