Industrial Production Operation in August 2025
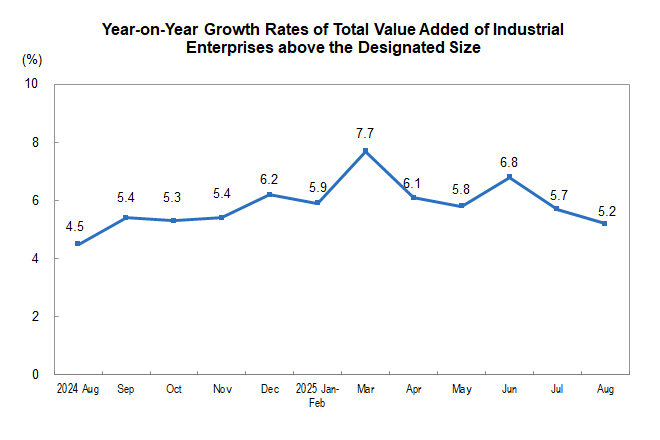
In August, the total value added of industrial enterprises above the designated size increased by 5.2% year on year in real terms (the growth rates of value added are the real growth rates after deducting price factors). On a month-on-month basis, in August, the total value added of industrial enterprises above the designated size increased by 0.37% over the previous month. From January to August, the value added of industrial enterprises above the designated size increased by 6.2% year on year.
In terms of three sectors, in August, the value added of the mining industry increased by 5.1% year on year, that of the manufacturing industry increased by 5.7%, and that of the production and supply of electricity, thermal power, gas and water increased by 2.4%.
In terms of economic types, in August, the value added of state-holding enterprises increased by 4.7% year on year; that of share-holding enterprises increased by 6.0%; that of enterprises funded by foreign investors and investors from Hong Kong, Macao and Taiwan increased by 2.3%; and that of private enterprises increased by 4.6%.
In terms of industries, in August, the value added of 31 of the 41 major industries kept year-on-year growth. Among them, the value added of the mining and washing of coal went up by 5.1%, that of the extraction of petroleum and natural gas up by 4.7%, that of the processing of food from agricultural and sideline products up by 4.7%, that of the manufacture of liquor, beverages and refined tea down by 2.4%, that of the textile industry up by 1.5%, that of the manufacture of raw chemical materials and chemical products up by 7.6%, that of the manufacture of non-metallic mineral products up by 0.5%, that of the smelting and pressing of ferrous metals up by 7.3%, that of the smelting and pressing of non-ferrous metals up by 9.1%, that of the manufacture of general purpose machinery up by 7.3%, that of the manufacture of special purpose machinery up by 4.0%, that of the manufacture of motor vehicles up by 8.4%, that of the manufacture of railway, ship, aerospace and other transport equipment up by 12.0%, that of the manufacture of electrical machinery and apparatus up by 9.8%, that of the manufacture of computers, communication equipment and other electronic equipment up by 9.9%, and that of the production and supply of electricity and thermal power up by 2.5%.
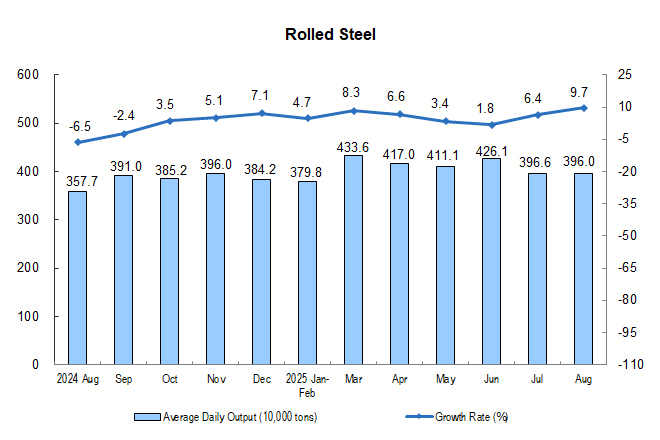
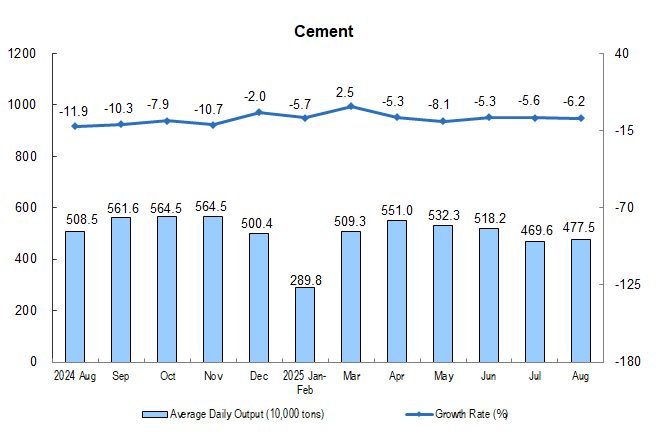
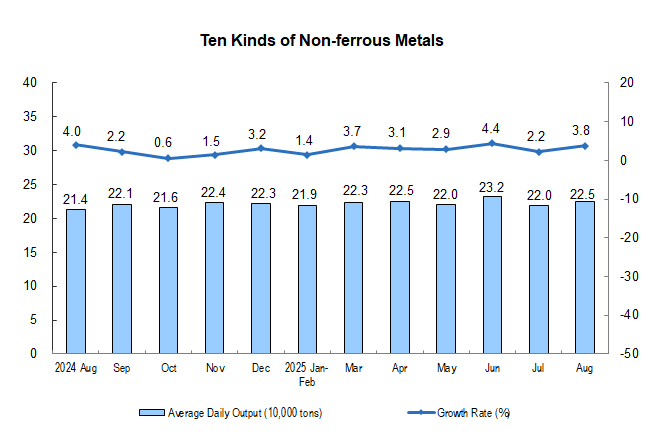
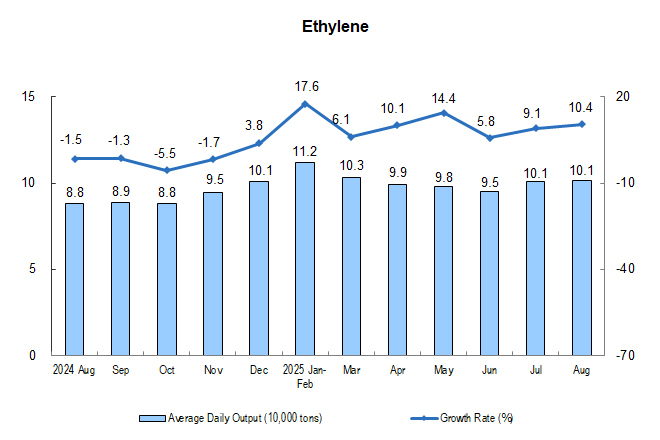
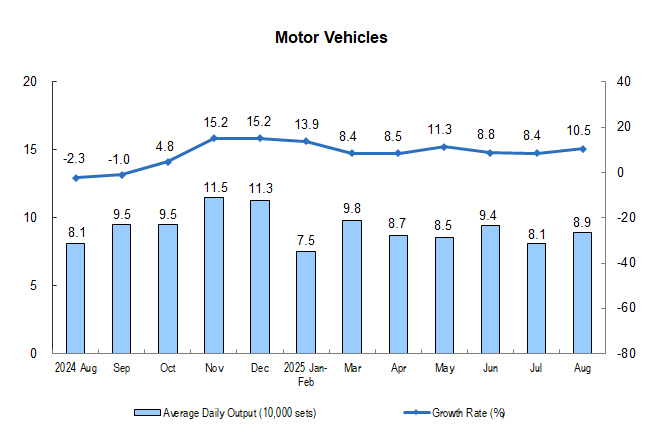
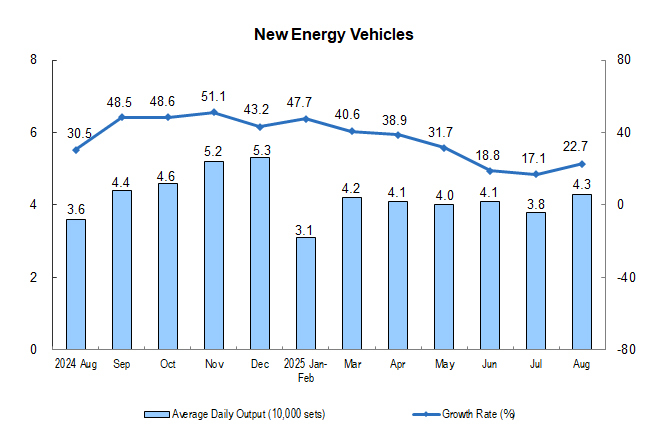
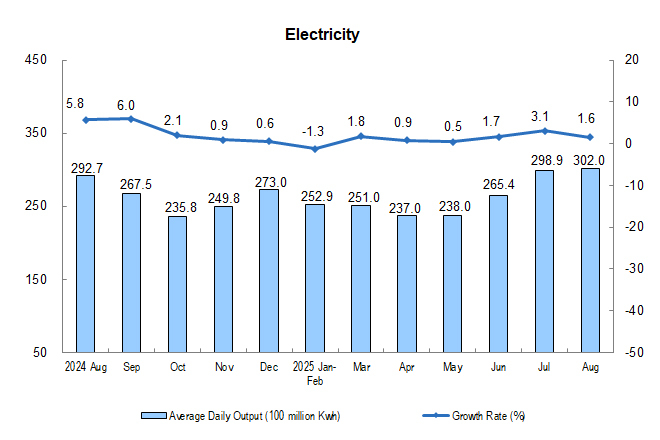
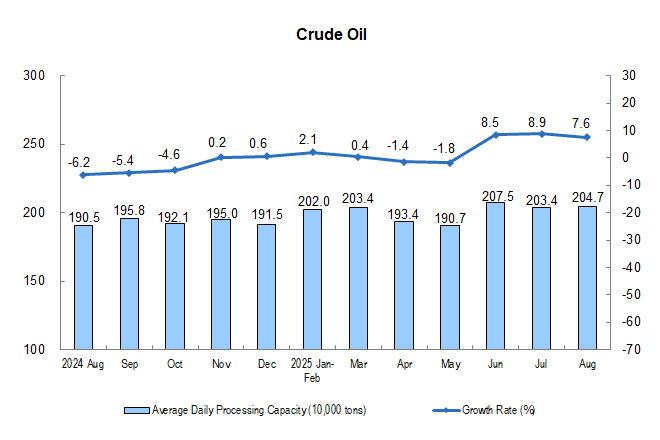
In terms of products, in August, the output of 319 out of 623 products produced by industrial enterprises above the designated size increased year on year. Among them, the output of rolled steel was 122.77 million tons, up by 9.7% year on year; that of cement was 148.02 million tons, down by 6.2%; that of ten kinds of non-ferrous metals was 6.98 million tons, up by 3.8%; that of ethylene was 3.14 million tons, up by 10.4%; that of motor vehicles was 2.752 million sets, up by 10.5%, including 1.333 million new energy vehicles, up by 22.7%; the electricity generation was 936.3 billion kWh, up by 1.6%; and the crude oil processing capacity was 63.46 million tons, up by 7.6%.
In August, the product sales rate of industrial enterprises above the designated size was 96.6%, a year-on-year decrease of 0.1 percentage points; and the export delivery value realized by industrial enterprises above the designated size stood at 1,302.9 billion yuan, a nominal decrease of 0.4% year on year.
Industrial Production Operation in August 2025
|
Indicators |
August |
January-August | ||
|
Absolute Value |
Growth Rate Y/Y (%) |
Absolute Value |
Growth Rate Y/Y (%) | |
|
Value-added of Industrial Enterprises Above the Designated Size |
… |
5.2 |
… |
6.2 |
|
By three sectors |
|
|
|
|
|
Mining |
… |
5.1 |
… |
5.7 |
|
Manufacturing |
… |
5.7 |
… |
6.8 |
|
Of which: High technology manufacturing industry |
… |
9.3 |
… |
9.5 |
|
Production and supply of electricity, thermal power, gas and water |
… |
2.4 |
… |
2.2 |
|
By economic types |
|
|
|
|
|
Of which: State-holding enterprises |
… |
4.7 |
… |
4.4 |
|
Of which: Share-holding enterprises |
… |
6.0 |
… |
6.7 |
|
Enterprises funded by foreign investors and investors from Hong Kong, Macao and Taiwan |
… |
2.3 |
… |
3.9 |
|
Of which: Private enterprises |
… |
4.6 |
… |
6.3 |
|
Value-Added of the Main Industries |
|
|
|
|
|
Mining and washing of coal |
… |
5.1 |
… |
6.1 |
|
Extraction of petroleum and natural gas |
… |
4.7 |
… |
3.9 |
|
Processing of food from agricultural and sideline products |
… |
4.7 |
… |
6.9 |
|
Manufacture of foods |
… |
2.0 |
… |
5.4 |
|
Manufacture of liquor, beverages and refined tea |
… |
-2.4 |
… |
3.3 |
|
Textile industry |
… |
1.5 |
… |
3.4 |
|
Manufacture of raw chemical materials and chemical products |
… |
7.6 |
… |
8.0 |
|
Manufacture of medicines |
… |
3.3 |
… |
1.6 |
|
Manufacture of rubber and plastics products |
… |
3.5 |
… |
6.3 |
|
Manufacture of non-metallic mineral products |
… |
0.5 |
… |
-0.3 |
|
Smelting and pressing of ferrous metals |
… |
7.3 |
… |
6.1 |
|
Smelting and pressing of non-ferrous metals |
… |
9.1 |
… |
7.7 |
|
Manufacture of metal products |
… |
2.8 |
… |
7.4 |
|
Manufacture of general-purpose machinery |
… |
7.3 |
… |
8.1 |
|
Manufacture of special-purpose machinery |
… |
4.0 |
… |
3.8 |
|
Manufacture of motor vehicles |
… |
8.4 |
… |
10.5 |
|
Manufacture of railway, ship, aerospace and other transport equipment |
… |
12.0 |
… |
15.6 |
|
Manufacture of electrical machinery and apparatus |
… |
9.8 |
… |
11.6 |
|
Manufacture of computers, communication equipment and other electronic equipment |
… |
9.9 |
… |
10.8 |
|
Production and supply of electricity and thermal power |
… |
2.5 |
… |
2.0 |
|
Output of Major Industrial Products Above the Designated Size |
|
|
|
|
|
Cloth (100 million meters) |
27 |
-0.7 |
211 |
-0.6 |
|
Sulfuric acid (100%) (10,000 tons) |
973 |
8.8 |
7498 |
7.1 |
|
Caustic soda (100%) (10,000 tons) |
384 |
8.1 |
3045 |
4.8 |
|
Ethylene (10,000 tons) |
314 |
10.4 |
2441 |
10.6 |
|
Chemical fiber (10,000 tons) |
745 |
7.1 |
5773 |
5.5 |
|
Cement (10,000 tons) |
14802 |
-6.2 |
110457 |
-4.8 |
|
Plate glass (10,000 weight cases) |
8267 |
-2.0 |
64818 |
-4.5 |
|
Pig iron (10,000 tons) |
6979 |
1.0 |
57907 |
-1.1 |
|
Crude steel (10,000 tons) |
7737 |
-0.7 |
67181 |
-2.8 |
|
Rolled steel (10,000 tons) |
12277 |
9.7 |
98217 |
5.5 |
|
Ten kinds of nonferrous metals (10,000 tons) |
698 |
3.8 |
5432 |
3.1 |
|
Of which: Primary aluminum (electrolytic aluminum) (10,000 tons) |
380 |
-0.5 |
3014 |
2.2 |
|
Metal-cutting machine tools (10,000 units) |
7 |
16.4 |
56 |
14.6 |
|
Industrial robots (set) |
63747 |
14.4 |
512129 |
29.9 |
|
Service robots (set) |
1459525 |
-6.5 |
11856113 |
18.9 |
|
Motor vehicles (10,000 sets) |
275.2 |
10.5 |
2082.9 |
10.5 |
|
Of which: Saloon cars (10,000 sets) |
107.9 |
11.6 |
791.7 |
10.2 |
|
SUV (10,000 sets) |
116.7 |
7.1 |
878.3 |
8.7 |
|
Of which: New energy vehicles (10,000 sets) |
133.3 |
22.7 |
938.2 |
31.4 |
|
Power generation equipment (10,000 kWh) |
3002 |
30.7 |
22906 |
54.4 |
|
Solar cells (photovoltaic cells) (10,000 kilowatts) |
6986 |
16.8 |
54732 |
16.8 |
|
Micro computer equipment (10,000 units) |
2769 |
-13.1 |
21995 |
0.9 |
|
Mobile telephones (10,000 sets) |
12501 |
-5.7 |
96131 |
-4.0 |
|
Of which: Smartphone (10,000 sets) |
10040 |
3.2 |
75824 |
1.0 |
|
Integrated circuits (100 million pieces) |
425 |
3.2 |
3429 |
8.8 |
|
Coal (10,000 tons) |
39050 |
-3.2 |
316517 |
2.8 |
|
Coke (10,000 tons) |
4260 |
3.9 |
33406 |
2.8 |
|
Crude oil (10,000 tons) |
1826 |
2.4 |
14486 |
1.4 |
|
Crude oil processing capacity (10,000 tons) |
6346 |
7.6 |
48807 |
3.2 |
|
Natural gas (100 million cubic meters) |
212 |
5.9 |
1737 |
6.1 |
|
Electricity generation of industrial enterprises above the designated size (100 million kWh) |
9363 |
1.6 |
64193 |
1.5 |
|
Thermal power (100 million kWh) |
6274 |
1.7 |
41753 |
-0.8 |
|
Hydropower (100 million kWh) |
1479 |
-10.1 |
8387 |
-5.5 |
|
Nuclear power (100 million kWh) |
426 |
5.9 |
3219 |
10.1 |
|
Wind power (100 million kWh) |
645 |
20.2 |
6966 |
11.6 |
|
Solar power (100 million kWh) |
538 |
15.9 |
3867 |
23.4 |
|
Sales ratio (%) |
96.6 |
-0.1 (percentage points) |
95.7 |
-0.4 (percentage points) |
|
Export delivery value (100 million yuan) |
13029 |
-0.4 |
101340 |
3.0 |
Annotations:
1. Explanation on Indicators
Growth rate of value added of the industrial enterprises: also known as industrial growth rate, which is used to reflect the changes in the volume of industrial production over a given period. The indicator can be used to estimate the short-term trend of the industrial economy, and to judge the range of the economic expansion. It is also an important reference and basis for the formulation and adjustment of economic policies, and for the implementation of macroeconomic adjustment and control.
Sales ratio: refers to a ratio of sales value to total industrial output value, which reflects the situation between production and sales of industrial products.
Export delivery value: refers to the value of products exported by industrial enterprises (including those sold to Hong Kong, Macao and Taiwan) or handed over to foreign trade departments for export, and the value of products produced by foreign companies such as samples, materials processing, parts assembly and compensation trade.
Average daily product output: the total production released by the industrial enterprises above the designated size in the current month divided by the number of days in the month.
2. Statistical Coverage
The statistical coverage of industrial enterprises above the designated size was industrial enterprises with annual revenue from primary business of 20 million yuan or above.
As the coverage of industrial enterprises above the designated size changes every year, to ensure the comparability between the data of the current year and those of the previous year, when calculating the year-on-year growth rates of output and other indicators, data of the previous year have been adjusted according to the statistical coverage of the current year, and thus vary with those released in the previous year in statistical coverage. The main reasons are: (1) The statistical coverage changes. Each year, some enterprises are included in the survey once they reach the requisite size, while others exit the survey as their scale decreases. The coverage is also affected by newly established enterprises, bankruptcies and enterprises whose business licenses have been cancelled (revoked). (2) There is cross-regional repeated calculation in the output data of some enterprise groups (companies), which has been eliminated according to specific surveys.
3. Survey Methods
The reports of industrial enterprises above the designated size are conducted with complete survey on a monthly basis (excluding the report for January).
4. Industrial Classification Standard
The Industrial Classification for National Economic Activities (GB/T 4754-2017) is implemented.
5. Revision on Month-on-Month Data
According to the results of automatic correction of the seasonal adjustment model, the month-on-month growth rates of the total value added of the industrial enterprises above the designated from August 2024 to July 2025 are revised. The revised results and month-on-month data for August 2025 are as follows:
|
Year |
Month |
Growth Rate M/M (%) |
|
2024 |
August |
0.39 |
|
September |
0.66 | |
|
October |
0.44 | |
|
November |
0.50 | |
|
December |
0.60 | |
|
2025 |
January |
0.62 |
|
February |
0.73 | |
|
March |
0.39 | |
|
April |
0.17 | |
|
May |
0.61 | |
|
June |
0.50 | |
|
July |
0.38 | |
|
August |
0.37 |