Energy Production in August 2025
In August, the decline in raw coal production of industrial enterprises above the designated size narrowed, the growth of crude oil production accelerated, and the production of natural gas and electricity maintained steady growth.
I. Production of Raw Coal, Crude Oil and Natural Gas and Related Information
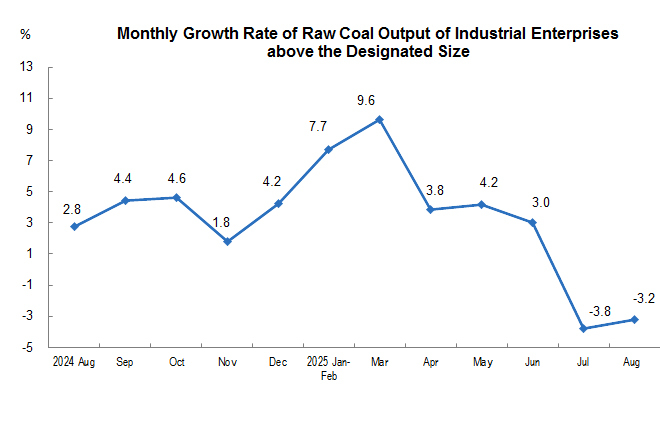
The decline in raw coal production narrowed. In August, the raw coal output of industrial enterprises above the designated size totaled 390 million tons, down by 3.2% year on year, and the decline was 0.6 percentage points narrower month on month. The average daily output was 12.60 million tons.
From January to August, the raw coal output of industrial enterprises above the designated size amounted to 3.17 billion tons, up by 2.8% year on year.
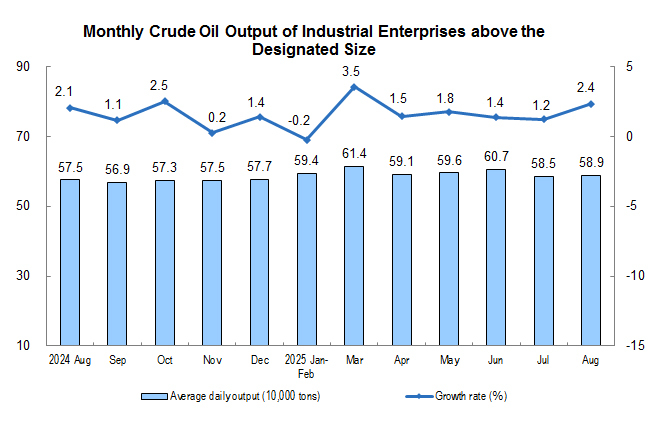
The growth of crude oil production accelerated. In August, the crude oil output of industrial enterprises above the designated size totaled 18.26 million tons, up by 2.4% year on year, and the growth was 1.2 percentage points higher month on month. The average daily output was 589,000 tons.
From January to August, the crude oil output of industrial enterprises above the designated size reached 144.86 million tons, up by 1.4% year on year.
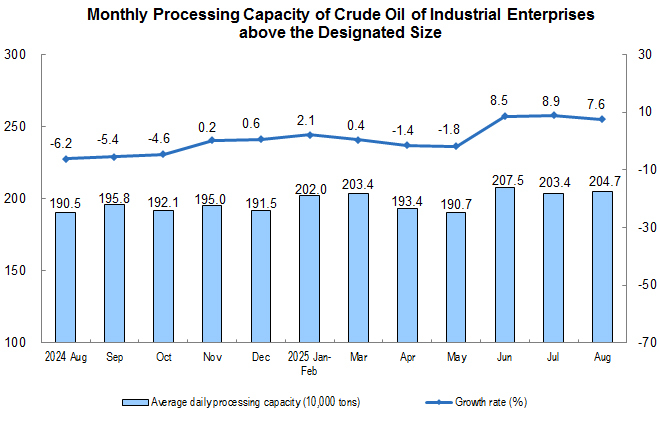
Processing of crude oil recorded fast growth. In August, the crude oil processing capacity of industrial enterprises above the designated size amounted to 63.46 million tons, a year-on-year increase of 7.6%. The average daily processing capacity was 2.047 million tons.
From January to August, the crude oil processing capacity of industrial enterprises above the designated size totaled 488.07 million tons, a year-on-year increase of 3.2%.
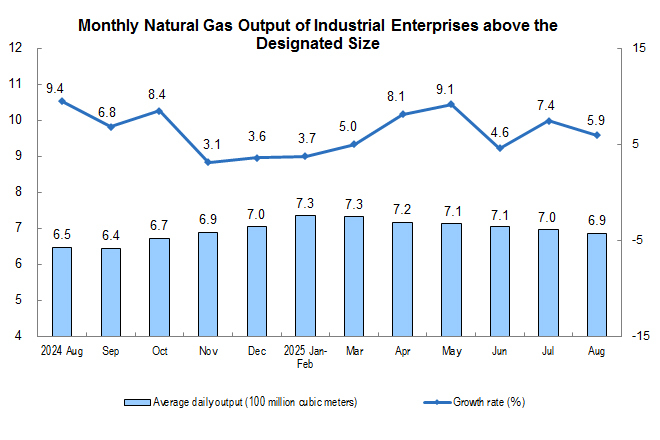
Natural gas production maintained steady growth. In August, the natural gas output of industrial enterprises above the designated size reached 21.2 billion cubic meters, up by 5.9% year on year. The average daily output was 690 million cubic meters.
From January to August, the natural gas output of industrial enterprises above the designated size totaled 173.7 billion cubic meters, a year-on-year increase of 6.1%.
II. Electricity Production
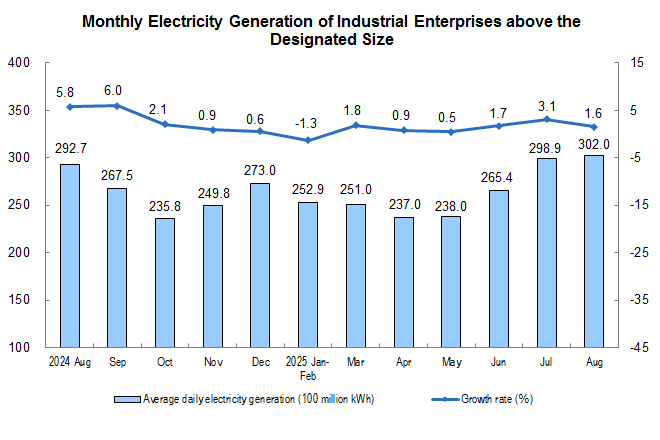
The electricity production of industrial enterprises above the designated size grew steadily. In August, the electricity generation of industrial enterprises above the designated size was 936.3 billion kWh, up by 1.6% year on year. The average daily electricity generation surpassed 30 billion kWh for the first time and reached 30.20 billion kWh. From January to August, the electricity generation of industrial enterprises above the designated size grew by 1.5% year on year to 6,419.3 billion kWh. After deducting the factor of the number of days, the average daily electricity generation gained by 1.9% year on year.
By categories, in August, wind power generation of industrial enterprises above the designated size grew at a faster pace, while the decline of hydropower generation expanded, and the growth of thermal power, nuclear power, and solar power generation slowed down. Specifically, thermal power generation of industrial enterprises above the designated size rose by 1.7% year on year, and the increase was 2.6 percentage points lower than that of July; hydropower generation of industrial enterprises above the designated size fell by 10.1% year on year, and the decline was 0.3 percentage points higher month on month; nuclear power generation of industrial enterprises above the designated size expanded by 5.9% year on year, yet the increase was 2.4 percentage points slower than that of July; wind power generation of industrial enterprises above the designated size surged by 20.2% year on year, and the growth was 14.7 percentage points higher month on month; solar power generation of industrial enterprises above the designated size grew by 15.9% year on year, yet the growth was 12.8 percentage points lower than that of July.
Annotations:
1. Explanation on Indicators
Average daily output is calculated by dividing the total output of industrial enterprises above the designated size, as released in the current month, by the number of calendar days in that month.
2. Statistical Coverage
Statistically, the output data in this report cover the industrial enterprises above the designated size, which refer to the industrial enterprises with an annual main business income of 20 million yuan or above.
As the coverage of industrial enterprises above the designated size changes every year, to ensure the comparability between the data of the current year and those of the previous year, when calculating the year-on-year growth rates of output and other indicators, data of the previous year have been adjusted according to the statistical coverage of the current year, and thus vary with those released in the previous year in statistical coverage.