Energy Production in July 2025
In July, the production of coal by industrial enterprises above the designated size declined. Instead, the production of crude petroleum oil increased steadily, while growth rates of the production of natural gas and electricity increased.
I. Coal, Crude Petroleum Oil and Natural Gas Production and Relevant Information
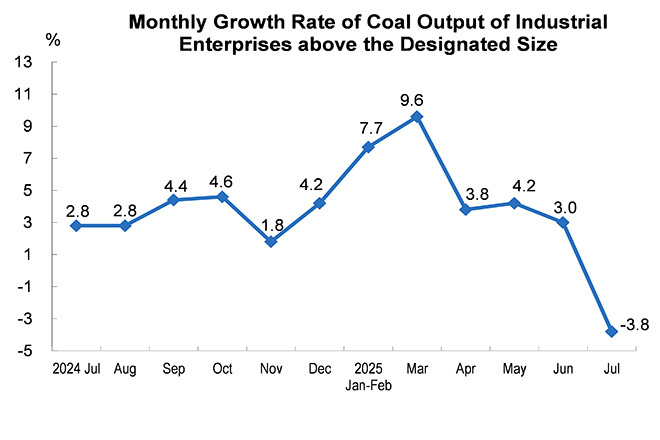
The production of coal production declined. In July, 380 million tons of coal were produced by industrial enterprises above the designated size, down by 3.8 percent year on year, with an average daily output of 12.29 million tons.
From January to July, 2.78 billion tons of coal were produced by industrial enterprises above the designated size, up by 3.8 percent year on year.
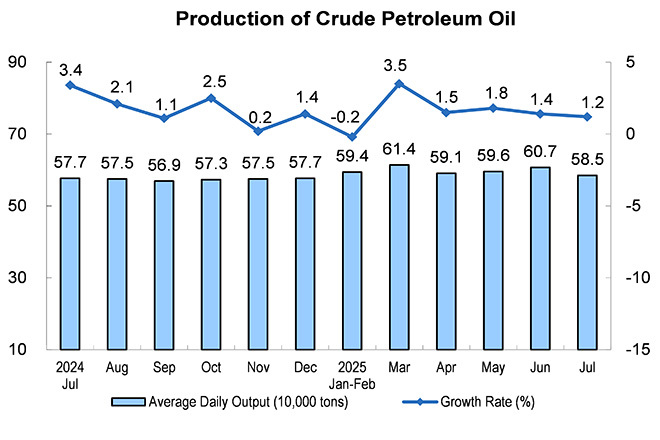
Crude petroleum oil production maintained steady growth. In July, 18.12 million tons of crude petroleum oil were produced by industrial enterprises above the designated size, up by 1.2 percent year on year, a growth rate of 0.2 percentage points lower than that in June, with an average daily output of 585,000 tons.
From January to July, 126.60 million tons of crude petroleum oil were produced by industrial enterprises above the designated size, up by 1.3 percent year on year.
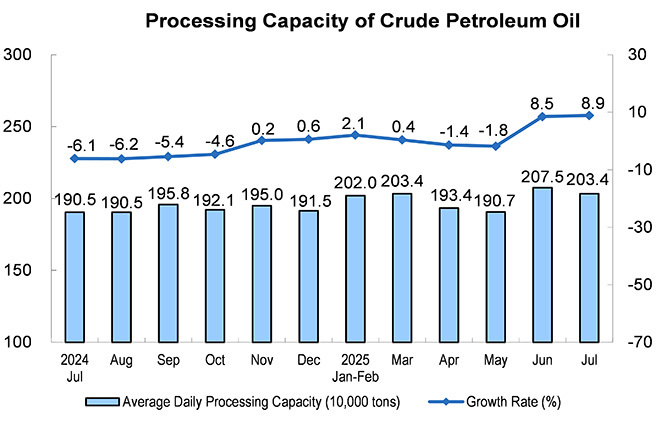
The growth rate of crude petroleum oil processing increased. In July, 63.06 million tons of crude petroleum oil were processed by industrial enterprises above the designated size, up by 8.9 percent year on year, a growth rate of 0.4 percentage points higher than that in June, with an average daily processing capacity of 2.034 million tons.
From January to July, 424.68 million tons of crude petroleum oil were produced by industrial enterprises above the designated size, up by 2.6 percent year on year.
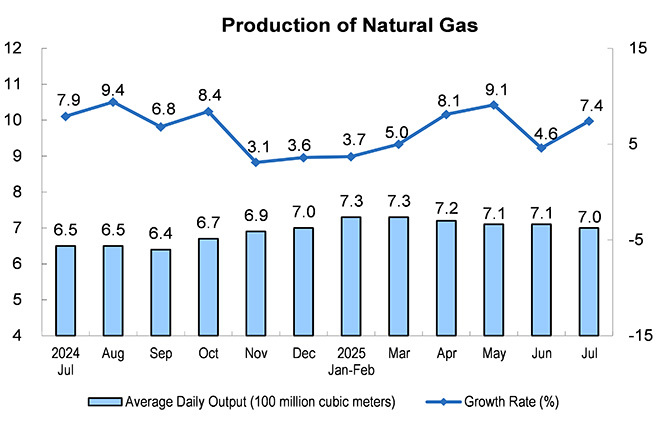
The growth rate of natural gas production increased. In July, 21.6 billion cubic meters of natural gas were produced by industrial enterprises above the designated size, up by 7.4 percent year on year, a growth rate of 2.8 percentage points higher than that in June, with an average daily output of 700.00 million cubic meters.
From January to July, 152.5 billion cubic meters of natural gas were produced by industrial enterprises above the designated size, up by 6.0 percent year on year.
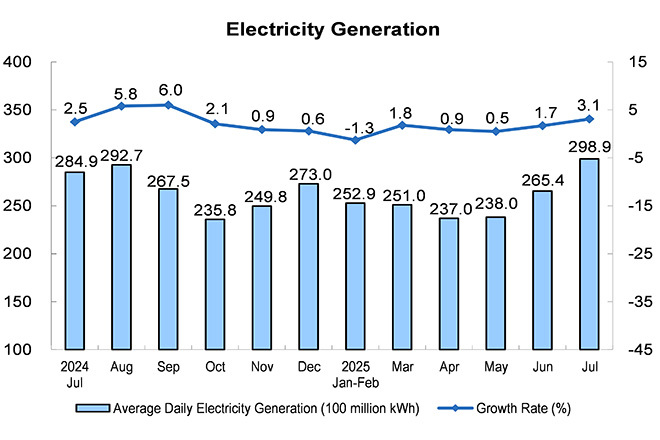
II. Electricity Generation
The power generation of industrial enterprises above the designated size accelerated. In July, 926.7 billion kilowatt-hours of electricity were generated by industrial enterprises above the designated size, up by 3.1 percent year on year, a growth rate of 1.4 percentage points higher than that in June, with an average daily electricity generation capacity of 29.89 billion kilowatt-hours. From January to July, 5,470.3 billion kilowatt-hours of electricity were generated by industrial enterprises above the designated size, up by 1.3 percent year on year, with a year-on-year increase in an average daily electricity generation capacity of 1.8 percent after deducting day factors.
From the perspective of energy sources, in July, the growth rate of thermal power, wind power and solar power generated by industrial enterprises above the designated size increased, the decline in hydropower generation expanded, and the growth rate of nuclear-power generation moderated. Among them, the thermal power generated by industrial enterprises above the designated size increased by 4.3 percent year on year, a growth rate of 3.2 percentage points higher than that in June; the hydropower generated by industrial enterprises above the designated size decreased by 9.8 percent, with a decline expanding by 5.8 percentage points compared to June; the nuclear-power generated by industrial enterprises above the designated size increased by 8.3 percent, with a deceleration of 2.0 percentage points from June; the wind power generated by industrial enterprises above the designated size increased by 5.5 percent, a growth rate of 2.3 percentage points higher than that in June; and the solar power generated by industrial enterprises above the designated size increased by 28.7 percent, a growth rate of 10.4 percentage points higher than that in June.
Annotations:
1. Explanatory Notes
Average daily product output: It is calculated by dividing the total output of industrial enterprises above the designated size announced in that month by the calendar days in that month.
2. Statistical Coverage
The statistical caliber of the output data in the report is the industrial enterprises above the designated size, and the statistical scope involves industrial enterprises with an annual main business revenue of 20 million yuan and above.
Because the scope of industrial enterprises above the designated size changes every year, to ensure that this year's data is comparable with the previous year's, the cumulative figures for the same period last year used to calculate year-on-year growth rates for product output and other indicators are consistent with the statistical scope of enterprises in the current period. There may also be a discrepancy in statistical standards and coverage between the data released this year and last year.