Consumer Price Index in July 2025
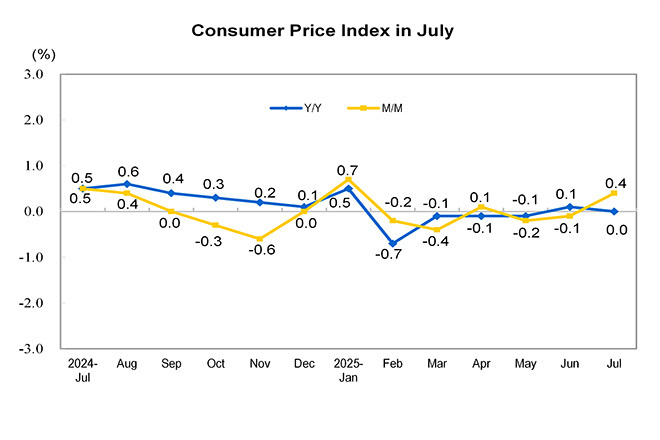
In July 2025, the national consumer price index (CPI) remained flat year on year. Among them, the price in urban areas remained flat while the price in rural areas decreased by 0.3 percent; the price for food decreased by 1.6 percent, while that for nonfood increased by 0.3 percent; prices for consumer goods decreased by 0.4 percent, while that for services increased by 0.5 percent. From January to July, on average, the national CPI decreased by 0.1 percent over the same period last year.
In July, the national CPI increased by 0.4 percent month on month. Among them, the price in urban areas increased by 0.4 percent and the price in rural areas increased by 0.3 percent; the price for food decreased by 0.2 percent, while that for nonfood increased by 0.5 percent; prices for consumer goods increased by 0.2 percent and for services increased by 0.6 percent.
I. Year-on-Year Changes in Prices of Various Goods and Services
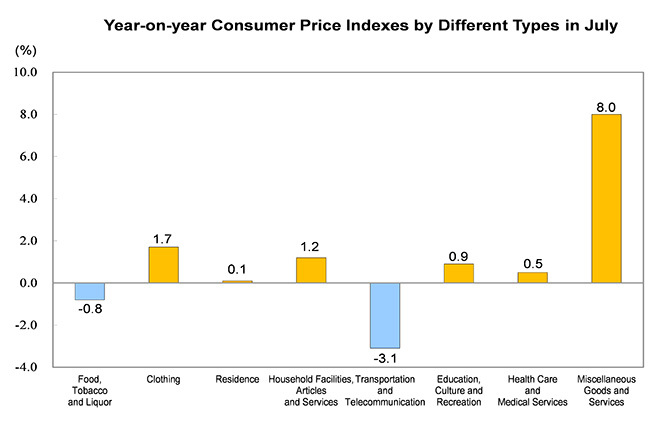
In July, prices for food, tobacco and liquor decreased by 0.8 percent year on year, affecting the CPI decreased by about 0.21 percentage points. Among food categories, prices for eggs decreased by 11.2 percent, affecting the CPI decreased by about 0.07 percentage points; prices for fresh vegetables decreased by 7.6 percent, affecting the CPI decreased by about 0.16 percentage points; the price for meat of livestock decreased by 4.6 percent, affecting the CPI decreased by about 0.14 percentage points, of which the price for pork decreased by 9.5 percent, affecting the CPI decreased by about 0.13 percentage points; the price for grain decreased by 1.0 percent, affecting the CPI decreased by about 0.02 percentage points; prices for aquatic products increased by 3.4 percent, affecting the CPI increased by about 0.07 percentage points; prices for fresh fruits increased by 2.8 percent, affecting the CPI increased by about 0.06 percentage points.
Prices for the other seven major categories increased six and decreased one year on year. Specifically, prices for miscellaneous goods and services, clothing, and household facilities, articles and services increased by 8.0, 1.7 and 1.2 percent respectively; prices for education, culture and recreation, health care and medical services, and residence increased by 0.9, 0.5 and 0.1 percent respectively; the price for transportation and telecommunication decreased by 3.1 percent.
II. Month-on-Month Changes in Prices of Various Goods and Services
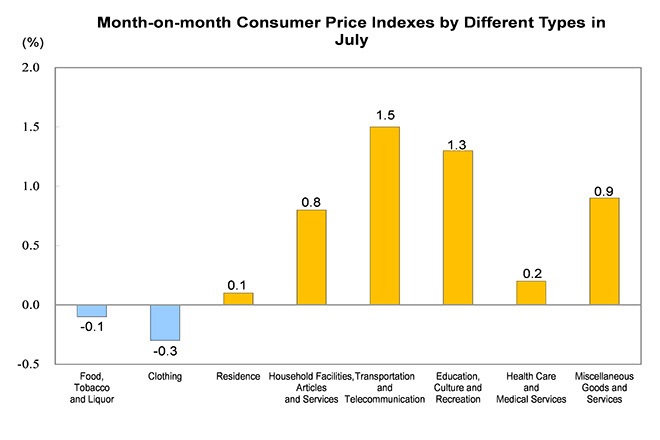
In July, prices for food, tobacco and liquor decreased by 0.1 percent month on month, affecting the CPI decreased by about 0.04 percentage points. Among food categories, prices for fresh fruits decreased by 3.4 percent, affecting the CPI decreased by about 0.07 percentage points; prices for fresh vegetables increased by 1.3 percent, affecting the CPI increased by about 0.03 percentage points; the price for meat of livestock increased by 0.4 percent, affecting the CPI increased by about 0.01 percentage points, of which the price for pork increased by 0.9 percent, affecting the CPI increased by about 0.01 percentage points; prices for aquatic products increased by 0.4 percent, affecting the CPI increased by about 0.01 percentage points.
Prices for the other seven major categories increased six and decreased one month on month. Among them, prices for transportation and telecommunication, education, culture and recreation, and miscellaneous goods and services increased by 1.5, 1.3 and 0.9 percent respectively; prices for household facilities, articles and services, health care and medical services, and residence increased by 0.8, 0.2 and 0.1 percent respectively; the price for clothing decreased by 0.3 percent.
Consumer Price Index in July 2025
|
|
Growth Rate M/M (%) |
Growth Rate Y/Y (%) |
Jan-Jul Growth Rate Y/Y (%) |
|
Consumer Price Index |
0.4 |
0.0 |
-0.1 |
|
Of which: Urban |
0.4 |
0.0 |
0.0 |
|
Rural |
0.3 |
-0.3 |
-0.3 |
|
Of which: Food |
-0.2 |
-1.6 |
-1.0 |
|
Non-food |
0.5 |
0.3 |
0.1 |
|
Of which: Consumer goods |
0.2 |
-0.4 |
-0.4 |
|
Services |
0.6 |
0.5 |
0.4 |
|
Of which: Excluding food and energy |
0.4 |
0.8 |
0.5 |
|
By commodity categories |
|
|
|
|
I. Food, tobacco and liquor |
-0.1 |
-0.8 |
-0.3 |
|
Grain |
0.0 |
-1.0 |
-1.3 |
|
Edible oil and fats |
-0.1 |
-1.4 |
-1.9 |
|
Fresh vegetables |
1.3 |
-7.6 |
-5.6 |
|
Meat of livestock |
0.4 |
-4.6 |
-1.0 |
|
Of which: Pork |
0.9 |
-9.5 |
1.7 |
|
Beef |
0.0 |
3.6 |
-5.5 |
|
Mutton |
-0.1 |
-1.4 |
-3.9 |
|
Aquatic products |
0.4 |
3.4 |
1.1 |
|
Eggs |
-0.3 |
-11.2 |
-3.8 |
|
Milk and other dairy products |
-0.3 |
-1.3 |
-1.4 |
|
Fresh fruits |
-3.4 |
2.8 |
2.7 |
|
Cigarettes |
0.0 |
0.1 |
0.3 |
|
Liquor |
0.0 |
-1.9 |
-2.0 |
|
II. Clothing |
-0.3 |
1.7 |
1.4 |
|
Garments |
-0.3 |
1.8 |
1.5 |
|
Footwear |
-0.4 |
1.2 |
0.7 |
|
III. Residence |
0.1 |
0.1 |
0.1 |
|
Rent of rental housing |
0.1 |
-0.1 |
-0.1 |
|
Water, electricity and fuels |
0.1 |
0.5 |
0.4 |
|
IV. Household facilities, articles and services |
0.8 |
1.2 |
0.2 |
|
Home appliances |
2.2 |
2.8 |
-0.5 |
|
Household services |
0.1 |
1.7 |
2.2 |
|
V. Transportation and telecommunication |
1.5 |
-3.1 |
-3.0 |
|
Transport facility |
0.0 |
-2.1 |
-3.5 |
|
Fuels for transport facility |
3.5 |
-9.0 |
-7.3 |
|
Use and maintenance of transport facility |
0.0 |
0.3 |
0.2 |
|
Communication facilities |
0.3 |
0.1 |
0.7 |
|
Telecommunication services |
0.0 |
0.0 |
0.0 |
|
Postal services |
0.0 |
-0.2 |
-0.1 |
|
VI. Education, culture and recreation |
1.3 |
0.9 |
0.8 |
|
Education services |
0.0 |
1.1 |
1.2 |
|
Touring |
9.1 |
0.5 |
-0.4 |
|
VII. Health care and medical services |
0.2 |
0.5 |
0.3 |
|
Traditional Chinese medicines |
-0.5 |
-0.6 |
0.2 |
|
Western medicines |
0.0 |
-1.2 |
-1.2 |
|
Medical services |
0.3 |
1.1 |
0.7 |
|
VIII. Miscellaneous goods and services |
0.9 |
8.0 |
6.9 |
Annotations:
1. Explanatory Notes
Consumer Price Indexes are relative figures that measure variations in the price level of consumer goods and services over time, comprehensively reflecting changes in prices of consumer goods and services purchased by residents.
2. Statistical Coverage
The consumer price index (CPI) covers the prices of goods and services of 8 categories and 268 basic divisions which cover the living consumption of urban and rural residents, including food, tobacco and liquor; clothing; residence; household facilities, articles and services; transportation and telecommunication; education, culture and recreation; health care and medical services; miscellaneous goods and services.
3. Survey Methods
Sampling survey methodology is adopted to select and determine survey sites, and according to the principle of "fixed person, fixed point and fixed time", statisticians are directly sent to the survey sites or collect the original price from the Internet. The data comes from about 500 cities and counties in 31 provinces (autonomous regions and municipalities) and nearly 100,000 price survey points, including shopping malls (stores), supermarkets, farmers' markets (fresh produce), service outlets and Internet e-commerce.
4. Data Description
Due to rounding-off, the aggregate data may be equal to the high or low value of the classified data.