Industrial Production Operation in June 2025
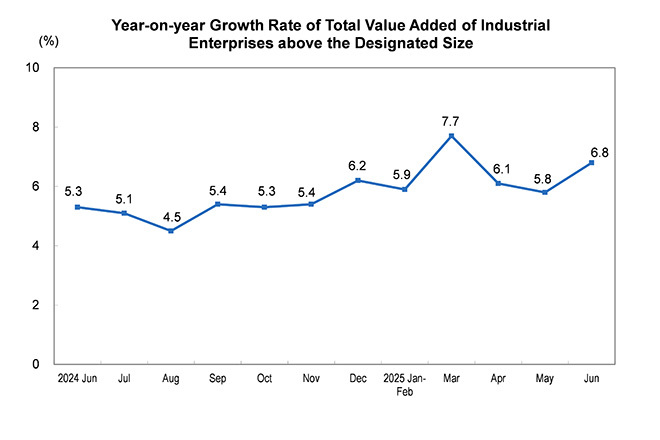
In June, the total value added of industrial enterprises above the designated size increased by 6.8 percent year on year (the growth rates of value added are the real growth rates after deducting price factors). On a month-on-month basis, in June, the total value added of industrial enterprises above the designated size increased by 0.50 percent over the previous month. From January to June, the value added of industrial enterprises above the designated size increased by 6.4 percent compared to the previous year.
In terms of sectors, in June, the value added of the mining industry increased by 6.1 percent year on year, that of the manufacturing industry increased by 7.4 percent, and that of the production and supply of electricity, heat power, gas and water increased by 1.8 percent.
In terms of ownership, in June, the value added of state-holding enterprises increased by 5.7 percent year on year; that of share-holding enterprises increased by 7.1 percent; that of enterprises funded by foreign investors and investors from Hong Kong, Macao and Taiwan increased by 5.5 percent; and that of private enterprises increased by 6.2 percent.
From the perspective of industries, in June, 36 out of 41 major industries maintained year-on-year growth in value added. Among them, the value added of the mining and washing of coal went up by 6.5 percent, that of the extraction of petroleum and natural gas up by 3.6 percent, that of the processing of food from agricultural and sideline products up by 8.2 percent, that of the manufacture of liquor, beverages and refined tea up by 3.4 percent, that of the textile industry up by 2.5 percent, that of the manufacture of raw chemical materials and chemical products up by 7.5 percent, that of the manufacture of non-metallic mineral products down by 0.1 percent, that of the smelting and pressing of ferrous metals up by 4.1 percent, that of the smelting and pressing of non-ferrous metals up by 9.2 percent, that of the manufacture of general purpose machinery up by 7.8 percent, that of the manufacture of special purpose machinery up by 4.6 percent, that of the manufacture of automobiles up by 11.4 percent, that of the manufacture of railway, ship, aerospace and other transport equipment up by 10.1 percent, that of the manufacture of electrical machinery and apparatus up by 11.4 percent, that of the manufacture of computers, communication equipment and other electronic equipment up by 11.0 percent, and that of the production and supply of electricity and heat power up by 1.6 percent.
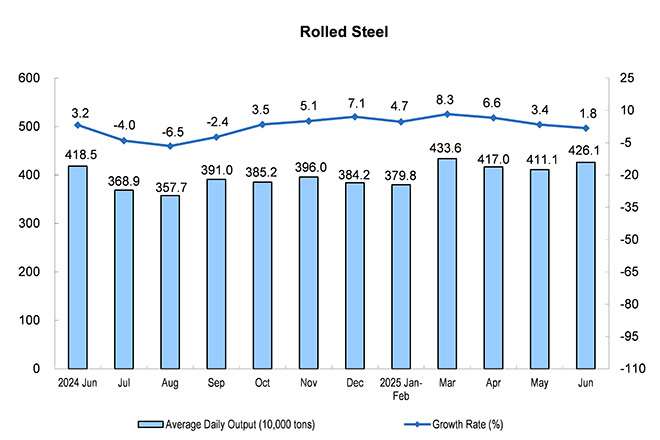
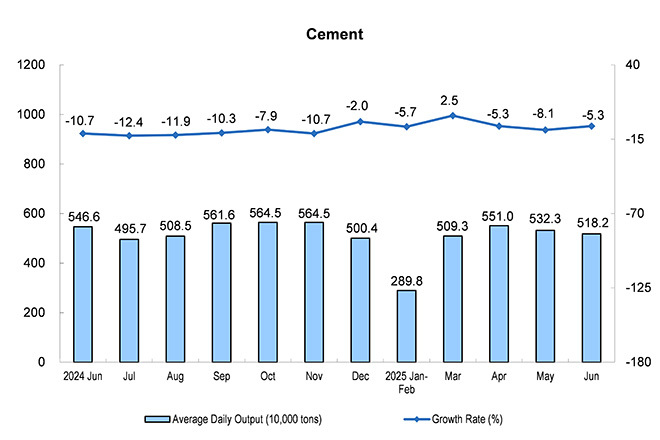
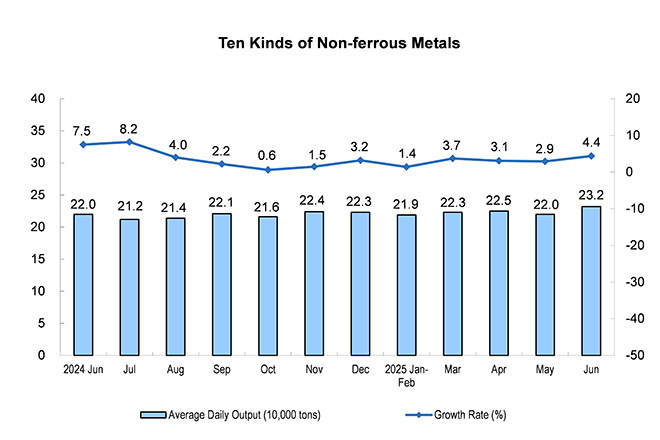
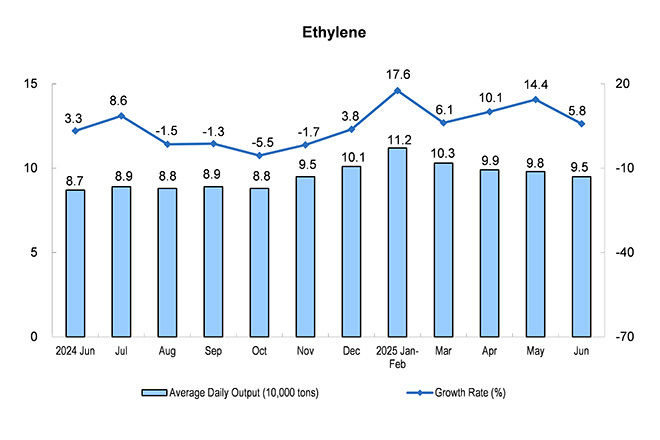
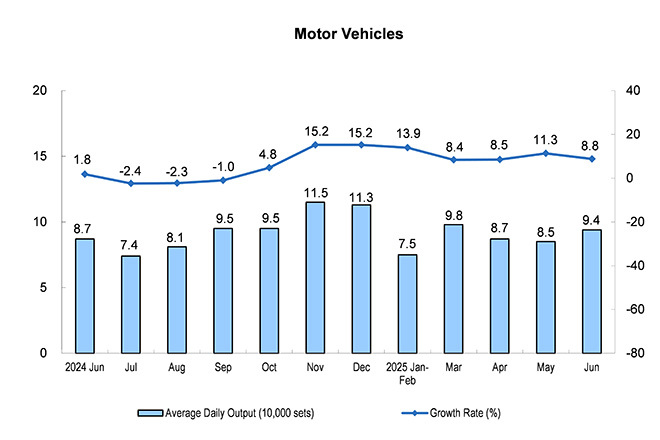
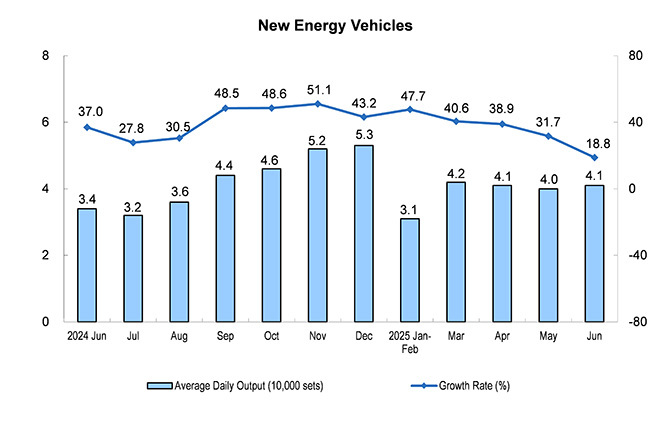
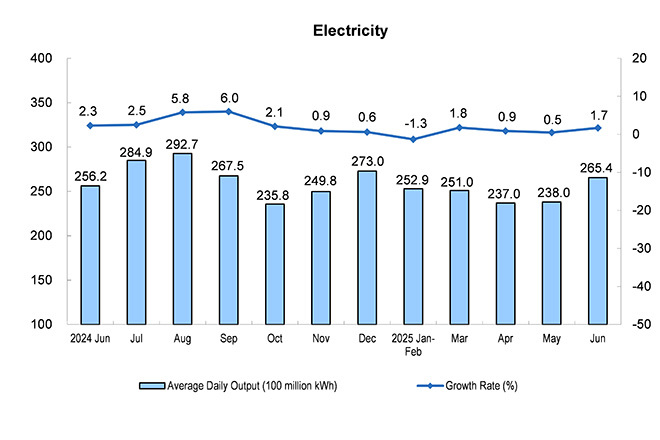
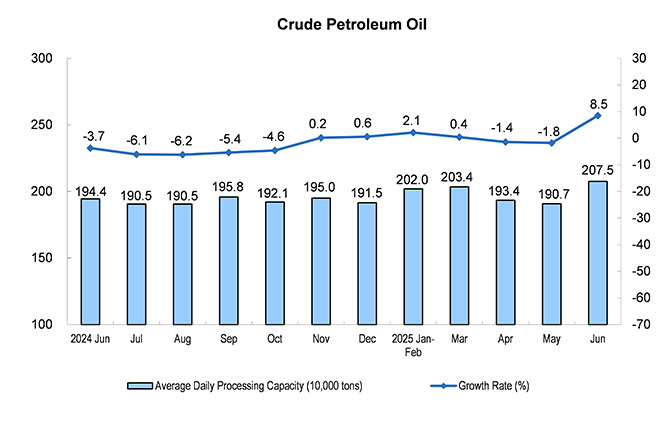
In terms of products, in June, 379 out of 623 products produced by industrial enterprises above the designated size saw year-on-year output growth. Among them, the output of rolled steel was 127.84 million tons, up by 1.8 percent year on year; that of cement was 155.47 million tons, down by 5.3 percent; that of ten kinds of non-ferrous metals was 6.95 million tons, up by 4.4 percent; that of ethylene was 2.85 million tons, up by 5.8 percent; that of motor vehicles was 2,809,000 sets, up by 8.8 percent, including 1,234,000 new energy vehicles, up by 18.8 percent; the electricity generation was 796.3 billion kilowatt-hours, up by 1.7 percent; and the crude processing capacity was 62.24 million tons, up by 8.5 percent.
In June, the product sales rate of industrial enterprises above the designated size was 94.3 percent, a year-on-year decrease of 0.3 percentage points; and the export delivery value realized by industrial enterprises above the designated size stood at 1,367.6 billion yuan, a nominal increase of 4.0 percent year on year.
Industrial Production Operation in June 2025
|
Indicators |
June |
Jan-Jun | ||
|
Absolute Value |
Growth Rate Y/Y (%) |
Absolute Value |
Growth Rate Y/Y (%) | |
|
Value-added of Industries Above the Designated Size |
… |
6.8 |
… |
6.4 |
|
Grouped by three sectors |
|
|
|
|
|
Mining |
… |
6.1 |
… |
6.0 |
|
Manufacturing |
… |
7.4 |
… |
7.0 |
|
Of which: High technology manufacturing industry |
… |
9.7 |
… |
9.5 |
|
Production and supply of electricity, heat power, gas and water |
… |
1.8 |
… |
1.9 |
|
Grouped by ownership |
|
|
|
|
|
Of which: State-holding enterprises |
… |
5.7 |
… |
4.2 |
|
Of which: Share-holding enterprises |
… |
7.1 |
… |
6.9 |
|
Enterprises funded by foreign investors and investors from Hong Kong, Macao and Taiwan |
… |
5.5 |
… |
4.3 |
|
Of which: Private enterprises |
… |
6.2 |
… |
6.7 |
|
Value-Added of the Main Sectors |
|
|
|
|
|
Mining and washing of coal |
… |
6.5 |
… |
6.6 |
|
Extraction of petroleum and natural gas |
… |
3.6 |
… |
3.7 |
|
Processing of food from agricultural and sideline products |
… |
8.2 |
… |
7.5 |
|
Manufacture of foods |
… |
6.4 |
… |
6.3 |
|
Manufacture of liquor, beverages and refined tea |
… |
3.4 |
… |
4.7 |
|
Textile industry |
… |
2.5 |
… |
4.1 |
|
Manufacture of raw chemical materials and chemical products |
… |
7.5 |
… |
8.2 |
|
Manufacture of medicines |
… |
2.7 |
… |
1.3 |
|
Manufacture of rubber and plastics products |
… |
6.7 |
… |
7.1 |
|
Manufacture of non-metallic mineral products |
… |
-0.1 |
… |
-0.5 |
|
Smelting and pressing of ferrous metals |
… |
4.1 |
… |
5.6 |
|
Smelting and pressing of non-ferrous metals |
… |
9.2 |
… |
7.6 |
|
Manufacture of metal products |
… |
6.7 |
… |
8.8 |
|
Manufacture of general purpose machinery |
… |
7.8 |
… |
8.3 |
|
Manufacture of special purpose machinery |
… |
4.6 |
… |
3.8 |
|
Manufacture of automobiles |
… |
11.4 |
… |
11.3 |
|
Manufacture of railway, ship, aerospace and other transport equipment |
… |
10.1 |
… |
16.6 |
|
Manufacture of electrical machinery and apparatus |
… |
11.4 |
… |
12.2 |
|
Manufacture of computers, communication equipment and other electronic equipment |
… |
11.0 |
… |
11.1 |
|
Production and supply of electricity and heat power |
… |
1.6 |
… |
1.6 |
|
Output of Major Industrial Products Above the Designated Size |
|
|
|
|
|
Cloth (100 million meters) |
28 |
0.4 |
154 |
0.0 |
|
Sulfuric acid (100%) (10,000 tons) |
922 |
9.0 |
5491 |
6.3 |
|
Caustic soda (100%) (10,000 tons) |
387 |
7.0 |
2268 |
4.8 |
|
Ethylene (10,000 tons) |
285 |
5.8 |
1814 |
10.9 |
|
Chemical fiber (10,000 tons) |
736 |
4.7 |
4236 |
4.9 |
|
Cement (10,000 tons) |
15547 |
-5.3 |
81530 |
-4.3 |
|
Plate glass (10,000 weight cases) |
8271 |
-4.5 |
48497 |
-5.2 |
|
Pig iron (10,000 tons) |
7191 |
-4.1 |
43468 |
-0.8 |
|
Crude steel (10,000 tons) |
8318 |
-9.2 |
51483 |
-3.0 |
|
Rolled steel (10,000 tons) |
12784 |
1.8 |
73438 |
4.6 |
|
Ten kinds of nonferrous metals (10,000 tons) |
695 |
4.4 |
4032 |
2.9 |
|
Of which: Electrolyzed aluminum (10,000 tons) |
381 |
3.4 |
2238 |
3.3 |
|
Metal-cutting machine tools (10,000 units) |
7 |
12.7 |
40 |
13.5 |
|
Industrial robots (set) |
74764 |
37.9 |
369316 |
35.6 |
|
Service robots (set) |
1478832 |
18.3 |
8824452 |
25.5 |
|
Motor vehicles (10,000 sets) |
280.9 |
8.8 |
1556.5 |
10.8 |
|
Of which: Cars (10,000 sets) |
104.6 |
3.4 |
587.2 |
10.1 |
|
SUV (10,000 sets) |
121.2 |
12.6 |
654.5 |
10.0 |
|
Of which: New energy vehicles (10,000 sets) |
123.4 |
18.8 |
687.2 |
36.2 |
|
Power generation equipment (10,000 kilowatt-hours) |
4203 |
26.1 |
17902 |
60.5 |
|
Solar cells (photovoltaic cells) (10,000 kilowatt-hours) |
6739 |
24.1 |
37019 |
18.2 |
|
Micro computer equipment (10,000 units) |
3159 |
6.4 |
16645 |
5.6 |
|
Mobile telephones (10,000 sets) |
13411 |
2.6 |
70741 |
-4.5 |
|
Of which: Smartphone (10,000 sets) |
10827 |
8.4 |
56321 |
0.5 |
|
Integrated circuits (100 million pieces) |
451 |
15.8 |
2395 |
8.7 |
|
Coal (10,000 tons) |
42107 |
3.0 |
240456 |
5.4 |
|
Coke (10,000 tons) |
4170 |
-0.2 |
24941 |
3.0 |
|
Crude petroleum oil (10,000 tons) |
1820 |
1.4 |
10848 |
1.3 |
|
Crude processing capacity (10,000 tons) |
6224 |
8.5 |
36161 |
1.6 |
|
Natural gas (100 million cubic meters) |
212 |
4.6 |
1308 |
5.8 |
|
Electricity generation of industrial enterprises above the designated size (100 million kilowatt-hours) |
7963 |
1.7 |
45371 |
0.8 |
|
Thermal power (100 million kilowatt-hours) |
4939 |
1.1 |
29410 |
-2.4 |
|
Hydropower (100 million kilowatt-hours) |
1391 |
-4.0 |
5398 |
-2.9 |
|
Nuclear-power (100 million kilowatt-hours) |
394 |
10.3 |
2363 |
11.3 |
|
Wind power (100 million kilowatt-hours) |
738 |
3.2 |
5533 |
10.6 |
|
Solar power (100 million kilowatt-hours) |
501 |
18.3 |
2667 |
20.0 |
|
Sales ratio (%) |
94.3 |
-0.3 (percentage points) |
95.2 |
-0.4 (percentage points) |
|
Export delivery value (100 million yuan) |
13676 |
4.0 |
75204 |
4.2 |
Annotations:
1. Explanatory Notes
The growth rate of value added by industrial enterprises, also known as the industrial growth rate, is used to reflect the degree of change in industrial production indicators over a specific period. The indicator can be used to estimate the short-term trend of the industrial economy, determine the range of economic expansion, and also serves as an essential reference and basis for formulating and adjusting economic policies, as well as for implementing macroeconomic adjustments and controls.
Sales ratio: refers to a ratio of sales value to total industrial output, which reflects the situation between production and sales of industrial products.
Export delivery value: refers to the value of products exported by industrial enterprises (including those sold to Hong Kong, Macao and Taiwan) or handed over to foreign trade departments for export, and the value of products produced by foreign companies such as samples, materials processing, parts assembly and compensation trade.
Daily product output: the total production released by the industrial enterprises above the designated size in the current month divided by the number of days in the month.
2. Statistical Coverage
The standard starting point of industrial enterprises above the designated size was 20 million yuan of annual revenue from primary business.
Due to the annual changes of the coverage of industrial enterprises above the designated size, and in order to ensure that the data for this year is comparable with that for the previous year, the data of the corresponding period used for calculating the year-on-year growth rates of various indicators such as product output is as consistent with the enterprise statistical coverage of the current period as possible, and there is a difference in caliber from the data published last year. The main reasons are: (1) The scope of statistical units changes. Each year, some companies will be included in the survey after having reached the requisite size, and some will exit the survey due to their smaller scale, and there are also the effects of enterprises that are newly established, bankrupt and enterprises with their business licenses cancelled (revoked). (2) There is cross-regional repeated calculation in the output data of some enterprise group (company) products, which has been eliminated according to specific surveys.
3. Survey Methods
Reports on industrial enterprises above the designated size are conducted through a comprehensive survey on a monthly basis (excluding the report for January).
4. Standard on Industrial Classification
The Industrial Classification for National Economic Activities (GB/T 4754-2017) is performed.
5. Revision on Month-on-Month Data
The month-on-month growth rate of the total value added of the industrial enterprises above the designated size from June 2024 to May 2025 was revised according to the results of automatic revision of seasonal adjustment model. The revised results and the month-on-month data in June 2025 are as follows:
|
Months |
Growth Rate (%) |
|
2024-June |
0.51 |
|
July |
0.45 |
|
August |
0.39 |
|
September |
0.71 |
|
October |
0.52 |
|
November |
0.58 |
|
December |
0.64 |
|
2025-January |
0.62 |
|
February |
0.73 |
|
March |
0.44 |
|
April |
0.22 |
|
May |
0.61 |
|
June |
0.50 |