STATISTICAL COMMUNIQUÉ OF THE PEOPLE'S REPUBLIC OF CHINA ON THE 2024 NATIONAL ECONOMIC AND SOCIAL DEVELOPMENT
STATISTICAL COMMUNIQUÉ OF
THE PEOPLE'S REPUBLIC OF CHINA
ON THE 2024 NATIONAL
ECONOMIC AND SOCIAL DEVELOPMENT[1]
National Bureau of Statistics of China
February 28, 2025
The year 2024 marks the 75th anniversary of the founding of the People’s Republic of China, and is a key year for achieving the goals and targets outlined in the 14th Five-Year Plan. Faced with complex and grave environment featuring greater external pressure and increasing internal difficulties, under the strong leadership of the Central Committee of the Communist Party of China (CPC) with Comrade Xi Jinping at its core, all regions and departments took Xi Jinping Thought on Socialism with Chinese Characteristics for a New Era as the guideline, fully implemented the guiding principles of the 20th CPC National Congress, the Second and the Third Plenary Sessions of the 20th CPC Central Committee, followed the decisions and arrangements made by the CPC Central Committee and the State Council, adhered to the general working guideline of making progress while maintaining stability, fully and faithfully applied the new development philosophy on all fronts, accelerated efforts to foster a new pattern of development, strove to promote high-quality development, comprehensively deepened reform and opening up, and strengthened macro control. As a result, the national economy was generally stable with steady progress made, high-quality development was pursued with solid steps, new quality productive forces witnessed steady development, reform and opening up continued to deepen, risks in key areas were defused with well-ordered and effective measures, people’s wellbeing was strongly and effectively guaranteed, and new and solid strides were taken for Chinese modernization.
I. General Outlook
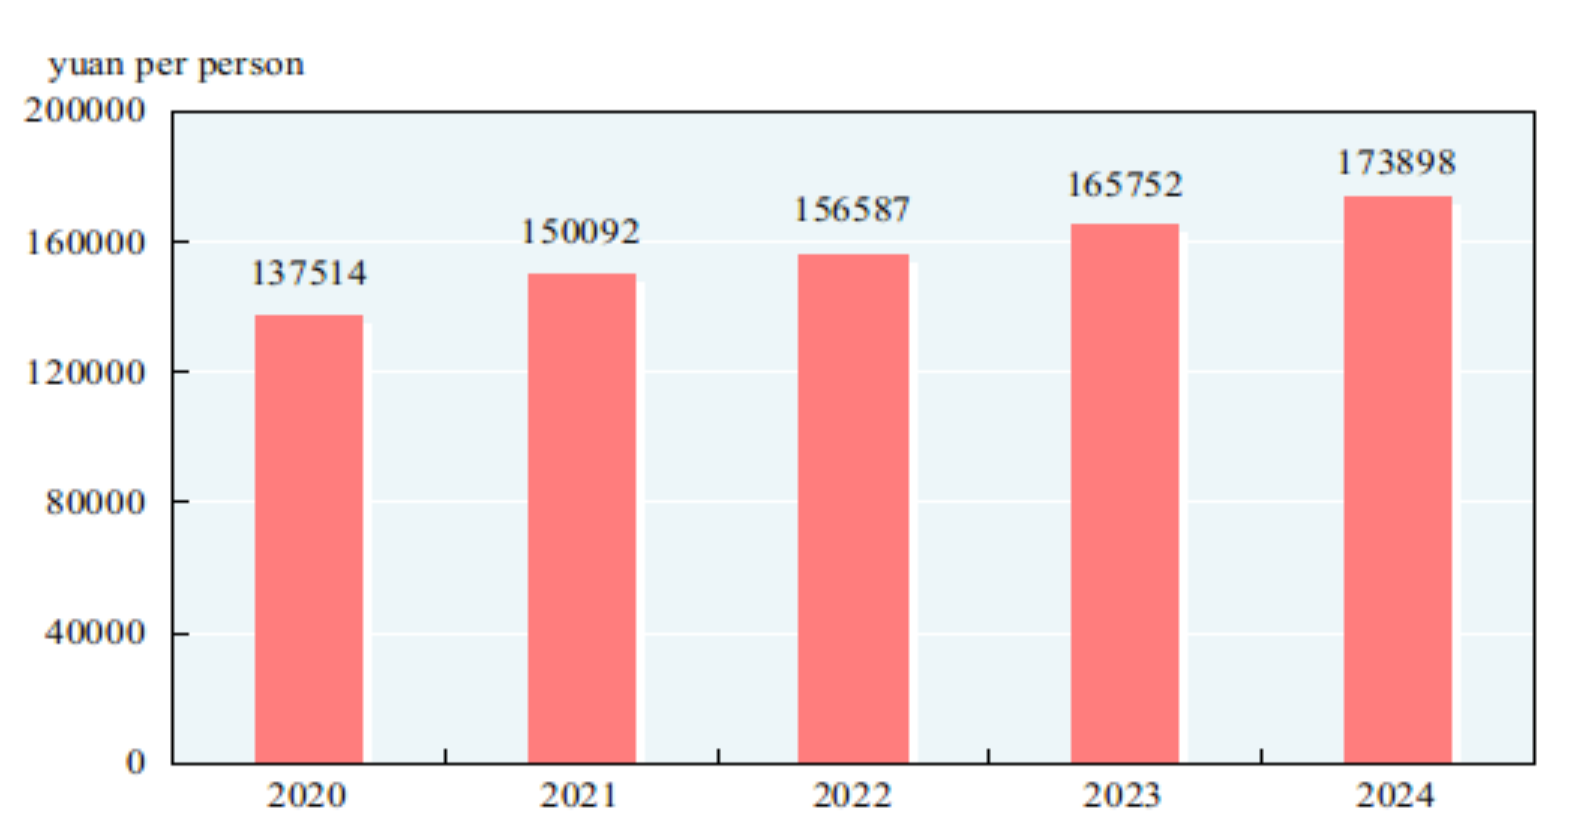
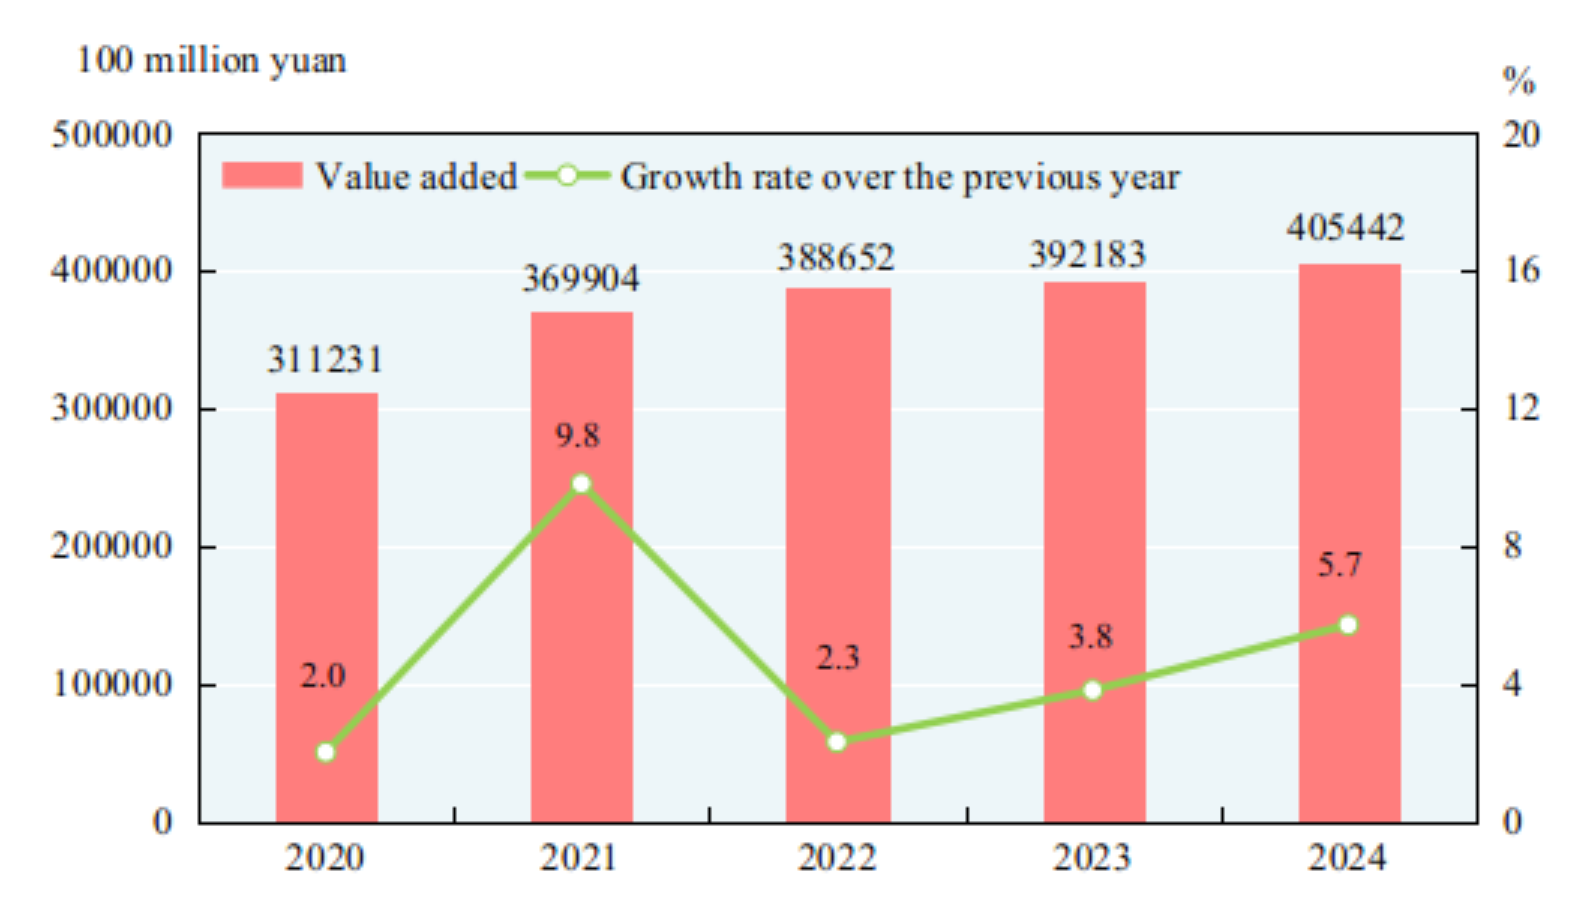
According to preliminary estimates, the gross domestic product (GDP)[2] in 2024 was 134,908.4 billion yuan, up by 5.0 percent over the previous year. Of this total, the value added of the primary industry was 9,141.4 billion yuan, up by 3.5 percent over the previous year, that of the secondary industry was 49,208.7 billion yuan, up by 5.3 percent, and that of the tertiary industry was 76,558.3 billion yuan, up by 5.0 percent. The value added of the primary industry accounted for 6.8 percent of the GDP; that of the secondary industry accounted for 36.5 percent; and that of the tertiary industry accounted for 56.7 percent. The contribution of the final consumption expenditure to GDP growth rate was up by 2.2 percentage points, that of the gross capital formation to GDP growth rate up by 1.3 percentage points and that of the net exports of goods and services to GDP growth rate up by 1.5 percentage points. By quarter, the GDP went up by 5.3 percent year on year for the first quarter, up by 4.7 percent for the second quarter, 4.6 percent for the third quarter and 5.4 percent for the fourth quarter. The per capita GDP in 2024 was 95,749 yuan, up by 5.1 percent over the previous year. The gross national income[3] in 2024 was 133,967.2 billion yuan, up by 5.1 percent over the previous year. The overall labor productivity[4] was 173,898 yuan per person, up by 4.9 percent over the previous year.
Figure 1: Gross Domestic Product and Growth Rates 2020-2024
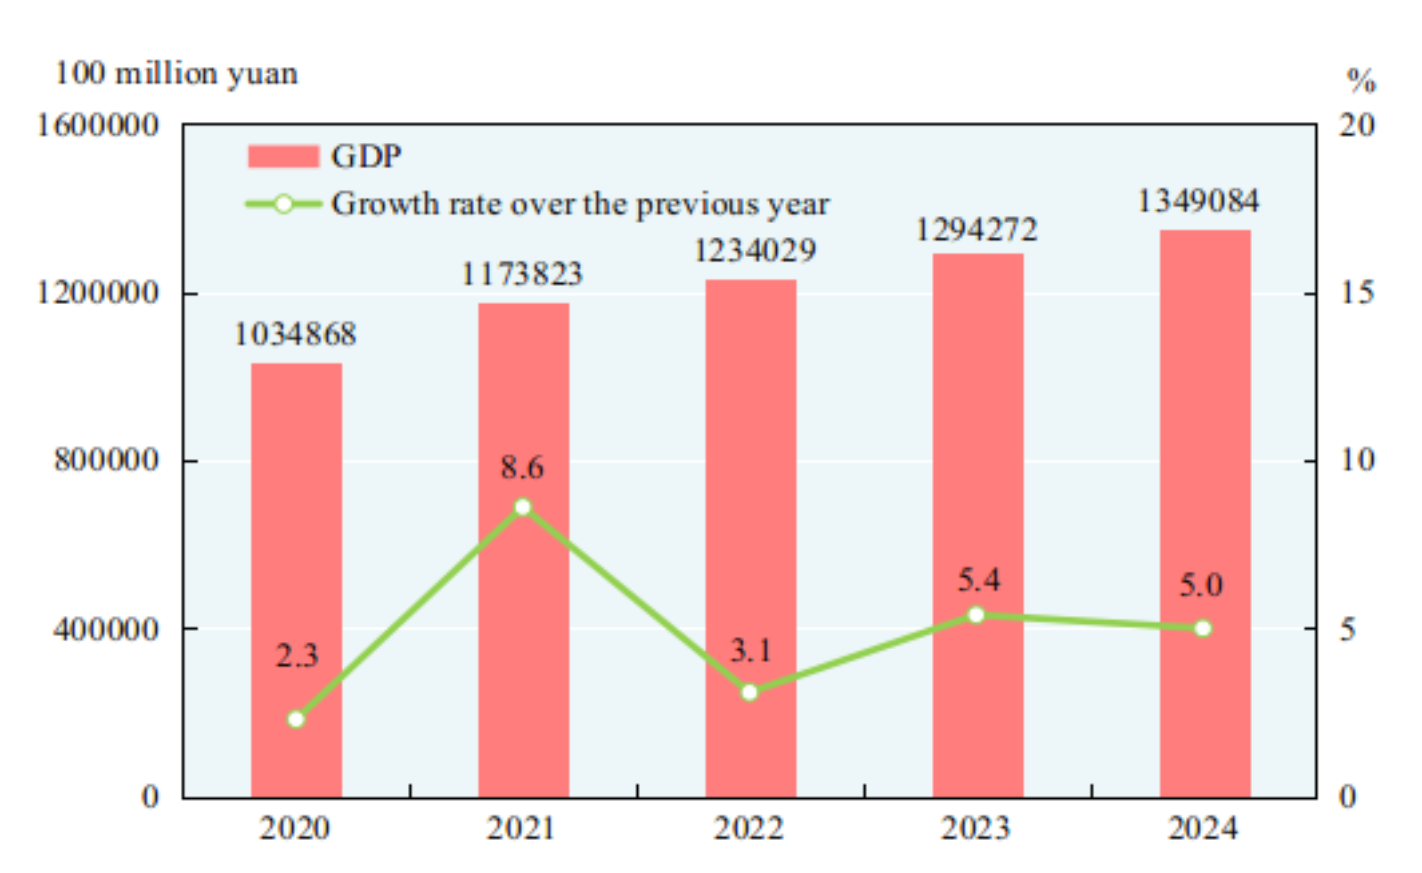
Figure 2: Shares of the Three Industries’ Value Added in GDP 2020-2024
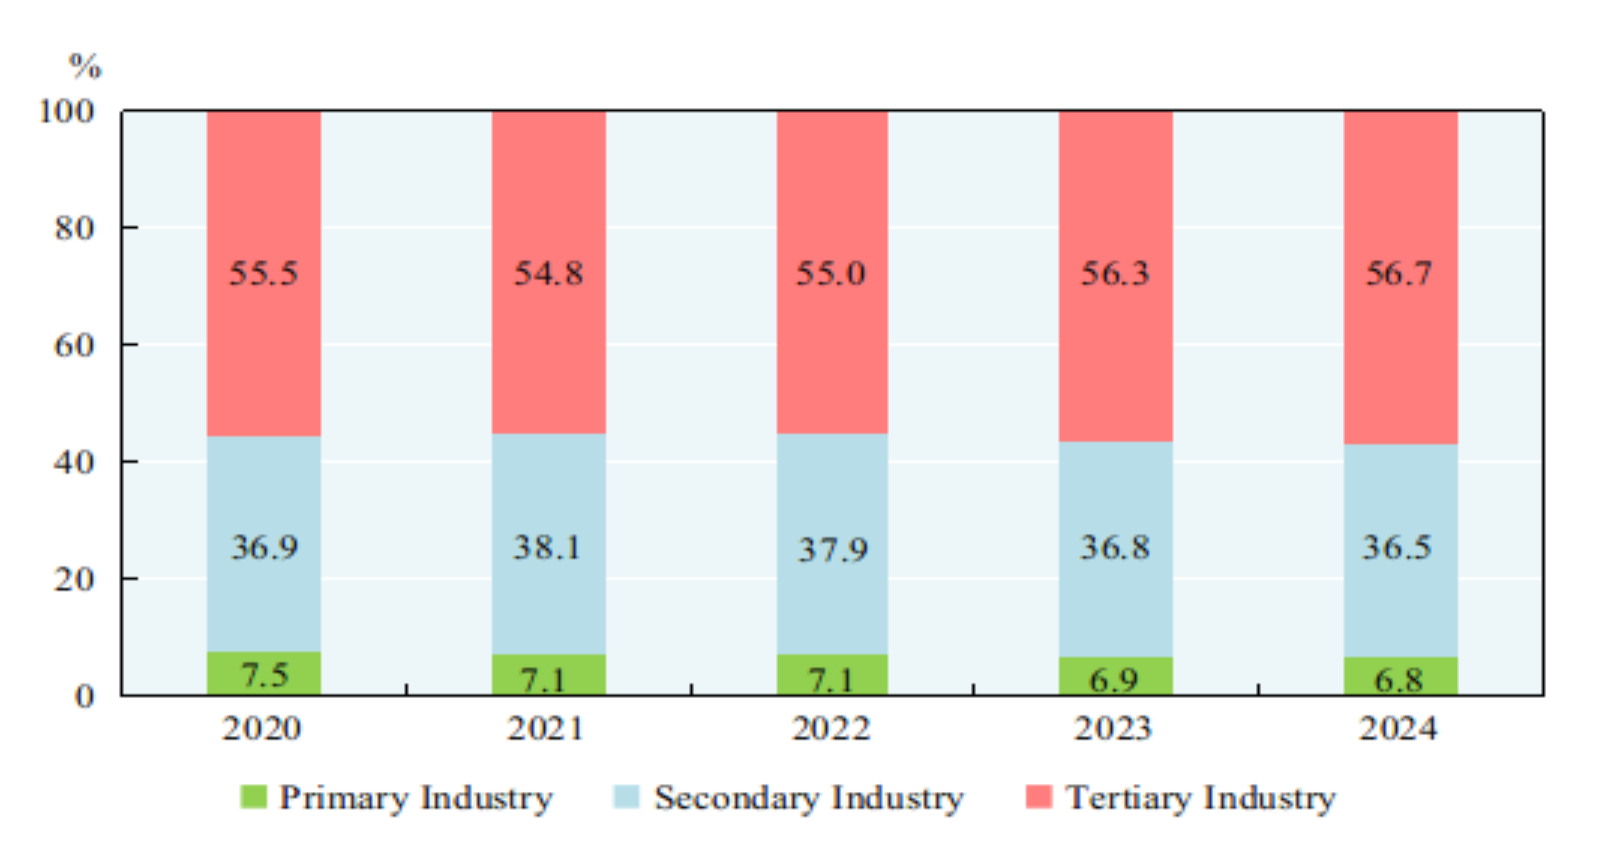
Figure 3: The Overall Labor Productivity 2020-2024
By the end of 2024, the total number of national population[5] reached 1,408.28 million, a decrease of 1.39 million over that at the end of 2023. Of this total, urban permanent residents numbered 943.50 million. There were 9.54 million births in 2024 with a crude birth rate of 6.77 per thousand; and there were 10.93 million deaths with a crude death rate of 7.76 per thousand. The natural growth rate was -0.99 per thousand.
Table 1: Population and Its Composition by the End of 2024
|
Item |
Population at Year-end (10,000 persons) |
Proportion (%) |
|
|
|
|
|
National Total |
140828 |
100.0 |
|
Of which: Urban |
94350 |
67.0 |
|
Rural |
46478 |
33.0 |
|
Of which: Male |
71909 |
51.1 |
|
Female |
68919 |
48.9 |
|
Of which: Aged 0-15 (under the age of 16)[6] |
23999 |
17.1 |
|
Aged 16-59 (under the age of 60) |
85798 |
60.9 |
|
Aged 60 and above |
31031 |
22.0 |
|
Of which: Aged 65 and above |
22023 |
15.6 |
|
|
|
|
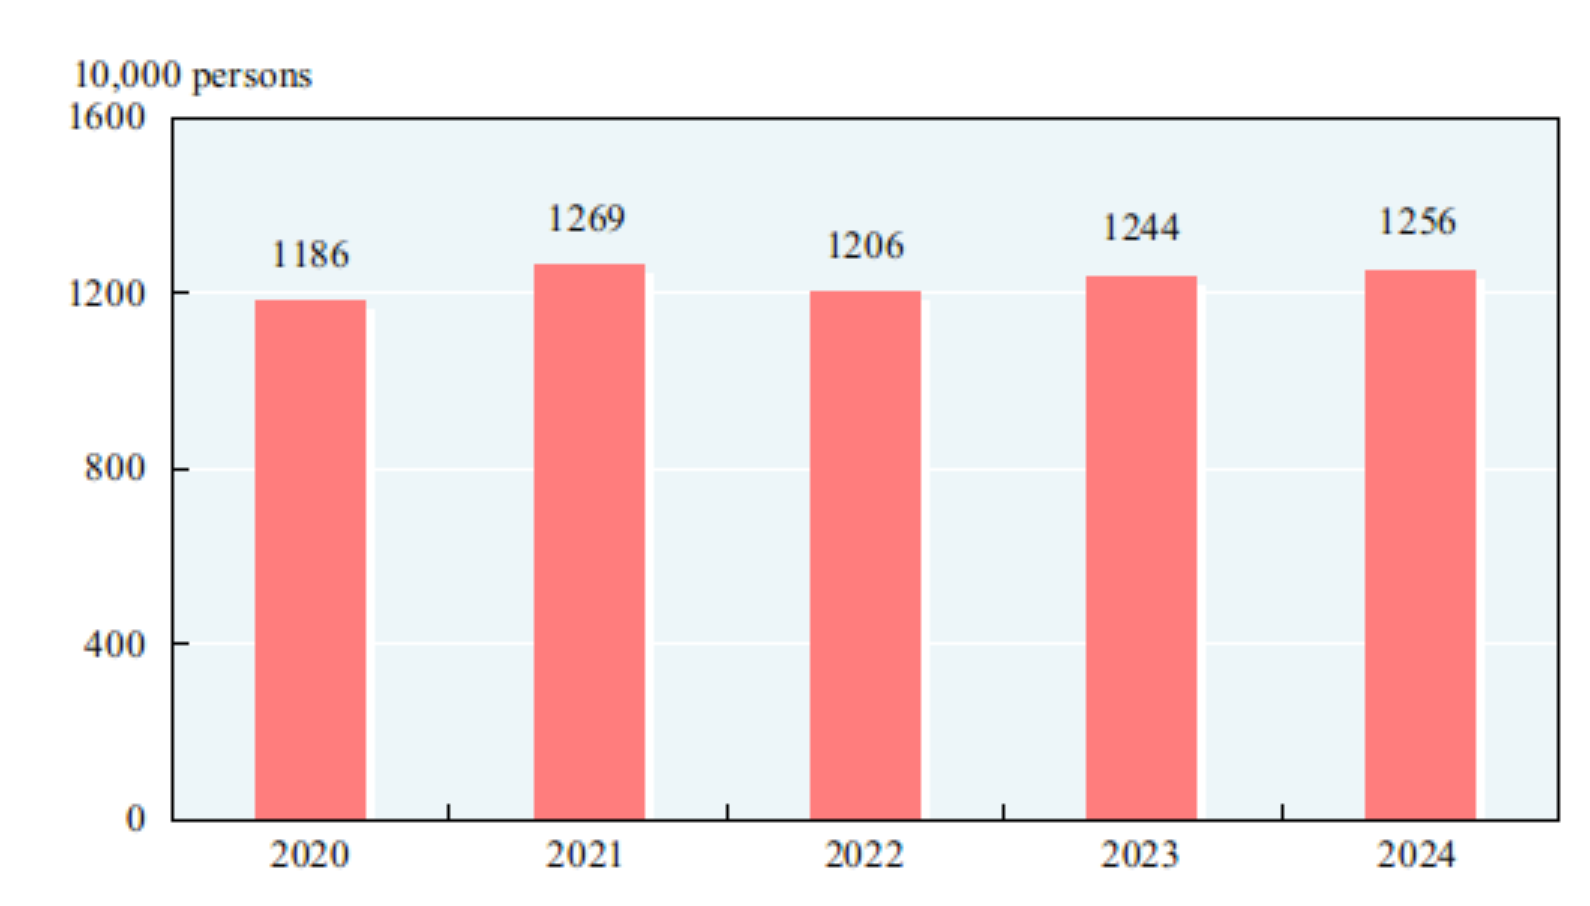
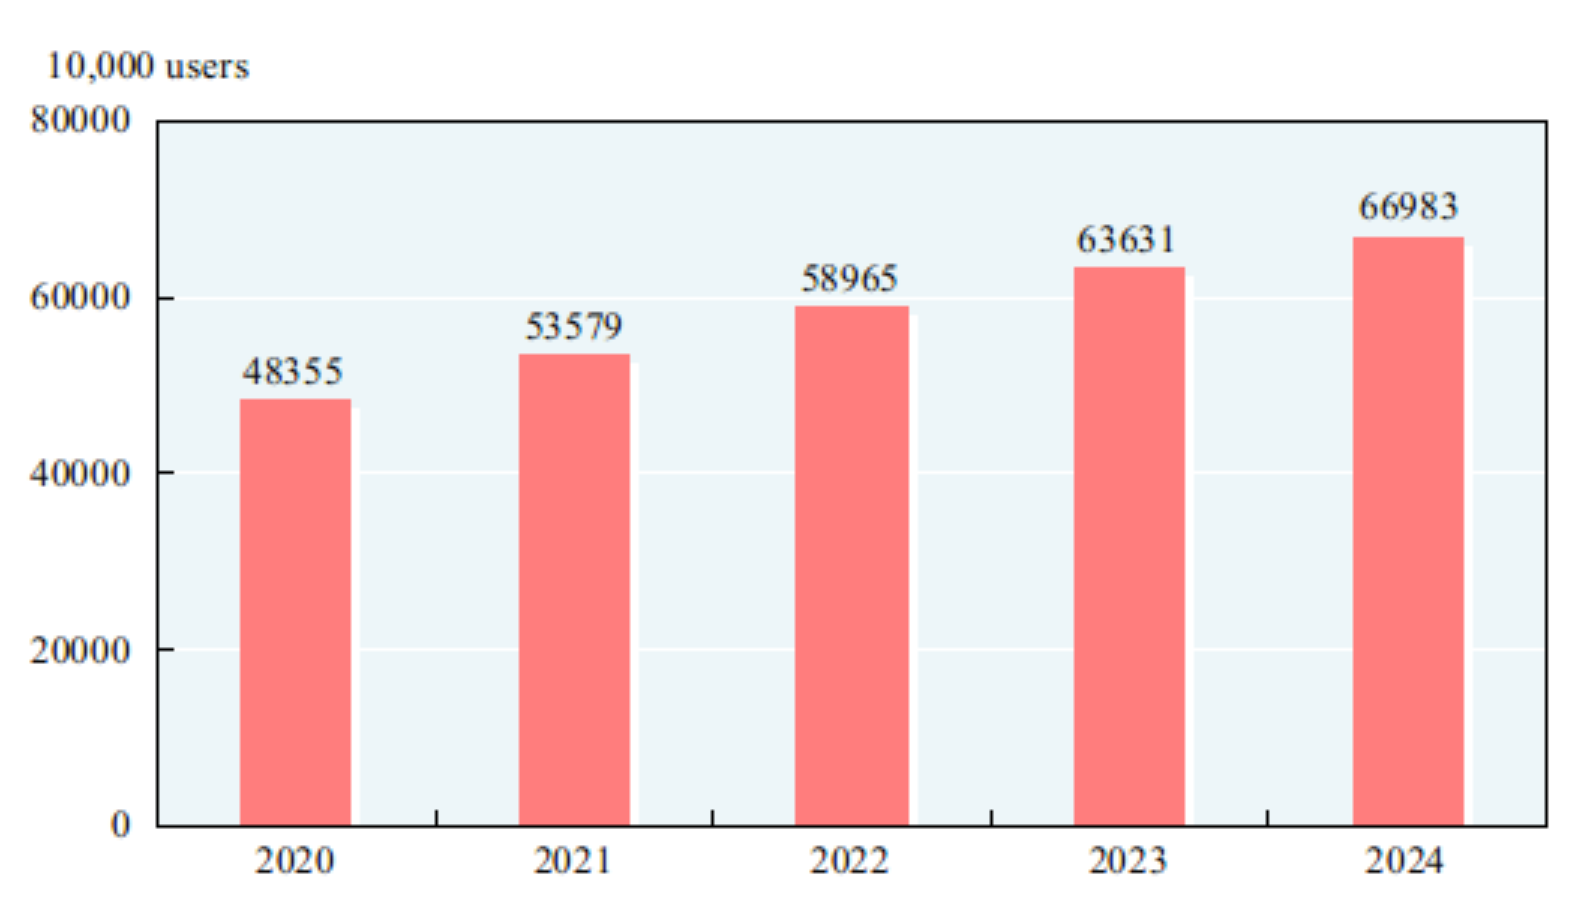
At the end of 2024, the number of employed people in China was 734.39 million, of which, that in urban areas was 473.45 million, accounting for 64.5 percent of the total employed people. The newly increased employed people in urban areas[7] numbered 12.56 million in 2024, 0.12 million more than that of the previous year. The urban surveyed unemployment rate in 2024 averaged 5.1 percent. The urban surveyed unemployment rate at the year end was 5.1 percent. The total number of migrant workers[8] was 299.73 million, up by 0.7 percent over that of 2023. Specifically, the number of migrant workers who left their hometowns and worked in other places was 178.71 million, up by 1.2 percent, and those who worked in their own localities reached 121.02 million, up by 0.1 percent.
Figure 4:Newly Increased Employed People in Urban Areas 2020-2024
The consumer prices in 2024 went up by 0.2 percent over the previous year. The producer prices for industrial products went down by 2.2 percent and the purchasing prices for industrial producers down by 2.2 percent. The producer prices for farm products[9] dropped by 0.9 percent. In December, out of the 70 large and medium-sized cities, 23 cities experienced a month-on-month rise in sales prices of newly-built commercial residential buildings, 4 cities maintained the same level and 43 cities experienced a decline; 9 cities experienced a month-on-month rise in sales prices of second-hand housing, 1 city maintained the same level and 60 cities experienced a decline. Two cities experienced a year-on-year rise in sales prices of newly-built commercial residential buildings, and 68 cities experienced a decline. The number of cities experiencing a year-on-year decline in sales prices of second-hand housing was 70.
Figure 5:Monthly Changes of Consumer Prices in 2024
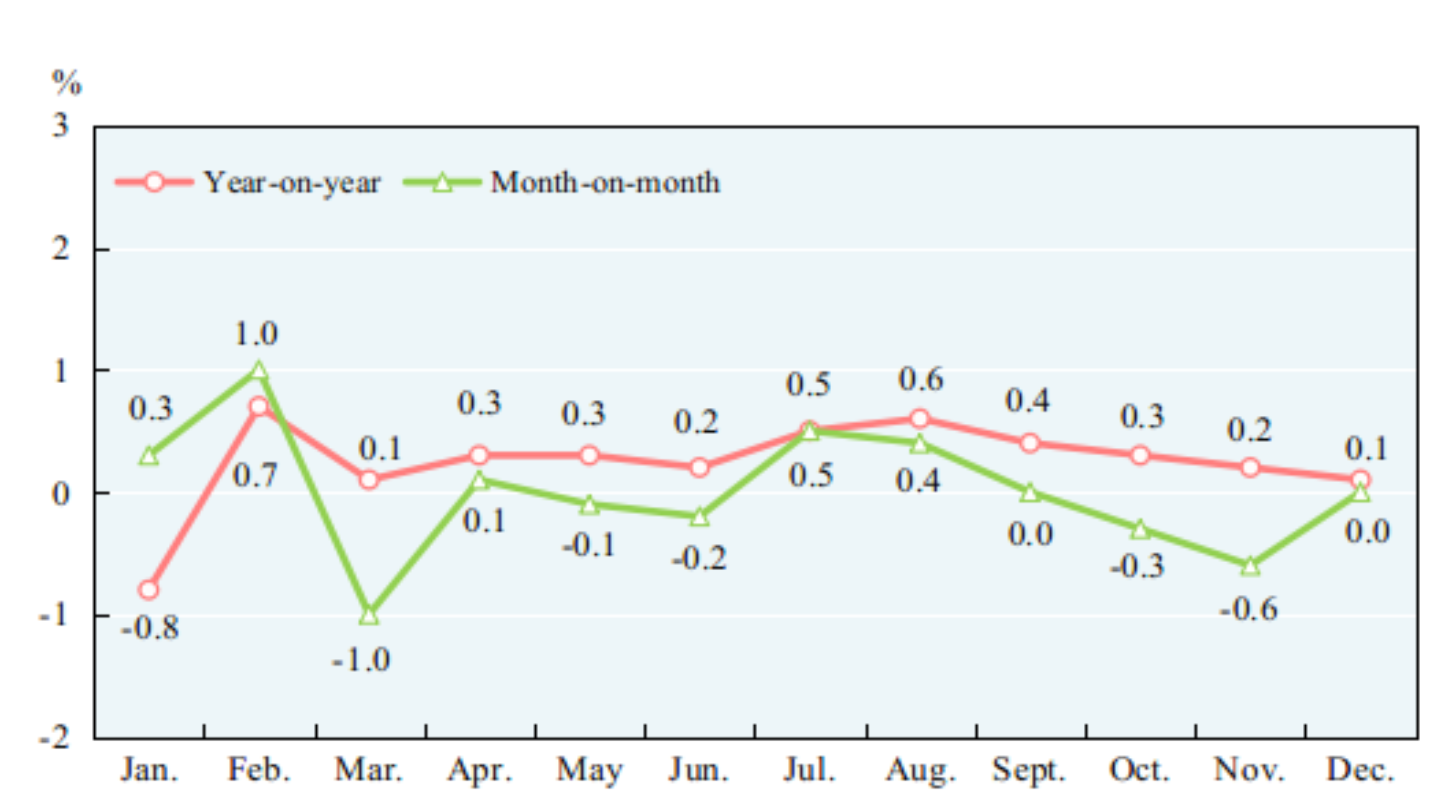
Table 2: Year-on-Year Changes of Consumer Prices in 2024
Unit: %
|
Item |
National |
| |
|
Urban |
Rural | ||
|
|
|
|
|
|
General level of consumer prices |
0.2 |
0.2 |
0.3 |
|
Of which: Food, tobacco and alcohol |
-0.1 |
-0.1 |
-0.1 |
|
Clothing |
1.4 |
1.6 |
0.9 |
|
Housing[10] |
0.1 |
0.1 |
0.1 |
|
Articles and services for daily use |
0.5 |
0.4 |
0.8 |
|
Transportation and communication |
-1.9 |
-2.0 |
-1.5 |
|
Education, culture and recreation |
1.5 |
1.5 |
1.6 |
|
Medical services and health care |
1.3 |
1.2 |
1.5 |
|
Other articles and services |
3.8 |
3.8 |
3.6 |
|
|
|
|
|
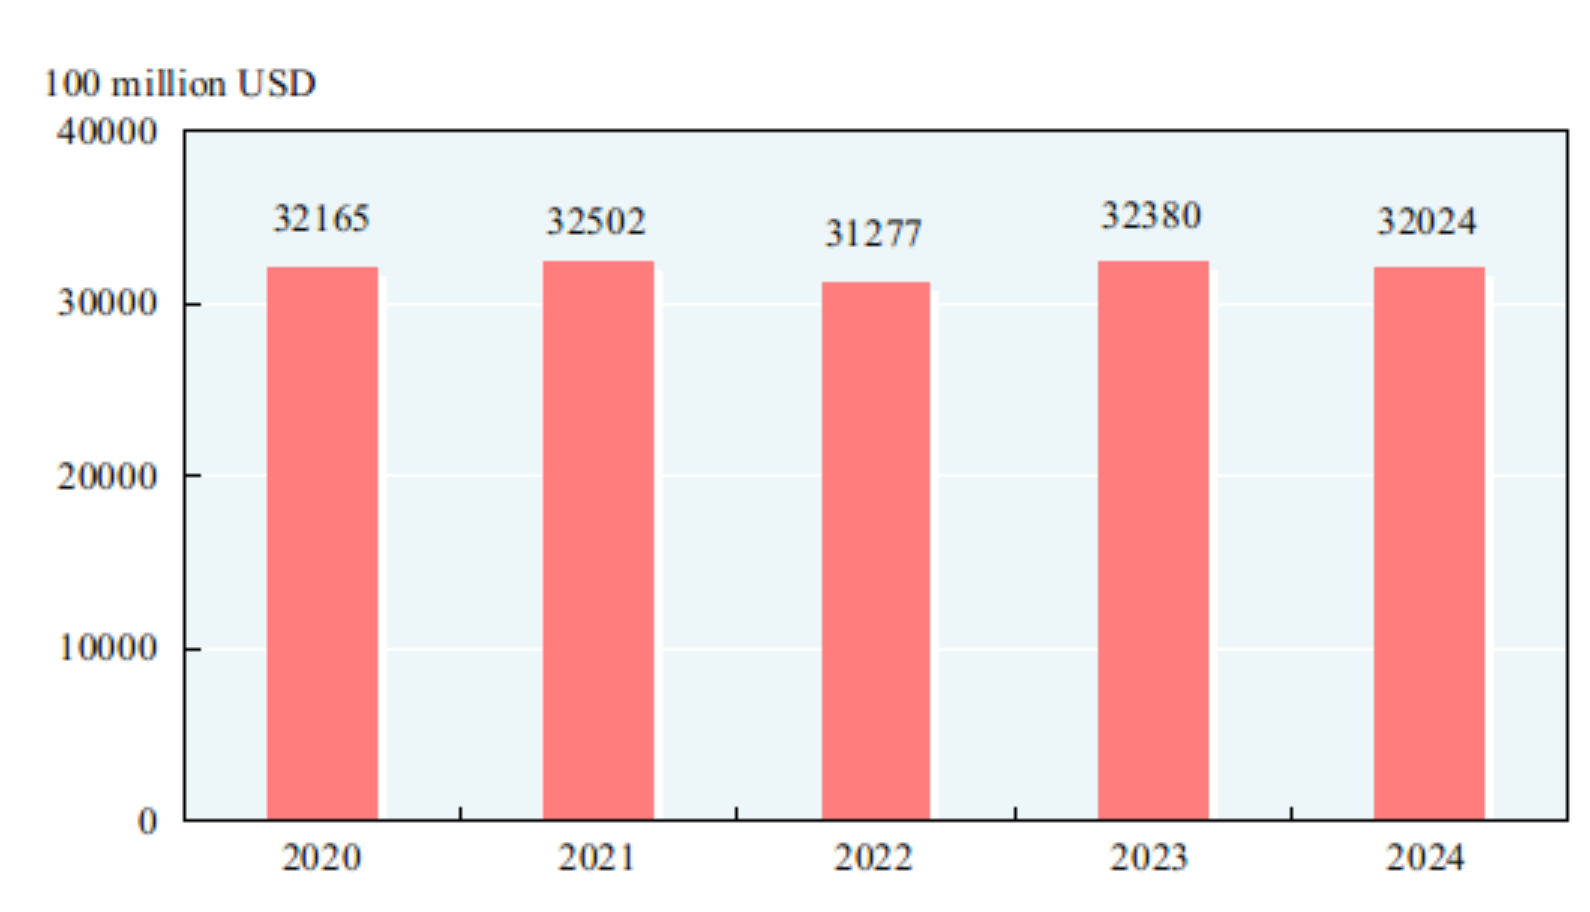
At the end of 2024, China’s foreign exchange reserves reached 3,202.4 billion US dollars, a decrease of 35.6 billion US dollars compared with that at the end of 2023. The average exchange rate of the year was 7.1217 RMB to 1 USD dollar, depreciated by 1.1 percent over that of 2023.
Figure 6:Year-end China's Foreign Exchange Reserves 2020-2024
New quality productive forces developed at a steady pace. Among the industries above the designated size[11], the value added of the manufacture of equipment[12] was up by 7.7 percent over the previous year, accounting for 34.6 percent of that of all industrial enterprises above the designated size. The value added of the high technology manufacturing industry[13] increased by 8.9 percent, accounting for 16.3 percent of that of all industrial enterprises above the designated size. The output of new energy vehicles reached 13.168 million, up by 38.7 percent over the previous year; that of solar cells (photovoltaic cells) was 0.68 billion kilowatts, up by 15.7 percent; that of service robots reached 10.519 million, up by 15.6 percent; and that of 3D printing devices totaled 3.418 million, up by 11.3 percent. Among the service enterprises above the designated size[14], the business revenue of the strategic emerging service industries[15] went up by 7.9 percent compared with the previous year. The investment in high technology industries[16] increased by 8.0 percent over the previous year and the investment in technology transformation of manufacturing[17] grew by 8.0 percent. The e-commerce transactions[18] reached 46,409.1 billion yuan, up by 3.9 percent over the previous year. The online retail sales[19] reached 15,228.7 billion yuan, up by 7.2 percent over the previous year. In 2024, the number of newly established business entities was 27.37 million, with 24 thousand enterprises newly established per day on average.
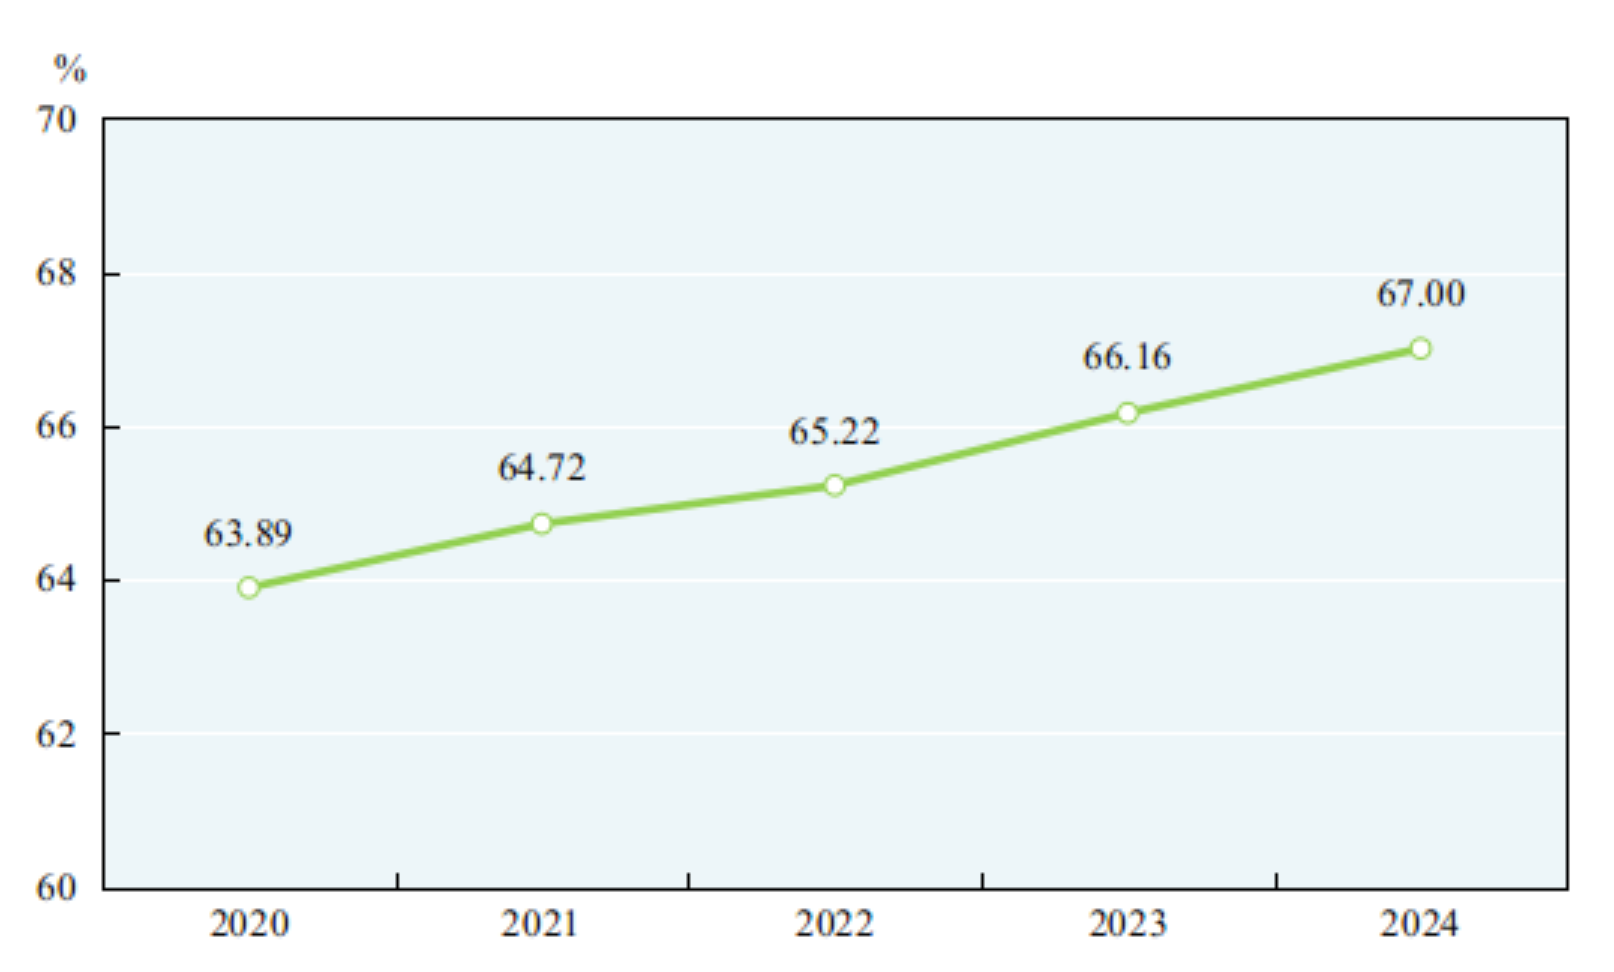
Solid progress was made in the integrated development of urban and rural areas and coordinated regional development. By the end of 2024, the urbanization rate of permanent residents reached 67.00 percent, 0.84 percentage points higher than that at the end of 2023. By region[20], in 2024, the gross domestic product in the eastern region was 70,235.6 billion yuan, an increase of 5.0 percent over the previous year; the central region, 28,715.6 billion yuan, up by 5.0 percent; the western region, 28,735.0 billion yuan, up by 5.2 percent; and the northeastern region, 6,345.1 billion yuan, up by 4.4 percent. In 2024, the gross domestic product in Beijing-Tianjin-Hebei Region reached 11,539.4 billion yuan, up by 5.2 percent over the previous year; that in the Yangtze River Economic Belt, 63,022.8 billion yuan, up by 5.4 percent; and that in the Yangtze River Delta, 33,169.1 billion yuan, up by 5.5 percent. Major regional strategies such as the construction of Guangdong-Hong Kong-Macao Greater Bay Areas, and the ecological protection and high-quality development of the Yellow River Basin made new achievements.
Figure 7:Year-end Urbanization Rates of Permanent Residents 2020-2024
Green and low-carbon transformation was further promoted. According to preliminary estimates, the national carbon dioxide emissions per 10,000 yuan worth of GDP[21] in 2024 dropped by 3.4 percent over that of the previous year. The electricity generated by clean energy such as hydropower, nuclear power, wind power and solar power was 3,712.6 billion kilowatts-hours, up by 16.4 percent over the previous year. Of the monitored 339 cities at prefecture level and above, 65.5 percent reached the air quality standard and 34.5 percent failed. Of the 3,641 sections under the national monitoring program for surface water, 90.4 percent were of fairly clean water quality (Grade I to III), 7.8 percent were Grade IV, 1.2 percent were Grade V and 0.6 percent were worse than Grade V national standard.
II. Agriculture
In 2024, the sown area of grain was 119.32 million hectares, an increase of 0.35 million hectares compared with that in 2023. Of this total, the sown area of rice was 29.01 million hectares, an increase of 0.06 million hectares; the sown area of wheat was 23.59 million hectares, a decrease of 0.04 million hectares; the sown area of corn was 44.74 million hectares, an increase of 0.52 million hectares; the sown area of soybean was 10.33 million hectares, a decrease of 0.15 million hectares. The sown area of cotton was 2.84 million hectares, an increase of 0.05 million hectares. The sown area of oil-bearing crops was 14.29 million hectares, an increase of 0.37 million hectares; the sown area of sugar crops was 1.48 million hectares, an increase of 0.07 million hectares.
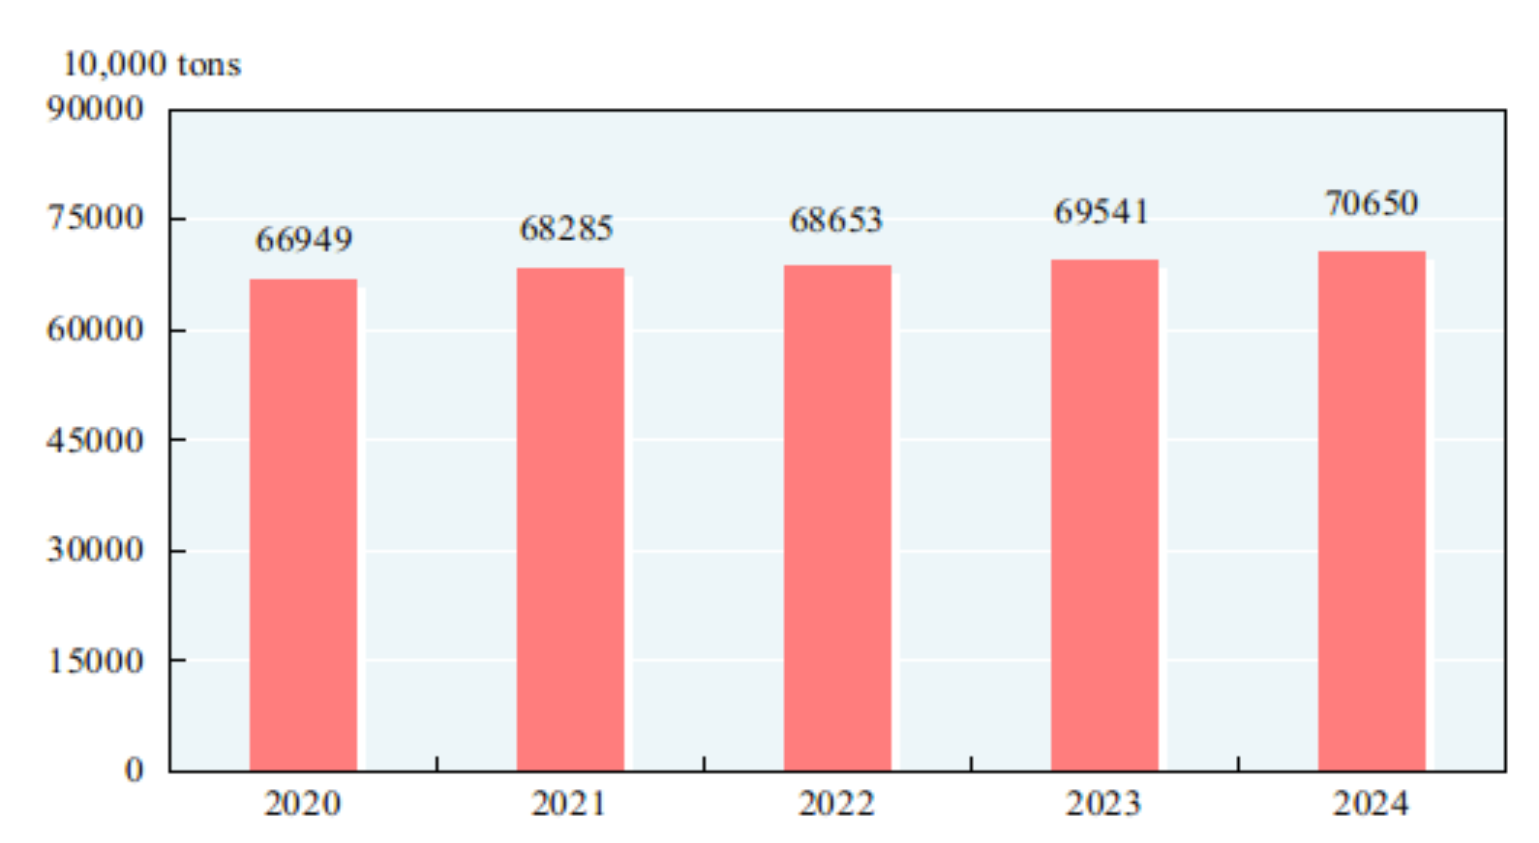
The total output of grain in 2024 was 706.50 million tons, an increase of 11.09 million tons over the previous year, up by 1.6 percent. Of this total, the output of summer crops was 149.89 million tons, up by 2.6 percent, that of the early rice was 28.17 million tons, down by 0.6 percent, and that of autumn grain was 528.43 million tons, up by 1.4 percent. The output of cereal was 652.29 million tons, up by 1.7 percent over that of 2023, among which the output of rice was 207.53 million tons, up by 0.5 percent; that of wheat was 140.10 million tons, up by 2.6 percent; and that of corn was 294.92 million tons, up by 2.1 percent. The output of soybean was 20.65 million tons, down by 0.9 percent over the previous year.
Figure 8: Output of Grain 2020-2024
In 2024, the output of cotton was 6.16 million tons, up by 9.7 percent over the previous year, that of oil-bearing crops was 39.79 million tons, up by 3.0 percent, that of sugar crops was 118.70 million tons, up by 4.3 percent, and that of tea was 3.74 million tons, up by 5.5 percent.
The total output of pork, beef, mutton and poultry in 2024 was 96.63 million tons, up by 0.2 percent over the previous year. Of this total, the output of pork was 57.06 million tons, down by 1.5 percent; that of beef was 7.79 million tons, up by 3.5 percent; that of mutton was 5.18 million tons, down by 2.5 percent; and that of poultry was 26.60 million tons, up by 3.8 percent. The total output of eggs was 35.88 million tons, up by 0.7 percent. The output of milk was 40.79 million tons, down by 2.8 percent. At the end of the year, 427.43 million pigs were registered in the total stocks, down by 1.6 percent compared with that at the end of 2023, and 702.56 million pigs were slaughtered, down by 3.3 percent over the previous year.
The total output of aquatic products in 2024 was 73.66 million tons, up by 3.5 percent over the previous year. Of this total, the output of cultured aquatic products was 60.62 million tons, up by 4.3 percent; and that of fished aquatic products was 13.05 million tons, down by 0.1 percent.
The total production of timber in 2024 reached 137.40 million cubic meters, up by 8.2 percent over the previous year.
III. Industry and Construction
In 2024, the total value added of the industrial sector was 40,544.2 billion yuan, up by 5.7 percent over the previous year. The value added of industrial enterprises above the designated size increased by 5.8 percent. Of the industrial enterprises above the designated size, in terms of ownership, the value added of the state-holding enterprises was up by 4.2 percent, that of the share-holding enterprises up by 6.1 percent, that of the enterprises funded by foreign investors and investors from Hong Kong, Macao and Taiwan up by 4.0 percent and that of private enterprises up by 5.3 percent. In terms of sectors, the value added of the mining industry was up by 3.1 percent, that of manufacturing up by 6.1 percent and that of production and supply of electricity, heat power, gas and water up by 5.3 percent.
Figure 9: Value Added and Growth Rates of Industrial Enterprises 2020-2024
In 2024, of the industrial enterprises above the designated size, the value added for processing of food from agricultural and sideline products was up by 2.2 percent over the previous year; for textile industry up by 5.1 percent; for manufacture of raw chemical materials and chemical products up by 8.9 percent; for manufacture of non-metallic mineral products down by 1.4 percent; for smelting and pressing of ferrous metals up by 4.0 percent; for manufacture of general purpose machinery up by 3.6 percent; for manufacture of special purpose machinery up by 2.8 percent; for manufacture of automobiles up by 9.1 percent; for manufacture of electrical machinery and apparatus up by 5.1 percent; for manufacture of computers, communication equipment and other electronic equipment up by 11.8 percent; for production and supply of electricity and heat power up by 5.2 percent.
Table 3: Output of Major Industrial Products and Growth Rates of the Industrial Enterprises above the Designated Size in 2024[22]
|
Product |
Unit |
Output |
Increase over 2023 (%) |
|
|
|
|
|
|
Yarn |
10000 tons |
2277.9 |
1.3 |
|
Cloth |
100 million meters |
306.3 |
2.2 |
|
Chemical fiber |
10000 tons |
7910.8 |
9.7 |
|
Refined sugar (final product) |
10000 tons |
1498.6 |
17.0 |
|
Cigarettes |
100 million |
24654.6 |
0.9 |
|
Color TV sets |
10000 |
20745.4 |
4.6 |
|
Household refrigerators |
10000 |
10395.7 |
8.3 |
|
Air conditioners |
10000 |
26598.4 |
9.7 |
|
Crude steel |
10000 tons |
100509.1 |
-1.7 |
|
Rolled steel[23] |
10000 tons |
139967.4 |
1.1 |
|
Ten kinds of nonferrous metals |
10000 tons |
7918.8 |
4.3 |
|
Of which: Refined copper (copper) |
10000 tons |
1364.4 |
4.1 |
|
Aluminum electrolyze |
10000 tons |
4400.5 |
4.6 |
|
Cement |
100 million tons |
18.3 |
-9.5 |
|
Sulfuric acid (100%) |
10000 tons |
10369.9 |
6.9 |
|
Caustic soda (100%) |
10000 tons |
4365.7 |
5.5 |
|
Ethylene |
10000 tons |
3493.4 |
0.7 |
|
Chemical fertilizer (100 percent equivalent) |
10000 tons |
6006.1 |
8.5 |
|
Power generation equipment |
10000 kilowatts |
28433.9 |
16.0 |
|
Motor vehicles |
10000 |
3155.9 |
4.8 |
|
Of which: New energy vehicles |
10000 |
1316.8 |
38.7 |
|
Integrated circuits |
100 million pieces |
4514.2 |
22.2 |
|
Mobile telephones |
10000 |
166952.9 |
7.8 |
|
Micro computer equipment |
10000 |
33912.9 |
2.7 |
|
Industrial robots |
10000 sets |
55.6 |
14.2 |
|
Ultra-clear glass for solar industry |
10000 square meters |
287884.5 |
53.5 |
|
Charging piles |
10000 |
469.7 |
58.7 |
|
Smart watches |
10000 |
8095.4 |
5.4 |
|
Virtual reality devices |
10000 |
836.6 |
59.4 |
|
|
|
|
|
In 2024, the profits made by industrial enterprises above the designated size were 7,431.1 billion yuan, down by 3.3 percent over the previous year. By ownership, the profits of state-holding enterprises were 2,139.7 billion yuan, down by 4.6 percent over the previous year; those of share-holding enterprises were 5,616.6 billion yuan, down by 3.6 percent; those of enterprises funded by foreign investors and investors from Hong Kong, Macao and Taiwan were 1,763.8 billion yuan, down by 1.7 percent; and those of private enterprises were 2,324.6 billion yuan, up by 0.5 percent. In terms of different sectors, the profits of mining were 1,127.2 billion yuan, down by 10.0 percent over the previous year; those of manufacturing were 5,514.1 billion yuan, down by 3.9 percent; and those of the production and supply of electricity, heat power, gas and water were 789.8 billion yuan, up by 14.5 percent. The cost for per-hundred-yuan business revenue of the industrial enterprises above the designated size was 85.16 yuan, 0.36 yuan more than that of 2023; the profit rate of the business revenue was 5.39 percent, 0.30 percentage points down. By the end of 2024, the asset-liability ratio of industrial enterprises above the designated size was 57.5 percent, 0.1 percentage points higher than that at the end of 2023. The capacity utilization rate[24] of industrial enterprises above the designated size was 75.0 percent in 2024.
According to preliminary estimates, the total primary energy output[25] in 2024 was 4.98 billion tons of standard coal equivalent, up by 4.6 percent over that of the previous year.
Table 4: Output of Major Energy Products and Growth Rates in 2024
|
Product |
Unit |
Output |
Increase over 2023 (%) |
|
|
|
|
|
|
Coal |
100 million tons |
47.8 |
1.2 |
|
Crude petroleum oil |
10000 tons |
21289.1 |
1.8 |
|
Natural gas |
100 million cubic meters |
2464.5 |
6.0 |
|
Electricity |
100 million kilowatt-hours |
100868.8 |
6.7 |
|
Of which: Thermal power[26] |
100 million kilowatt-hours |
63742.6 |
1.7 |
|
Hydropower |
100 million kilowatt-hours |
14256.8 |
10.9 |
|
Nuclear-power |
100 million kilowatt-hours |
4508.5 |
3.7 |
|
Wind power |
100 million kilowatt-hours |
9970.4 |
12.5 |
|
Solar power |
100 million kilowatt-hours |
8390.4 |
43.6 |
|
|
|
|
|
By the end of 2024, the installed power generation capacity was 3,348.62 million kilowatts, up by 14.6 percent over that at the end of 2023, among which[27] the installed thermal power generation capacity was 1,444.45 million kilowatts, up by 3.8 percent; the installed hydropower generation capacity was 435.95 million kilowatts, up by 3.2 percent; the installed nuclear power generation capacity was 60.83 million kilowatts, up by 6.9 percent; the installed grid-connected wind power generation capacity was 520.68 million kilowatts, up by 18.0 percent and the installed grid-connected solar power generation capacity was 886.66 million kilowatts, up by 45.2 percent.
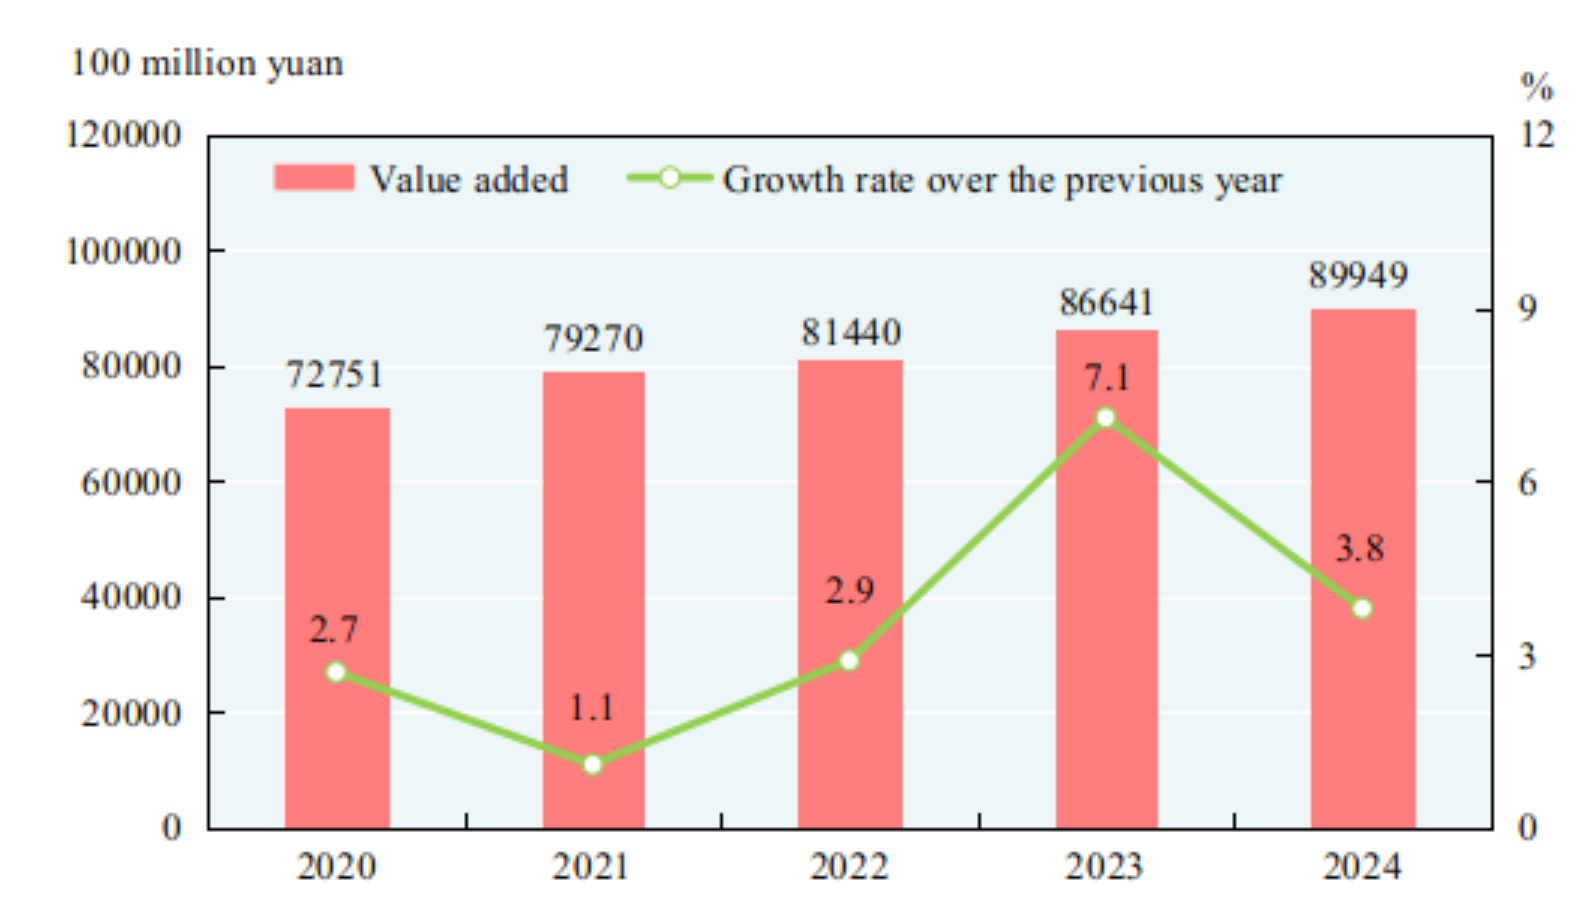
In 2024, the value added of construction enterprises was 8,994.9 billion yuan, up by 3.8 percent over the previous year. The profits made by construction enterprises qualified for general contracts and specialized contracts reached 751.3 billion yuan, down by 9.8 percent over the previous year, of which the profits made by state-holding enterprises were 366.9 billion yuan, down by 8.7 percent.
Figure 10: Value Added and Growth Rates of Construction Industry 2020-2024
IV. Service Sector
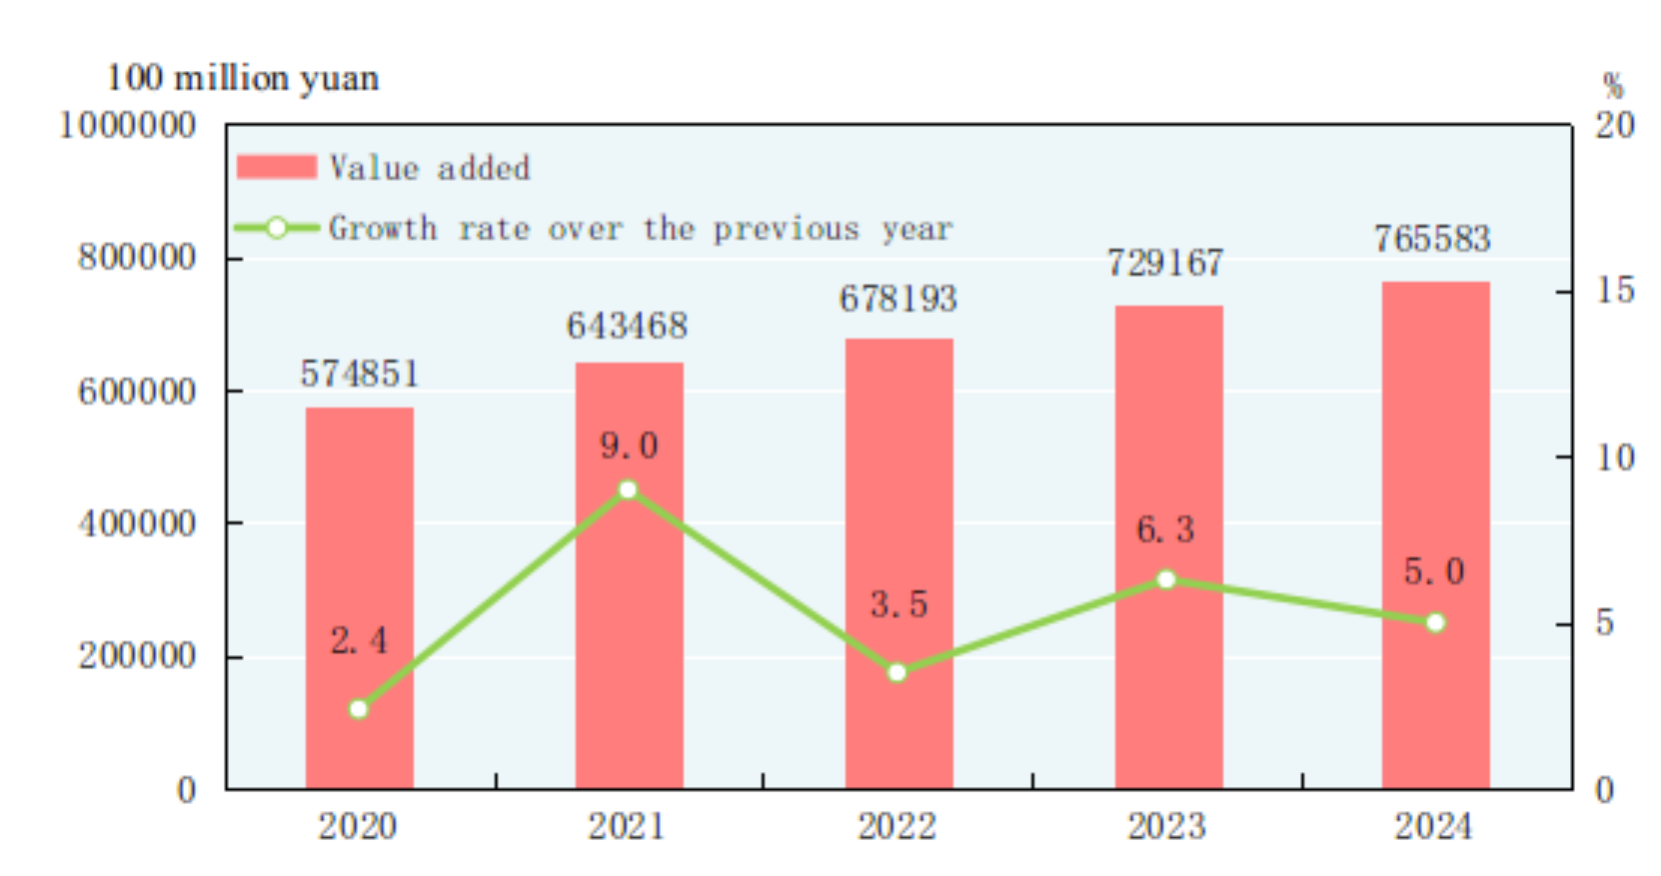
In 2024, the value added of the wholesale and retail trades was 13,798.1 billion yuan, up by 5.5 percent over the previous year; that of transport, storage and post was 5,923.2 billion yuan, up by 7.0 percent; that of hotels and catering services was 2,472.9 billion yuan, up by 6.4 percent; that of finance was 9,854.4 billion yuan, up by 5.6 percent; that of real estate was 8,456.5 billion yuan, down by 1.8 percent; that of information transmission, software and information technology services was 6,343.8 billion yuan, up by 10.9 percent; and that of leasing and business services was 5,657.6 billion yuan, up by 10.4 percent. The business revenue of service enterprises above the designated size grew by 7.2 percent over the previous year, and the total profits increased by 2.4 percent.
Figure 11: Value Added and Growth Rates of Service Sector 2020-2024
The total freight traffic[28] in 2024 reached 57.8 billion tons, up by 3.8 percent over the previous year. The freight flows were 26,194.8 billion ton-kilometers, up by 5.6 percent. The volume of freight handled by ports totaled 17.6 billion tons, up by 3.7 percent over the previous year, of which the freight for foreign trade was 5.4 billion tons, up by 6.9 percent. Container shipping of ports reached 332.00 million standard containers, up by 7.0 percent.
Table 5: Freight Traffic by All Means of Transportation and Growth Rates in 2024
|
Item |
Unit |
Volume |
Increase over 2023 (%) |
|
|
|
|
|
|
Total freight traffic |
100 million tons |
578.3 |
3.8 |
|
Railways |
100 million tons |
51.7 |
2.8 |
|
Highways |
100 million tons |
418.8 |
3.8 |
|
Waterways |
100 million tons |
98.1 |
4.7 |
|
Civil aviation |
10000 tons |
898.2 |
22.1 |
|
Pipelines |
100 million tons |
9.5 |
-0.5 |
|
Freight flows |
100 million ton-kilometers |
261948.1 |
5.6 |
|
Railways |
100 million ton-kilometers |
35861.9 |
-1.6 |
|
Highways |
100 million ton-kilometers |
76847.5 |
3.9 |
|
Waterways |
100 million ton-kilometers |
141422.9 |
8.8 |
|
Civil aviation |
100 million ton-kilometers |
353.9 |
24.8 |
|
Pipelines |
100 million ton-kilometers |
7461.9 |
2.1 |
|
|
|
|
|
In 2024, the total passenger traffic[29] was 17.1 billion person-times, up by 8.5 percent over 2023, and the passenger flows were 3,388.6 billion person-kilometers, up by 13.6 percent.
Table 6: Passenger Traffic by All Means of Transportation and Growth Rates in 2024
|
Item |
Unit |
Volume |
Increase over 2023 (%) |
|
|
|
|
|
|
Total passenger traffic |
100 million person-times |
170.8 |
8.5 |
|
Railways |
100 million person-times |
43.1 |
11.9 |
|
Highways |
100 million person-times |
117.8 |
7.0 |
|
Waterways |
100 million person-times |
2.6 |
0.8 |
|
Civil aviation |
100 million person-times |
7.3 |
17.9 |
|
Passenger flows |
100 million person-kilometers |
33885.5 |
13.6 |
|
Railways |
100 million person-kilometers |
15799.1 |
7.3 |
|
Highways |
100 million person-kilometers |
5117.0 |
8.0 |
|
Waterways |
100 million person-kilometers |
54.7 |
1.7 |
|
Civil aviation |
100 million person-kilometers |
12914.7 |
25.3 |
|
|
|
|
|
The total number of motor vehicles for civilian use reached 352.68 million (including 6.94 million tri-wheel motor vehicles and low-speed trucks) by the end of 2024, up by 16.51 million over that at the end of 2023, of which the privately-owned vehicles numbered 309.89 million, an increase of 15.62 million; new energy vehicles totaled 31.40 million, up by 10.99 million. The total number of cars for civilian use was 193.43 million, an increase of 6.75 million, of which the privately-owned cars numbered 182.04 million, an increase of 6.64 million.
In 2024, the volume of postal and delivery services[30] totaled 193.7 billion, up by 19.2 percent over the previous year. The number of mail delivery was 0.99 billion; that of parcel delivery was 0.03 billion; and that of express delivery was 175.1 billion with a revenue reaching 1,403.4 billion yuan. The turnover of telecommunication services[31] in 2024 totaled 1,830.7 billion yuan, up by 10.0 percent over the previous year. By the end of 2024, there were 12.65 million mobile phone base stations[32], among which the number of 4G base stations reached 7.11 million and that of 5G base stations was 4.25 million. There were 1,789.60 million mobile phone subscribers in China, of whom 1,014.05 million were 5G mobile phone subscribers. The mobile phone coverage was 127.1 sets per 100 persons. The number of fixed broadband internet users[33] reached 669.83 million, an increase of 33.52 million over that at the end of the previous year. Of this total, users of broadband with the speed of 1000M and above[34] amounted to 206.83 million, an increase of 43.55 million. Users of mobile internet of things terminals[35] totaled 2.656 billion, an increase of 0.324 billion. The number of internet users was 1.108 billion, 1.105 billion of whom were mobile internet surfers. The coverage of internet was 78.6 percent, and 67.4 percent in rural areas. The mobile internet traffic in 2024 was 337.6 billion gigabytes, up by 11.6 percent over the previous year. Software revenue of software and information technology services industry[36] was 13,727.6 billion yuan, up by 10.0 percent over that of the previous year.
Figure 12: Express Delivery and Growth Rates 2020-2024[37]
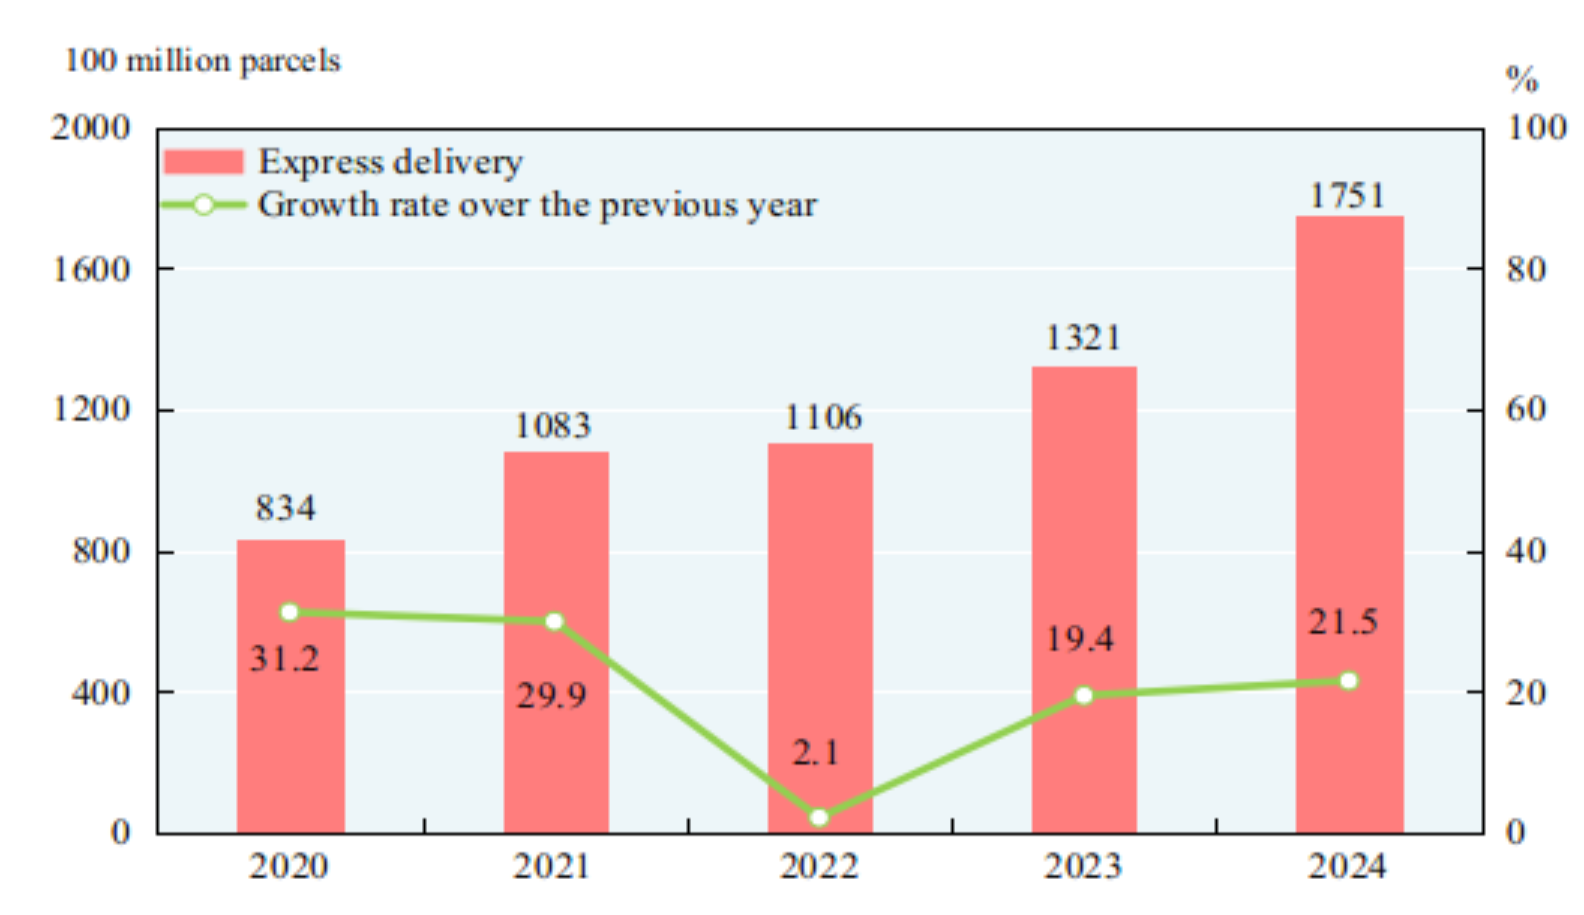
Figure 13: Year-end Number of Fixed Broadband Internet Users 2020-2024
V. Domestic Trade
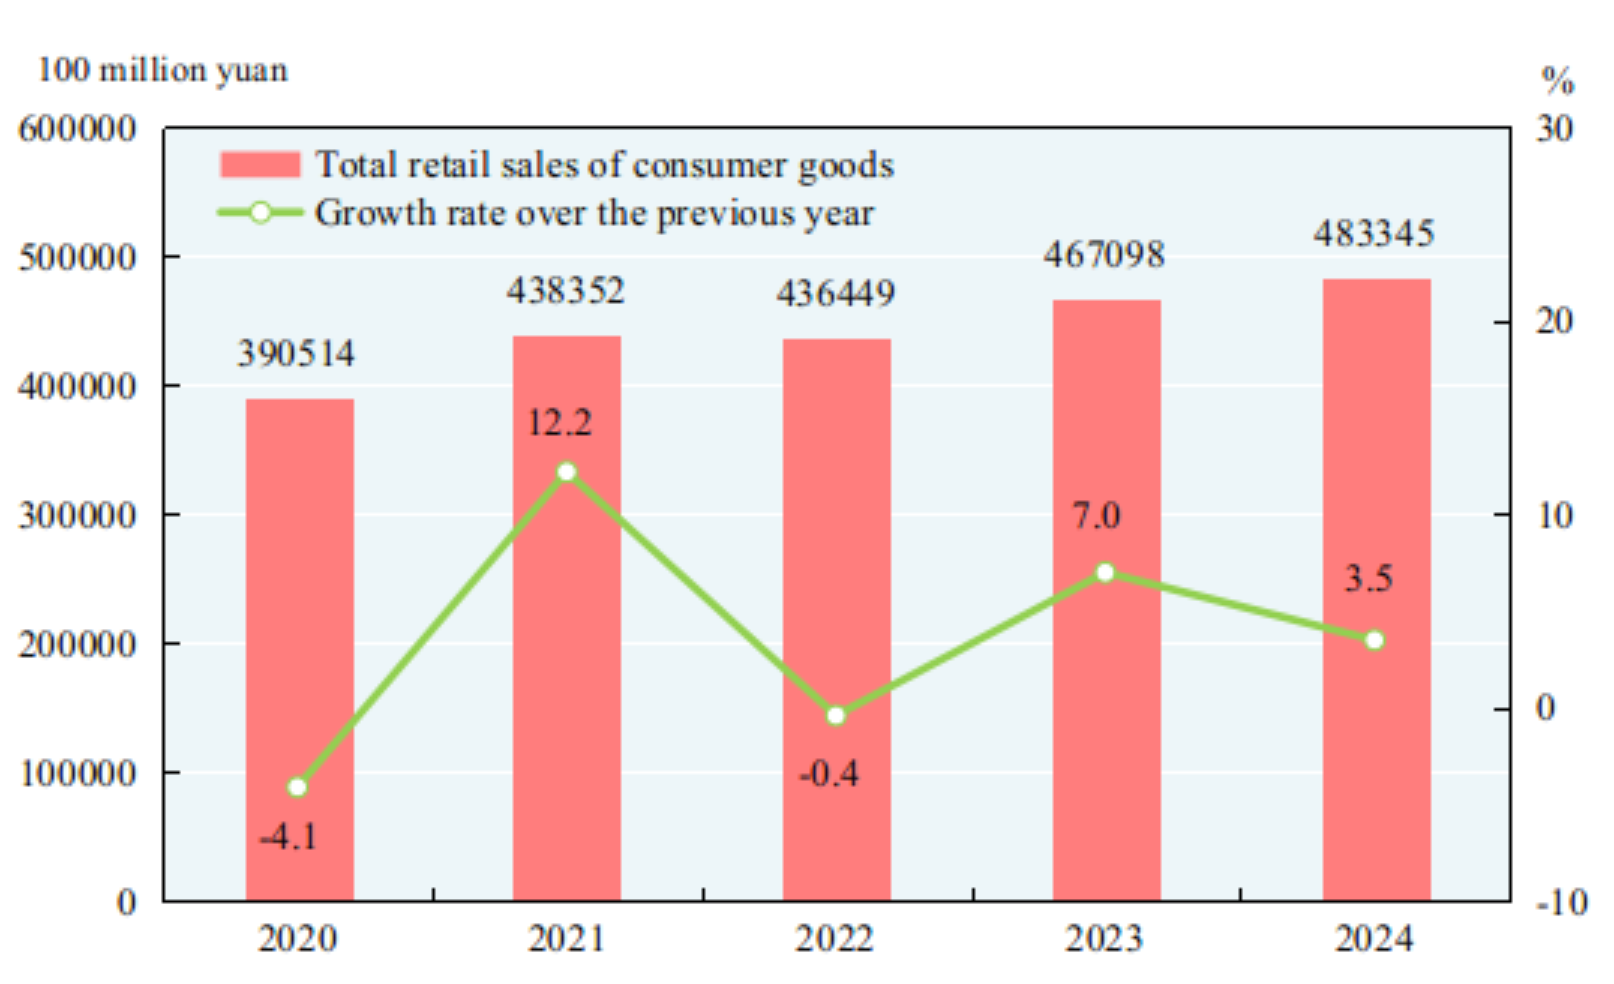
In 2024, the total retail sales of consumer goods[38] reached 48,334.5 billion yuan, up by 3.5 percent over the previous year. An analysis on different areas showed that the retail sales of consumer goods in urban areas stood at 41,781.3 billion yuan, up by 3.4 percent, and that in rural areas reached 6,553.1 billion yuan, up by 4.3 percent. Grouped by consumption patterns, the retail sales of goods were 42,716.5 billion yuan, up by 3.2 percent, and the income of catering industry was 5,618.0 billion yuan, up by 5.3 percent. The retail sales of services[39] increased by 6.2 percent over the previous year.
Figure 14: Total Retail Sales of Consumer Goods and Growth Rates 2020-2024
Of the total retail sales of goods by enterprises above the designated size, the retail sales for grain, oil and food went up by 9.9 percent over the previous year; beverage up by 2.1 percent; tobacco and liquor up by 5.7 percent; clothes, shoes, hats and textiles up by 0.3 percent; cosmetics down by 1.1 percent; gold, silver and jewelry down by 3.1 percent; daily necessities up by 3.0 percent; sports and recreational articles up by 11.1 percent; household appliances and audio-video equipment up by 12.3 percent; traditional Chinese and western medicines up by 3.1 percent; cultural and office appliances down by 0.3 percent; furniture up by 3.6 percent; communication equipment up by 9.9 percent; petroleum and petroleum products up by 0.3 percent; motor vehicles down by 0.5 percent; and building and decoration materials down by 2.0 percent. Grouped by retail forms, among all the retail enterprises above the designated size, the retail sales of convenience stores increased by 4.7 percent over the previous year, specialty stores grew by 4.2 percent, supermarkets increased by 2.7 percent, department stores down by 2.4 percent, and brand stores down by 0.4 percent.
In 2024, the online retail sales of physical goods[40] were 12,787.8 billion yuan, up by 6.5 percent over the previous year, accounting for 26.5 percent of the total retail sales of consumer goods.
VI. Investment in Fixed Assets
The total investment in fixed assets of the country in 2024 was 52,091.6 billion yuan, up by 3.1 percent over the previous year[41]. The investment in fixed assets (excluding rural households) was 51,437.4 billion yuan, up by 3.2 percent, among which the investment in purchase of equipment and instruments increased by 15.7 percent. Of the investment in fixed assets (excluding rural households), by region[42], the investment in eastern region was up by 1.3 percent, central region up by 5.0 percent, western region up by 2.4 percent, and northeastern region up by 4.2 percent.
Of the investment in fixed assets (excluding rural households), the investment in the primary industry was 954.3 billion yuan, up by 2.6 percent over the previous year; that in the secondary industry was 17,906.4 billion yuan, up by 12.0 percent; and that in the tertiary industry was 32,576.7 billion yuan, down by 1.1 percent. The investment in infrastructure[43] increased by 4.4 percent. The investment in social sector[44] went down by 2.5 percent. The private investment[45] was 25,757.4 billion yuan, down by 0.1 percent; the private project investment increased by 6.0 percent with the investment in real estate development deducted. By sectors, the private investment in manufacturing increased by 10.8 percent and in infrastructure increased by 5.8 percent.
Figure 15: Shares of Investment in Fixed Assets (Excluding Rural Households) of the Three Industries in 2024
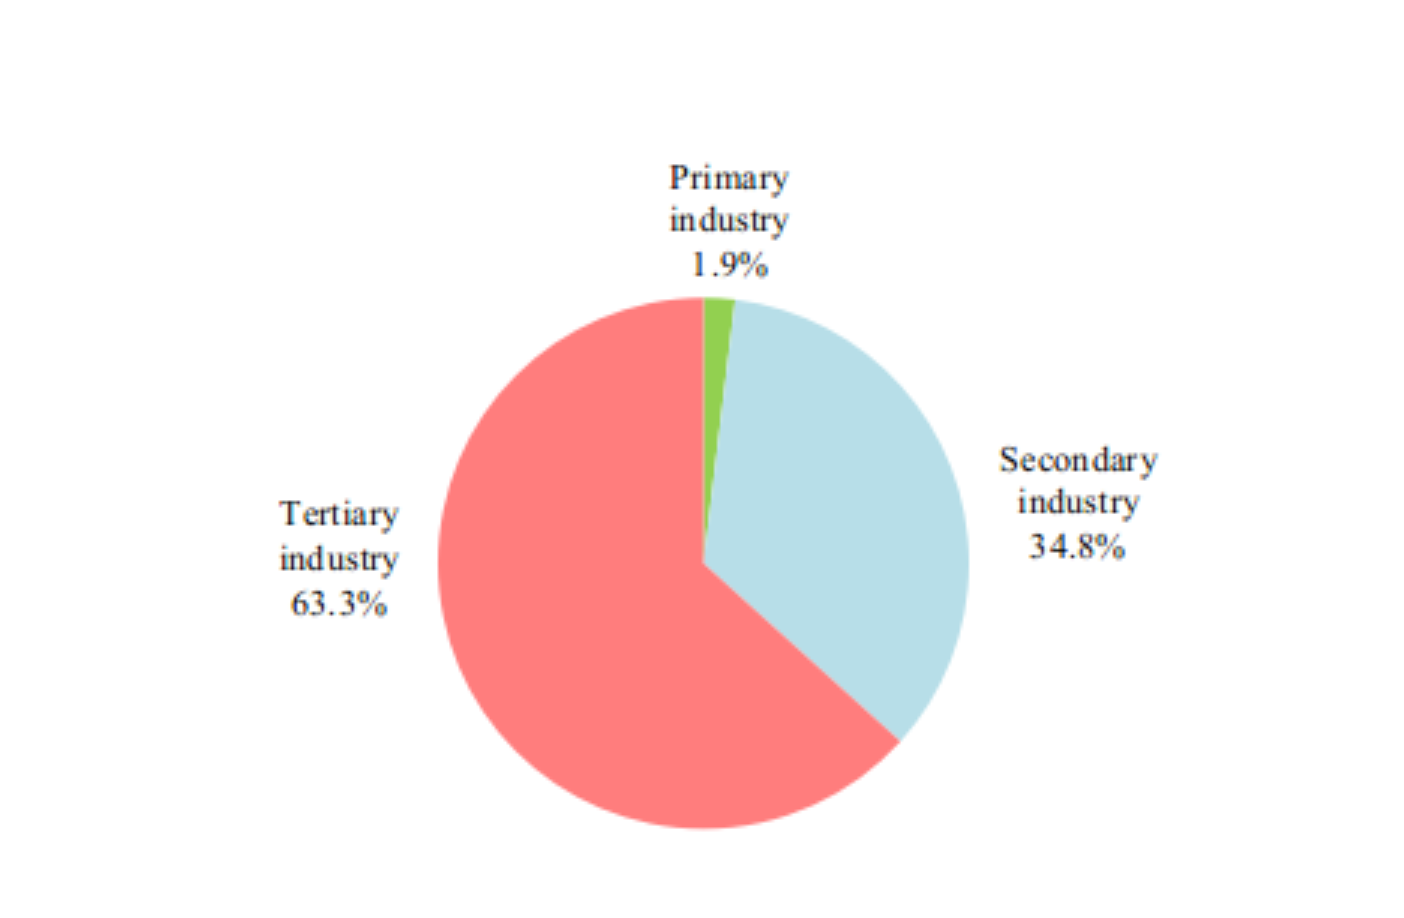
Table 7: Growth Rates of Investment in Fixed Assets (Excluding Rural Households) by Sectors in 2024
|
Sector |
Increase over 2023 (%) |
Sector |
Increase over 2023 (%) |
|
|
|
|
|
|
Total |
3.2 |
Finance |
-6.3 |
|
Agriculture, Forestry, Animal Husbandry and Fishery |
6.4 |
Real Estate[46] |
-10.8 |
|
Mining |
10.5 |
Leasing and Business Services |
6.3 |
|
Manufacturing |
9.2 |
Scientific Research and Technical Services |
11.8 |
|
Production and Supply of Electricity, Heat Power, Gas and Water |
23.9 |
Management of Water Conservancy, Environment and Public Facilities |
4.2 |
|
Construction |
-1.9 |
Household Services, Repair and Other Services |
0.7 |
|
Wholesale and Retail Trades |
5.0 |
Education |
1.3 |
|
Transport, Storage and Post |
5.9 |
Health and Social Services |
-9.4 |
|
Hotels and Catering Services |
34.1 |
Culture, Sports and Entertainment |
0.0 |
|
Information Transmission, Software and Information Technology Services |
6.3 |
Public Management, Social Security and Social Organizations |
-4.2 |
|
|
|
|
|
Table 8: Newly Increased Production and Operation Capacity through Fixed Assets Investment in 2024
|
Item |
Unit |
Volume |
|
|
|
|
|
Newly increased alternating current transformer equipment with a capacity of over 220 kilovolts |
10,000 kilovolt-amperes |
32119 |
|
New railways put into operation |
kilometer |
3113 |
|
Of which: high-speed railways |
kilometer |
2457 |
|
Extended or new double-track railways put into operation |
kilometer |
2687 |
|
Electrified railways put into operation |
kilometer |
3936 |
|
Length of new and rebuilt highways |
kilometer |
8968 |
|
New throughput capacity of berths for over 10,000-tonnage ships |
10,000 tons/year |
27106 |
|
New civil transportation airports |
- |
4 |
|
New lines of optical-fiber cables |
10,000 km |
856 |
|
|
|
|
In 2024, the investment in real estate development was 10,028.0 billion yuan, down by 10.6 percent over the previous year[47]. Of this total, the investment in residential buildings reached 7,604.0 billion yuan, a decrease of 10.5 percent, that in office buildings was 416.0 billion yuan, down by 9.0 percent, and that in buildings for commercial business was 694.4 billion yuan, down by 13.9 percent. In 2024, the floor space of newly-built commercial buildings sold[48] was 973.85 million square meters. The floor space of second-hand housing online transactions[49] reached 718.12 million square meters. The floor space of newly-built commercial buildings for sale was 753.27 million square meters at the end of 2024, among which the floor space of the commercial residential buildings for sale was 390.88 million square meters.
Table 9: Main Indicators for Real Estate Development and Sales and Growth Rates in 2024
|
Item |
Unit |
Volume |
Increase over 2023 (%) |
|
|
|
|
|
|
Investment in real estate development |
100 million RMB |
100280 |
-10.6 |
|
Of which: residential buildings |
100 million RMB |
76040 |
-10.5 |
|
Floor space of buildings under construction |
10000 square meters |
733247 |
-12.7 |
|
Of which: residential buildings |
10000 square meters |
513330 |
-13.1 |
|
Floor space of buildings newly started |
10000 square meters |
73893 |
-23.0 |
|
Of which: residential buildings |
10000 square meters |
53660 |
-23.0 |
|
Floor space of buildings completed |
10000 square meters |
73743 |
-27.7 |
|
Of which: residential buildings |
10000 square meters |
53741 |
-27.4 |
|
Floor space of newly-built commercial buildings sold |
10000 square meters |
97385 |
-12.9 |
|
Of which: residential buildings |
10000 square meters |
81450 |
-14.1 |
|
Funds for investment this year of real estate development enterprises |
100 million RMB |
107661 |
-17.0 |
|
Of which: domestic loans |
100 million RMB |
15217 |
-6.1 |
|
individual mortgage |
100 million RMB |
15661 |
-27.9 |
|
|
|
|
|
In 2024, 1.80 million units of government-subsidized housing for sale, government-subsidized rental housing and public rental housing were started to be built or made available; 1.89 million units of resettlement housing for urban village renovation were started to be built or made available, 79 thousand units of dilapidated housing in urban areas were started to be renovated; 58 thousand old urban residential communities were newly started to be renovated, benefiting 9.66 million households; renovation on dilapidated housing and for earthquake resistance of housing in rural areas were started for 239 thousand households, targeting key groups such as low-income rural population.
VII. Foreign Economic Relations
The total value of imports and exports of goods in 2024 reached 43,846.8 billion yuan, up by 5.0 percent over that of the previous year. Of this total, the value of goods exported was 25,454.5 billion yuan, up by 7.1 percent; the value of goods imported was 18,392.3 billion yuan, up by 2.3 percent. The surplus of trade in goods reached 7,062.3 billion yuan. The total value of imports and exports between China and countries along the Belt and Road[50] was 22,068.5 billion yuan, an increase of 6.4 percent over that of the previous year. Of this total, the value of exports was 12,209.5 billion yuan, up by 9.6 percent; the value of imports was 9,858.9 billion yuan, up by 2.7 percent. The total value of imports and exports between China and other Regional Comprehensive Economic Partnership (RCEP) member countries[51] was 13,164.5 billion yuan, up by 4.5 percent over that of the previous year. The total value of imports and exports by private enterprises was 24,332.9 billion yuan, up by 8.8 percent over that of the previous year, accounting for 55.5 percent of the total value of imports and exports. Of this total, the value of exports was 16,471.7 billion yuan, up by 9.4 percent.
Figure 16: Total Value of Imports and Exports of Goods 2020-2024
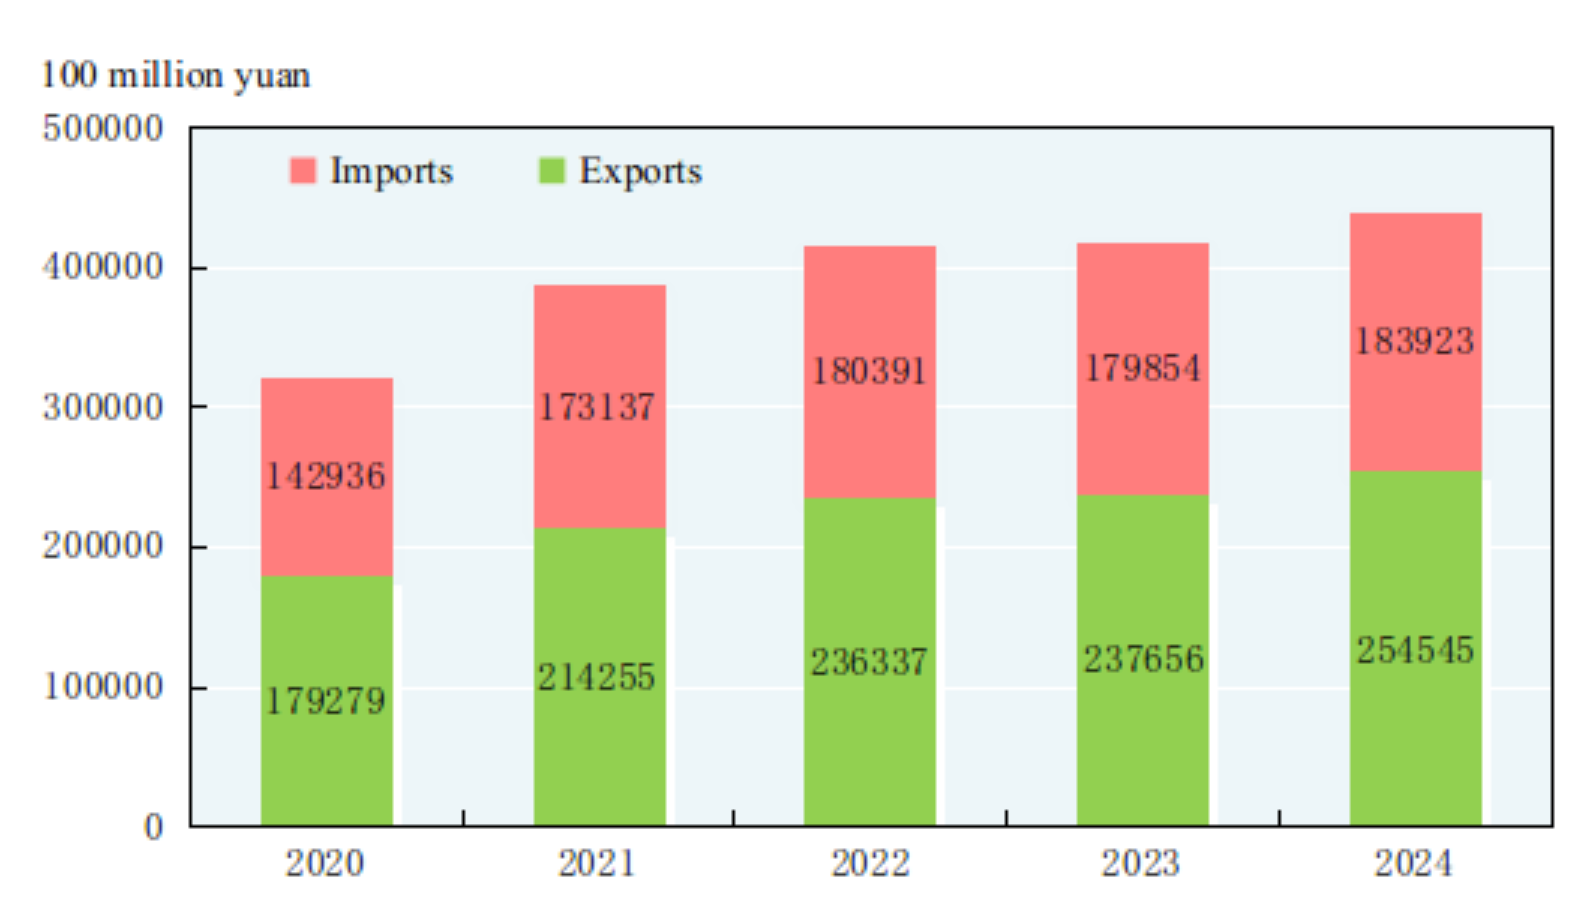
Table 10: Total Value and Growth Rates of Imports and Exports of Goods in 2024
|
Item |
Value (100 million yuan) |
Increase over 2023 (%) |
|
|
|
|
|
Total value of imports and exports of goods |
438468 |
5.0 |
|
Exports |
254545 |
7.1 |
|
Of which: General trade |
166466 |
8.5 |
|
Processing trade |
50201 |
2.4 |
|
Of which: Mechanical and electronic products |
151246 |
8.7 |
|
High & new technology products |
62792 |
6.0 |
|
Imports |
183923 |
2.3 |
|
Of which: General trade |
114827 |
-1.9 |
|
Processing trade |
28920 |
7.0 |
|
Of which: Mechanical and electronic products |
70095 |
7.3 |
|
High & new technology products |
53584 |
11.9 |
|
Trade surplus in goods |
70623 |
22.2 |
|
|
|
|
Table 11: Volume and Value of Main Export Commodities and the Growth Rates in 2024
|
Item |
Unit |
Volume |
Increase over 2023 (%) |
Value (100 million yuan) |
Increase over 2023 (%) |
|
|
|
|
|
|
|
|
Rolled steel |
10000 tons |
11072 |
22.7 |
5950 |
0.4 |
|
Textile yarns and textile articles |
— |
— |
— |
10102 |
7.0 |
|
Clothes and clothing accessories |
— |
— |
— |
11326 |
1.4 |
|
Footwear |
10000 pairs |
920152 |
3.3 |
3336 |
-3.8 |
|
Furniture and parts |
— |
— |
— |
4830 |
7.0 |
|
Luggage and similar containers |
10000 tons |
362 |
9.6 |
2458 |
-2.0 |
|
Toys |
— |
— |
— |
2837 |
-0.7 |
|
Plastic articles |
— |
— |
— |
7549 |
6.7 |
|
Integrated circuits |
100 million pieces |
2981 |
11.6 |
11352 |
18.7 |
|
Automatic data processing machines and components |
— |
— |
— |
14661 |
11.2 |
|
Mobile phones |
10000 sets |
81394 |
1.5 |
9559 |
-2.4 |
|
Containers |
10000 units |
545 |
135.7 |
1213 |
108.6 |
|
Liquid crystal display modules |
10000 units |
189264 |
11.9 |
2066 |
10.3 |
|
Motor vehicles (including chassis) |
10000 sets |
641 |
22.8 |
8347 |
16.5 |
|
|
|
|
|
|
|
Table 12: Volume and Value of Main Import Commodities and the Growth Rates in 2024
|
Item |
Unit |
Volume |
Increase over 2023 (%) |
Value (100 million yuan) |
Increase over 2023 (%) |
|
|
|
|
|
|
|
|
Soybean |
10000 tons |
10503 |
6.5 |
3751 |
-9.8 |
|
Edible vegetable oil |
10000 tons |
716 |
-26.8 |
528 |
-27.9 |
|
Iron ore and concentrate |
10000 tons |
123655 |
4.9 |
9406 |
-1.4 |
|
Coal and lignite |
10000 tons |
54270 |
14.4 |
3705 |
-0.7 |
|
Crude oil |
10000 tons |
55342 |
-1.9 |
23108 |
-2.7 |
|
Petroleum products refined |
10000 tons |
4823 |
1.0 |
2083 |
5.7 |
|
Natural gas |
10000 tons |
13169 |
9.9 |
4637 |
2.5 |
|
Plastics in primary forms |
10000 tons |
2898 |
-2.1 |
3117 |
-2.0 |
|
Paper pulp |
10000 tons |
3435 |
-6.3 |
1593 |
-4.3 |
|
Rolled steel |
10000 tons |
681 |
-10.9 |
819 |
-8.1 |
|
Unwrought copper and its alloys |
10000 tons |
568 |
3.4 |
3848 |
14.7 |
|
Integrated circuits |
100 million pieces |
5492 |
14.6 |
27445 |
11.7 |
|
Motor vehicles (including chassis) |
10000 sets |
71 |
-11.7 |
2785 |
-16.1 |
|
|
|
|
|
|
|
Table 13: Imports and Exports of Goods with Major Countries and Regions, Growth Rates and Proportions in 2024
|
Country or region |
Exports (100 million yuan) |
Increase over 2023 (%) |
Proportion of the total (%) |
Imports (100 million yuan) |
Increase over 2023 (%) |
Proportion of the total (%) |
|
|
|
|
|
|
|
|
|
ASEAN |
41736 |
13.4 |
16.4 |
28163 |
3.2 |
15.3 |
|
European Union |
36751 |
4.3 |
14.4 |
19164 |
-3.3 |
10.4 |
|
United States |
37337 |
6.1 |
14.7 |
11641 |
1.2 |
6.3 |
|
Republic of Korea |
10415 |
-0.5 |
4.1 |
12931 |
13.6 |
7.0 |
|
Hong Kong, China |
20719 |
7.3 |
8.1 |
1321 |
37.8 |
0.7 |
|
Japan |
10816 |
-2.3 |
4.2 |
11119 |
-1.7 |
6.0 |
|
Taiwan, China |
5350 |
11.0 |
2.1 |
15498 |
10.5 |
8.4 |
|
Russia |
8212 |
5.0 |
3.2 |
9198 |
1.0 |
5.0 |
|
Brazil |
5128 |
23.3 |
2.0 |
8258 |
-4.4 |
4.5 |
|
India |
8574 |
3.6 |
3.4 |
1280 |
-1.7 |
0.7 |
|
South Africa |
1552 |
-6.5 |
0.6 |
2180 |
-3.0 |
1.2 |
|
|
|
|
|
|
|
|
The total value of imports and exports of services in 2024 was 7,523.8 billion yuan, up by 14.4 percent over that of the previous year. The export value of services was 3,175.6 billion yuan, up by 18.2 percent. The import value of services was 4,348.2 billion yuan, up by 11.8 percent. The trade deficit in imports and exports of services was 1,172.7 billion yuan.
The year 2024 witnessed the new establishment of 59,080 foreign-invested enterprises, up by 9.9 percent over that of the previous year, and the foreign investment actually utilized totaled 826.3 billion yuan, down by 27.1 percent, or 116.2 billion US dollars, down by 28.8 percent. Specifically, a total of 17,172 enterprises were newly established with investment from countries along the Belt and Road (including investment in China via free ports), up by 23.8 percent; and the direct foreign investment in China reached 114.7 billion yuan, down by 6.2 percent, or 16.1 billion US dollars, down by 8.4 percent. The foreign investment actually utilized by high technology industry reached 286.4 billion yuan, down by 32.3 percent, or 40.3 billion US dollars, down by 34.0 percent.
Table 14: Total Value of Foreign Direct Investment and the Growth Rates in 2024
|
|
Sector |
Enterprises |
Increase over 2023 (%) |
Actually Utilized Value (100 million yuan) |
Increase over 2023 (%) |
|
|
|
|
|
|
|
|
Total |
|
59080 |
9.9 |
8263 |
-27.1 |
|
Of which: |
Agriculture, Forestry, Animal Husbandry and Fishery |
374 |
-10.5 |
27 |
-46.0 |
|
|
Manufacturing |
3871 |
6.8 |
2212 |
-30.4 |
|
|
Production and Supply of Electricity, Heat Power, Gas and Water |
439 |
-22.7 |
284 |
-10.9 |
|
|
Transport, Storage and Post |
838 |
-3.3 |
112 |
-25.0 |
|
|
Information Transmission, Software and Information Technology Services |
3988 |
6.0 |
526 |
-53.6 |
|
|
Wholesale and Retail |
20854 |
15.8 |
584 |
-15.4 |
|
|
Real Estate |
612 |
-10.5 |
406 |
-49.9 |
|
|
Leasing and Business Services |
11158 |
4.5 |
1815 |
-0.2 |
|
|
Household Services, Repair and Other Services |
859 |
18.3 |
35 |
3.6 |
|
|
|
|
|
|
|
In 2024, the non-financial outbound direct investment reached 1,024.5 billion yuan, up by 11.7 percent over that of the previous year, or 143.8 billion US dollars, up by 10.5 percent. Of this total, the investment to countries along the Belt and Road reached 239.9 billion yuan, up by 6.5 percent, or 33.7 billion US dollars, up by 5.4 percent.
Table 15: Total Value and Growth Rates of Non-financial Outbound Direct Investment in 2024
|
|
Sector |
Value (100 million US dollars) |
Increase over 2023 (%) |
|
|
|
|
|
|
Total |
|
1438 |
10.5 |
|
Of which: |
Agriculture, Forestry, Animal Husbandry and Fishery |
14 |
72.0 |
|
|
Mining |
125 |
80.1 |
|
|
Manufacturing |
296 |
6.2 |
|
|
Production and Supply of Electricity, Heat Power, Gas and Water |
64 |
109.5 |
|
|
Construction |
40 |
-40.0 |
|
|
Wholesale and Retail |
282 |
-3.6 |
|
|
Transport, Storage and Post |
74 |
13.7 |
|
|
Information Transmission, Software and Information Technology Services |
58 |
18.8 |
|
|
Real Estate |
17 |
66.5 |
|
|
Leasing and Business Services |
404 |
19.9 |
|
|
|
|
|
In 2024, the accomplished business revenue through contracted overseas engineering projects was 1,182.0 billion yuan, up by 4.2 percent over that of the previous year, or 166.0 billion US dollars, up by 3.1 percent. Specifically, the accomplished business revenue from countries along the Belt and Road was 138.8 billion US dollars, up by 3.4 percent, accounting for 83.6 percent of the accomplished business revenue through contracted overseas engineering projects. The number of labor forces sent abroad through overseas labor contracts was 0.41 million.
VIII. Finance
The national general public budget revenue reached 21,970.2 billion yuan in 2024, up by 1.3 percent over that of the previous year, of which the tax revenue amounted to 17,497.2 billion yuan, down by 3.4 percent. The national general public budget expenditure reached 28,461.2 billion yuan, up by 3.6 percent over that of the previous year. The current main policies supporting sci-tech innovation and the development of manufacturing saw the tax cuts, fee reductions and tax refunds totaling 2,629.3 billion yuan in 2024.
Figure 17: National General Public Budget Revenue 2020-2024
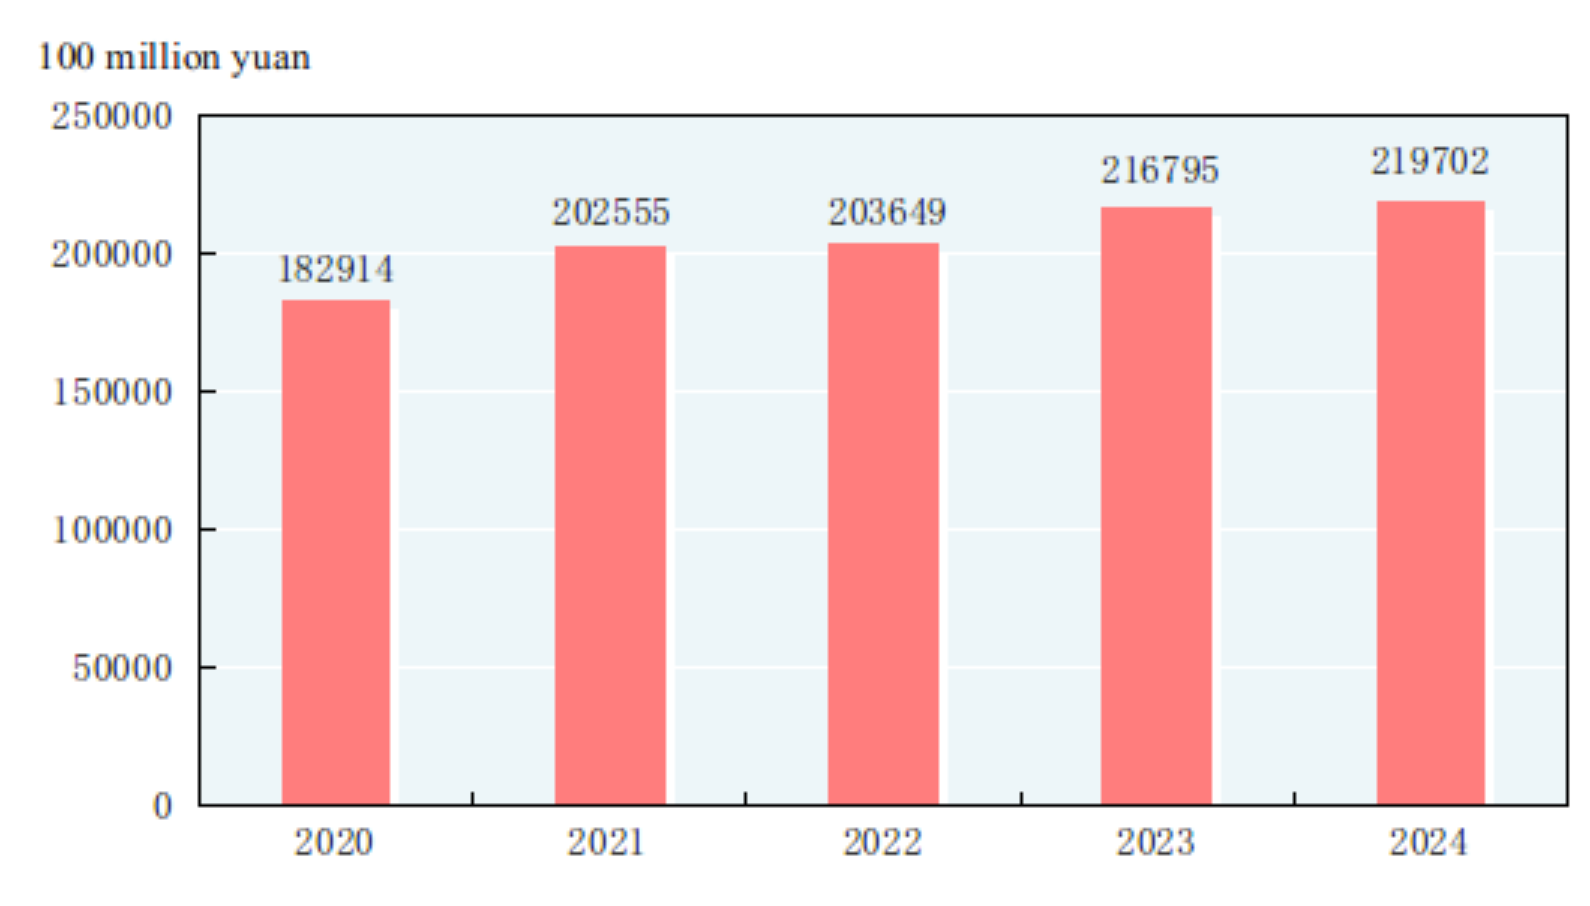
Note: Data for general public budget revenue from 2020 to 2023 as shown in the figure were final accounts and that of 2024 was the executive accounts.
By the end of 2024, money supply of broad sense (M2) was 313.5 trillion yuan, an increase of 7.3 percent over that by the end of the previous year. Money supply of narrow sense (M1) was 67.1 trillion yuan, down by 1.4 percent. Cash in circulation (M0) was 12.8 trillion yuan, up by 13.0 percent.
In 2024, the aggregate financing to the real economy (AFRE) (flow)[52] reached 32.3 trillion yuan, or 3.3 trillion yuan less than that in 2023 on a comparable basis. The AFRE (stock)[53] totaled 408.3 trillion yuan at the end of 2024, up by 8.0 percent over that at the end of 2023 on a comparable basis. Specifically, loans granted to the real economy in Renminbi stood at 252.5 trillion yuan, up by 7.2 percent. Savings deposit in Renminbi and foreign currencies in all items of financial institutions totaled 308.4 trillion yuan at the end of 2024, an increase of 18.5 trillion yuan compared with that at the beginning of the year. Of this total, the savings deposit in Renminbi stood at 302.3 trillion yuan, an increase of 18.0 trillion yuan. Loans in Renminbi and foreign currencies in all items of financial institutions reached 259.6 trillion yuan, an increase of 17.3 trillion yuan. Of this total, loans in Renminbi were 255.7 trillion yuan, an increase of 18.1 trillion yuan. Inclusive loans to micro and small businesses in Renminbi[54] reached 32.9 trillion yuan, an increase of 4.2 trillion yuan. Loans to agriculture, rural areas and rural residents[55] in Renminbi and foreign currencies were 51.4 trillion yuan, an increase of 4.7 trillion yuan. Medium and long-term loans to the manufacturing sector in Renminbi reached 14.0 trillion yuan, an increase of 1.6 trillion yuan. Green loans were 36.6 trillion yuan, an increase of 6.5 trillion yuan.
Table 16: Savings Deposit and Loans in RMB and Foreign Currencies in All Financial Institutions and the Growth Rates at the End of 2024
|
Item |
Year-end figure (100 million yuan) |
Increase over 2023 (%) |
|
|
|
|
|
Savings deposit |
3083849 |
6.4 |
|
Domestic households |
1522529 |
10.4 |
|
Deposits in RMB |
1512509 |
10.4 |
|
Domestic non-financial enterprises |
814791 |
-0.4 |
|
Loans |
2595750 |
7.2 |
|
Domestic short-term loans |
653951 |
5.0 |
|
Domestic medium- and long-term loans |
1713857 |
7.7 |
|
|
|
|
Loans in Renminbi from rural financial institutions (rural credit cooperatives, rural cooperation banks and rural commercial banks) totaled 31.5 trillion yuan by the end of 2024, an increase of 2.1 trillion yuan as compared with that at the beginning of the year. Consumption loans in Renminbi from all financial institutions totaled 58.7 trillion yuan, an increase of 0.7 trillion yuan. Of the total, household short-term consumption loans totaled 10.2 trillion yuan, a decrease of 0.2 trillion yuan, and household medium and long-term consumption loans reached 48.5 trillion yuan, an increase of 0.9 trillion yuan.
Funds raised through A-shares issued on Shanghai and Shenzhen Stock Exchanges[56] amounted to 425.1 billion yuan in 2024, a decrease of 648.4 billion yuan from the previous year. A total of 77 new A-shares issued on Shanghai and Shenzhen Stock Exchanges raised 62.2 billion yuan worth of capital altogether, down by 279.6 billion yuan over that of the previous year. Of the total, 15 shares issued on the Science and Technology Innovation Board raised 15.2 billion yuan; refinancing of A-shares on Shanghai and Shenzhen Stock Exchanges (including public offerings, private placements, right issues, preferred shares and conversions of convertible bonds) raised 362.9 billion yuan, a decrease of 368.8 billion yuan over that of the previous year. Funds raised through Beijing Stock Exchanges[57] reached 4.8 billion yuan with 23 shares publicly issued. Market entities raised 13.4 trillion yuan through issuing bonds (including corporate bonds, enterprise bonds, asset-backed securities, national and local government bonds) on Shanghai, Shenzhen and Beijing Stock Exchanges. Specifically, 29 Real Estate Investment Trust Funds (REITs) in infrastructure sector were listed on Shanghai and Shenzhen Stock Exchanges, raising 65.5 billion yuan. There were 6,101 companies listed on National Equities Exchange and Quotations and 11.9 billion yuan raised by listed companies[58] in 2024.
In 2024, the issuance of corporate credit bonds[59] reached 14.8 trillion yuan, an increase of 1.0 trillion yuan over that of the previous year.
The premium of primary insurance received by the insurance companies[60] totaled 5,696.3 billion yuan in 2024, up by 5.7 percent over that of the previous year on a comparable basis. Of this total, life insurance premium of primary insurance amounted to 3,191.7 billion yuan, health and casualty insurance premium of primary insurance 1,071.5 billion yuan, and property insurance premium of primary insurance 1,433.1 billion yuan. An indemnity worth of 2,300.5 billion yuan was paid, of which, life insurance indemnity was 874.7 billion yuan, health and casualty insurance indemnity 444.9 billion yuan, and property insurance indemnity 981.0 billion yuan.
IX. Household Income and Consumption and Social Security
In 2024, the per capita disposable income nationwide was 41,314 yuan, an increase of 5.3 percent over that of the previous year or a real increase of 5.1 percent after deducting price factors. The median[61] of per capita disposable income nationwide was 34,707 yuan, up by 5.1 percent. In terms of permanent residence, the per capita disposable income of urban households was 54,188 yuan, up by 4.6 percent over that of 2023, or a real growth of 4.4 percent after deducting price factors. The median of per capita disposable income of urban households was 49,302 yuan, up by 4.6 percent. The per capita disposable income of rural households was 23,119 yuan, up by 6.6 percent over that of the previous year, or 6.3 percent in real terms after deducting price factors. The median of per capita disposable income of rural households was 19,605 yuan, up by 4.6 percent. The urban-rural per capita disposable income ratio was 2.34, narrowed by 0.05 over that of the previous year. Grouped by income quintile[62], the per capita disposable income of low-income group reached 9,542 yuan, the lower-middle-income group 21,608 yuan, the middle-income group 33,925 yuan, the upper-middle-income group 53,359 yuan and the high-income group 98,809 yuan. The per capita monthly income of migrant workers was 4,961 yuan, increased by 3.8 percent over that of the previous year. In 2024, the per capita disposable income of rural households from counties lifted out of poverty[63] was 17,522 yuan, up by 6.9 percent over that of 2023, or a real growth of 6.5 percent after deducting price factors.
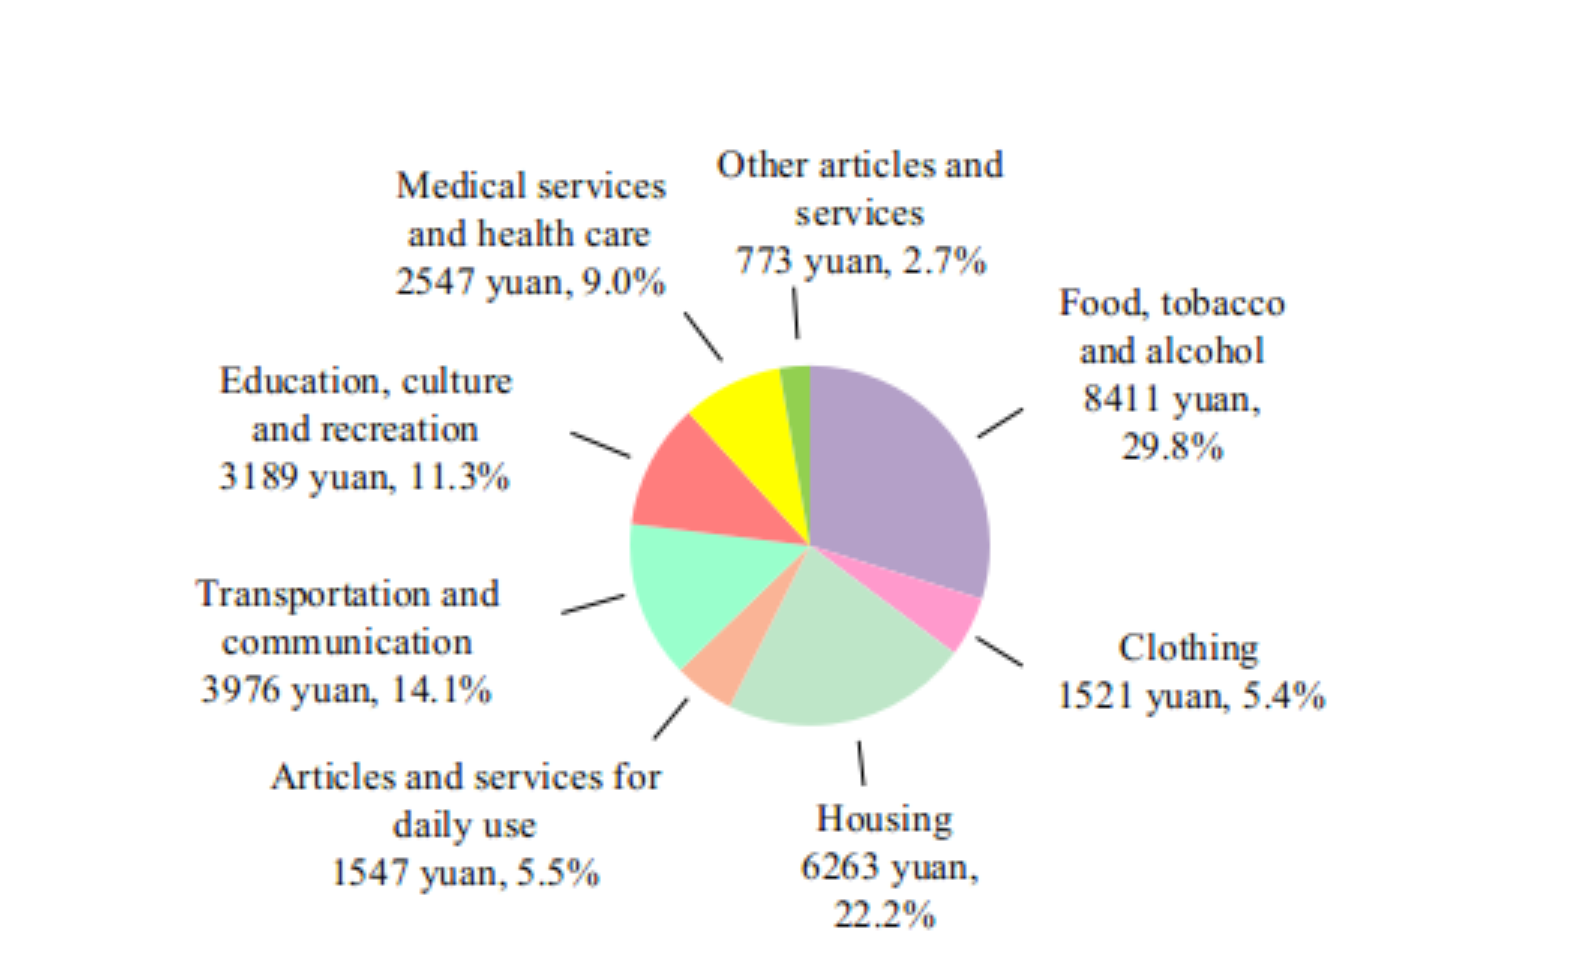
The national per capita consumption expenditure was 28,227 yuan, up by 5.3 percent over that of the previous year, or a real increase of 5.1 percent after deducting price factors. Specifically, the per capita consumption expenditure on services[64] totaled 13,016 yuan, up by 7.4 percent over that of the previous year, accounting for 46.1 percent of the per capita consumption expenditure. In terms of permanent residence, the per capita consumption expenditure of urban households was 34,557 yuan, up by 4.7 percent, or up by 4.5 percent in real terms after deducting price factors. The per capita consumption expenditure of rural households was 19,280 yuan, up by 6.1 percent, or a real increase of 5.8 percent after deducting price factors. The national Engel’s Coefficient stood at 29.8 percent, with that of urban and rural households standing at 28.8 percent and 32.3 percent respectively.
Figure 18: National Per Capita Disposable Income and the Growth Rates 2020-2024
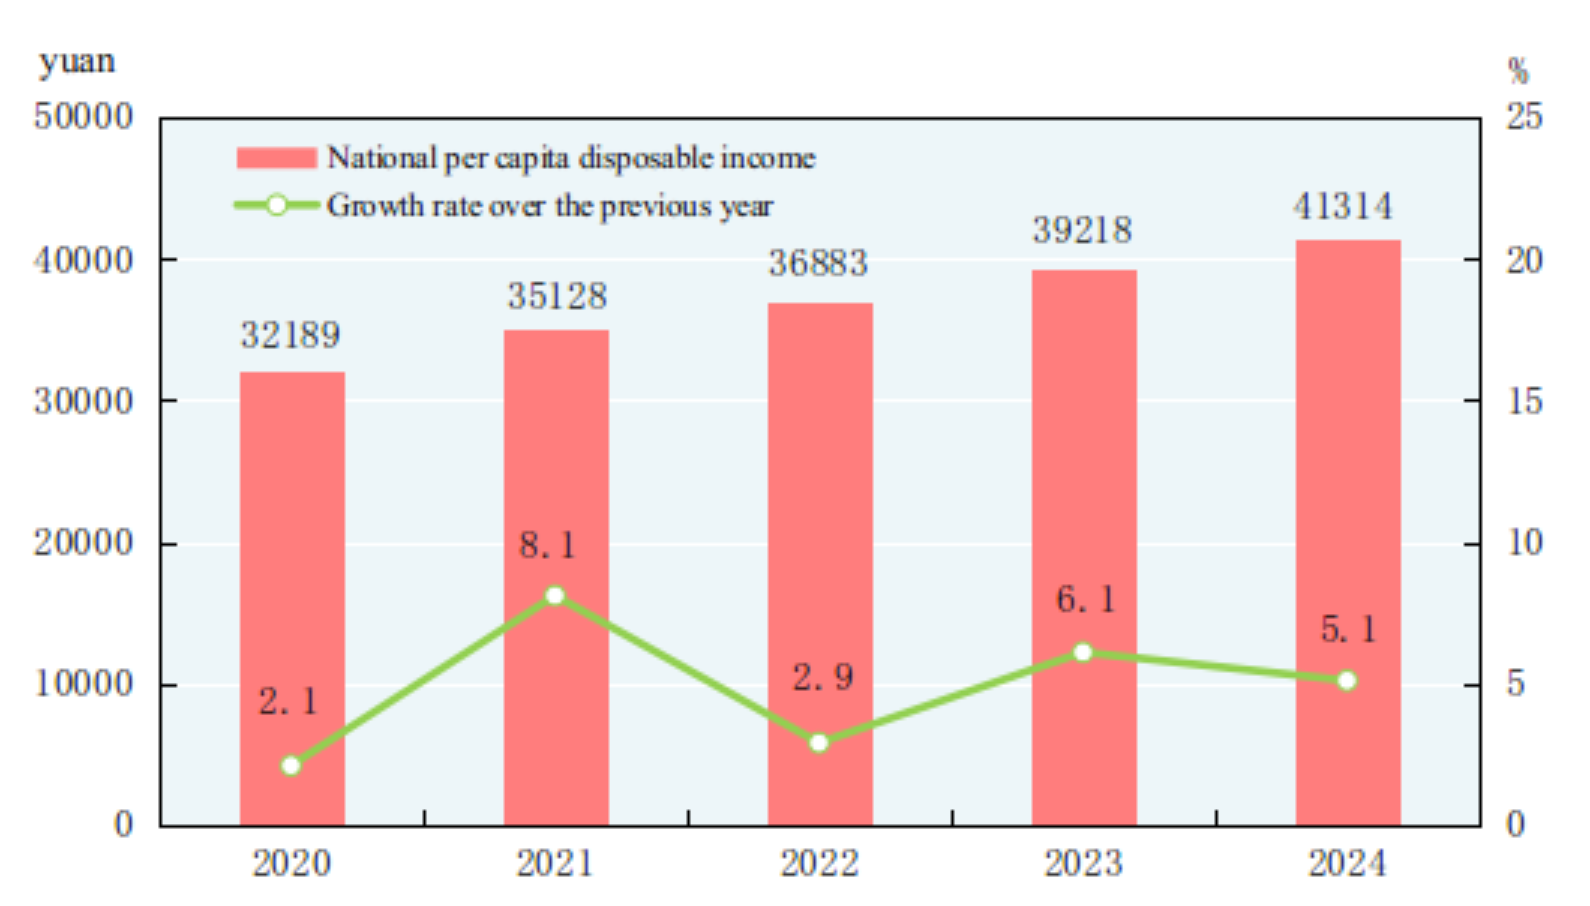
Figure 19: National Per Capita Consumption Expenditure and Composition in 2024
By the end of 2024, a total of 534.49 million people participated in the basic endowment insurance program for urban workers, an increase of 13.29 million over that by the end of 2023. A total of 538.30 million people participated in basic endowment insurance program for urban and rural residents, a decrease of 6.92 million. A total of 1,326.38 million people participated in basic medical insurance program. Of this total, 379.20 million people participated in the program for workers, and 947.18 million people participated in the program for urban and rural residents. A total of 245.89 million people participated in unemployment insurance program, an increase of 2.16 million. A total of 303.98 million people participated in work-related injury insurance, an increase of 2.24 million. A total of 252.98 million people participated in maternity insurance programs. By the end of 2024, minimum living allowances were granted to 6.25 million urban residents and 33.62 million rural residents, 4.39 million rural residents living in extreme poverty[65] received relief and assistance and 7.72 million person-times of temporary assistance[66] were provided. National pensions and subsidies were regularly provided to 8.22 million ex-servicemen and other entitled people in 2024.
By the end of 2024, there were altogether 43 thousand social welfare institutions providing accommodation, of which 40 thousand were elderly care institutions and 1,045 were institutions for child welfare, assistance and protection. The social welfare institutions provided 8.253 million beds[67], of which 7.991 million were for the elderly and 97 thousand were for children.
X. Science & Technology and Education
Expenditures on research and experimental development activities (R&D) were 3,613.0 billion yuan in 2024, up by 8.3 percent over that of 2023, accounting for 2.68 percent of GDP. Of this total, 249.7 billion yuan was used for basic research programs, up by 10.5 percent over that of 2023, accounting for 6.91 percent of expenditures on R&D. A total of 54.9 thousand projects were financed by the National Natural Science Foundation. By the end of 2024, there were altogether 206 national engineering research centers included into the new sequence management and 1,798 enterprise technology centers recognized by the National Development and Reform Commission. The National Guiding Fund for Transformation of Scientific and Technological Achievements established 36 sub-funds, with a total funding of 62.4 billion yuan. There were 1,606 state-level technology business incubators[68], and 2,376 national mass makerspaces[69]. A total of 1.045 million invention patents were authorized, up by 13.5 percent over that of the previous year. The number of PCT patent applications accepted[70] was 75 thousand. By the end of 2024, the number of valid invention patents was 5.689 million, up by 14.0 percent over that by the end of 2023. The number of high-value invention patents per 10,000 people[71] was 14. Trademark registration totaled 4.781 million, up by 9.1 percent over that of the previous year. A total of 0.99 million technology contracts were signed with 6,835.4 billion yuan worth of contracted technology transactions, up by 11.2 percent over that of the previous year. The proportion of citizens with scientific literacy[72] in China reached 15.37 percent.
Figure 20: Expenditure on Research and Experimental Development Activities (R&D) and the Growth Rates 2020-2024
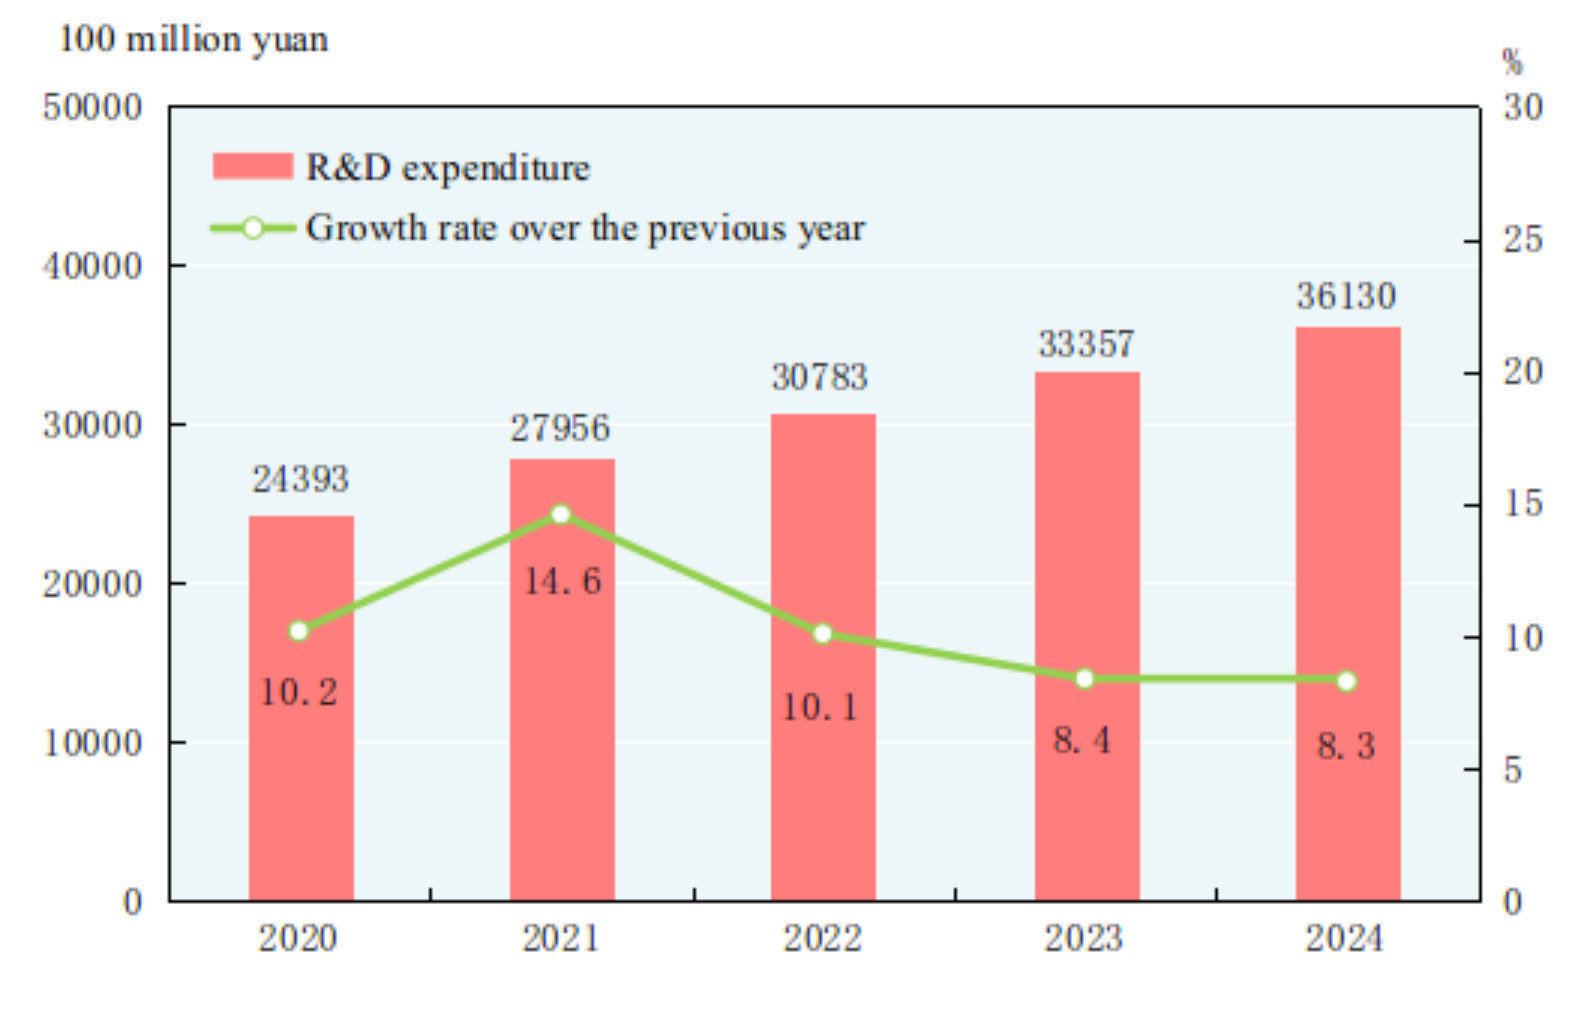
Table 17: Number of Patents Authorized and Valid Patents in 2024
|
Item |
Patents (10,000) |
Increase over 2023 (%) |
|
|
|
|
|
Number of invention patents authorized |
104.5 |
13.5 |
|
Of which: domestic |
93.2 |
14.6 |
|
Number of utility model patents authorized |
201.0 |
-3.9 |
|
Number of appearance design patents authorized |
64.3 |
0.8 |
|
Number of valid invention patents at the end of the year |
568.9 |
14.0 |
|
Of which: domestic |
468.2 |
16.6 |
|
Number of valid utility model patents at the end of the year |
1165.7 |
-3.9 |
|
Number of valid appearance design patents at the end of the year |
307.4 |
-4.9 |
|
|
|
|
The year 2024 saw a total of 68 successful space launches. China’s Chang’e-6 spacecraft successfully brought back the first samples from the far side of the Moon. The first reusable and returnable test satellite was successfully retrieved. The number of pulsars discovered by China’s Five-hundred-meter Aperture Spherical Radio Telescope (FAST) has exceeded 1,000. The world’s first high-definition geologic atlas of the whole Moon was officially released. The plasma current of China’s HL-3 tokamak exceeded 1.5 MA. A quantum simulator that outperforms classical computers was successfully constructed for the first time. A new-generation meteorological supercomputer system was launched. China’s first domestically designed and built deep-ocean drilling vessel called “Meng Xiang” was officially commissioned. A new-generation medium-sized multi-role stealth fighter jet made its debut at the 15th China International Aviation and Aerospace Exhibition.
By the end of 2024, there were altogether 874 national quality inspection centers. There were 1,230 agencies for product quality, management system and service certification which certified accumulatively 1.10 million enterprises. A total of 3,154 national standards were developed or revised in the year, including 2,001 new standards. The qualification rate of manufactured products[73] reached 93.93 percent.
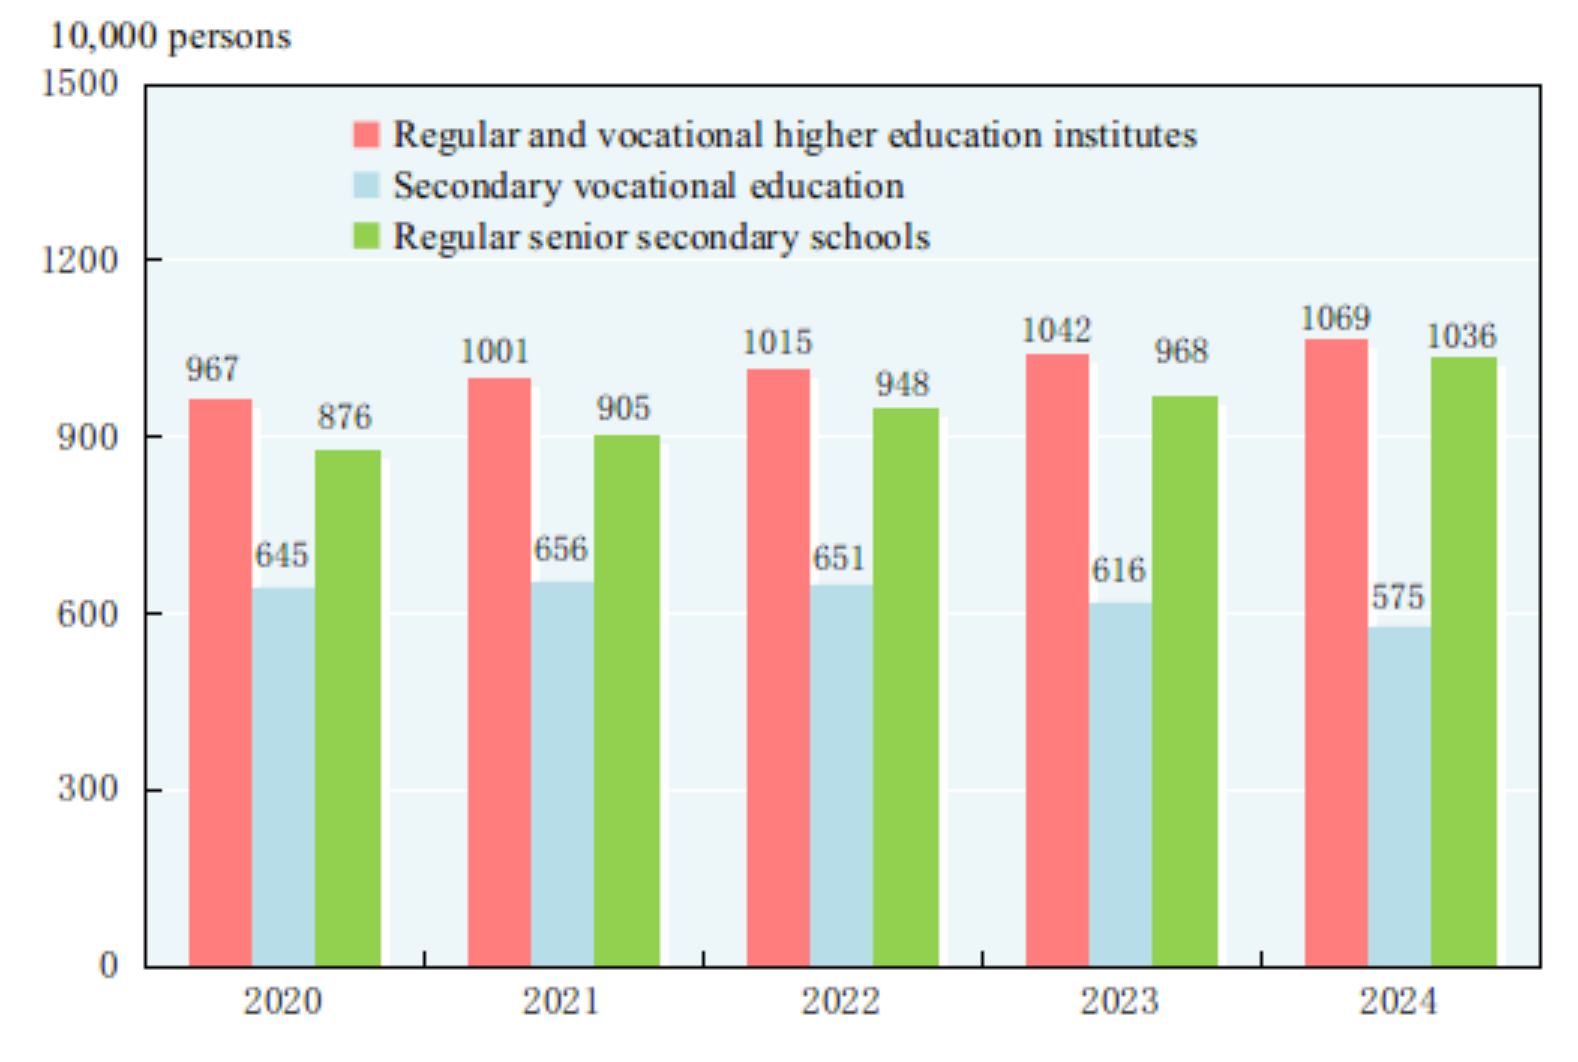
In 2024, graduate institutes enrolled 4.095 million students with 1.357 million entrants and 1.084 million graduates. Total enrollment in undergraduate programs in regular and vocational higher education institutes[74] was 38.913 million with 10.689 million entrants and 10.594 million graduates. The enrollment in secondary vocational education[75] was 16.594 million with 5.754 million entrants and 5.422 million graduates. Regular senior secondary schools had 29.223 million enrolled students, including 10.362 million entrants and 8.910 million graduates. Students enrolled in junior secondary schools totaled 53.862 million, including 18.488 million entrants and 16.982 million graduates. The country had a primary education enrollment of 105.844 million, including 16.166 million entrants and 18.573 million graduates. There were 0.916 million students enrolled in special education schools, with 0.158 million entrants and 0.177 million graduates. Kindergartens accommodated 35.840 million children. The retention rate in nine-year compulsory education reached 95.9 percent, and the gross enrollment ratio for senior secondary education reached 92.0 percent.
Figure 21: Entrants in Education 2020-2024
XI. Culture and Tourism, Public Health and Sports
By the end of 2024, there were 1,888 art-performing groups affiliated to government culture and tourism departments throughout China. A total of 3,248 public libraries received[76] 1,341.97 million person-times of visits nationwide. There were 3,516 cultural centers. Subscribers to cable television programs numbered 209 million, among which 201 million subscribed to digital cable television programs. By the end of 2024, radio broadcasting and television program coverage rates were 99.7 percent and 99.8 percent respectively. A total of 3,490 episodes of 115 TV series and 108,271 minutes of TV cartoons were produced in 2024. The country developed 612 feature movies and 261 popular science movies, documentaries, animation and special movies[77]. A total of 24.9 billion copies of newspapers and 1.8 billion copies of magazines were issued, and 11.8 billion copies of books were published. The average number of books possessed per person[78] was 8.39 copies. By the end of the year, there were 4,174 archives in China and 252.38 million files were accessible to the public. The business revenue of enterprises above the designated size engaged in culture and related industries reached 14,151.0 billion yuan, up by 6.0 percent over that of the previous year on a comparable basis.
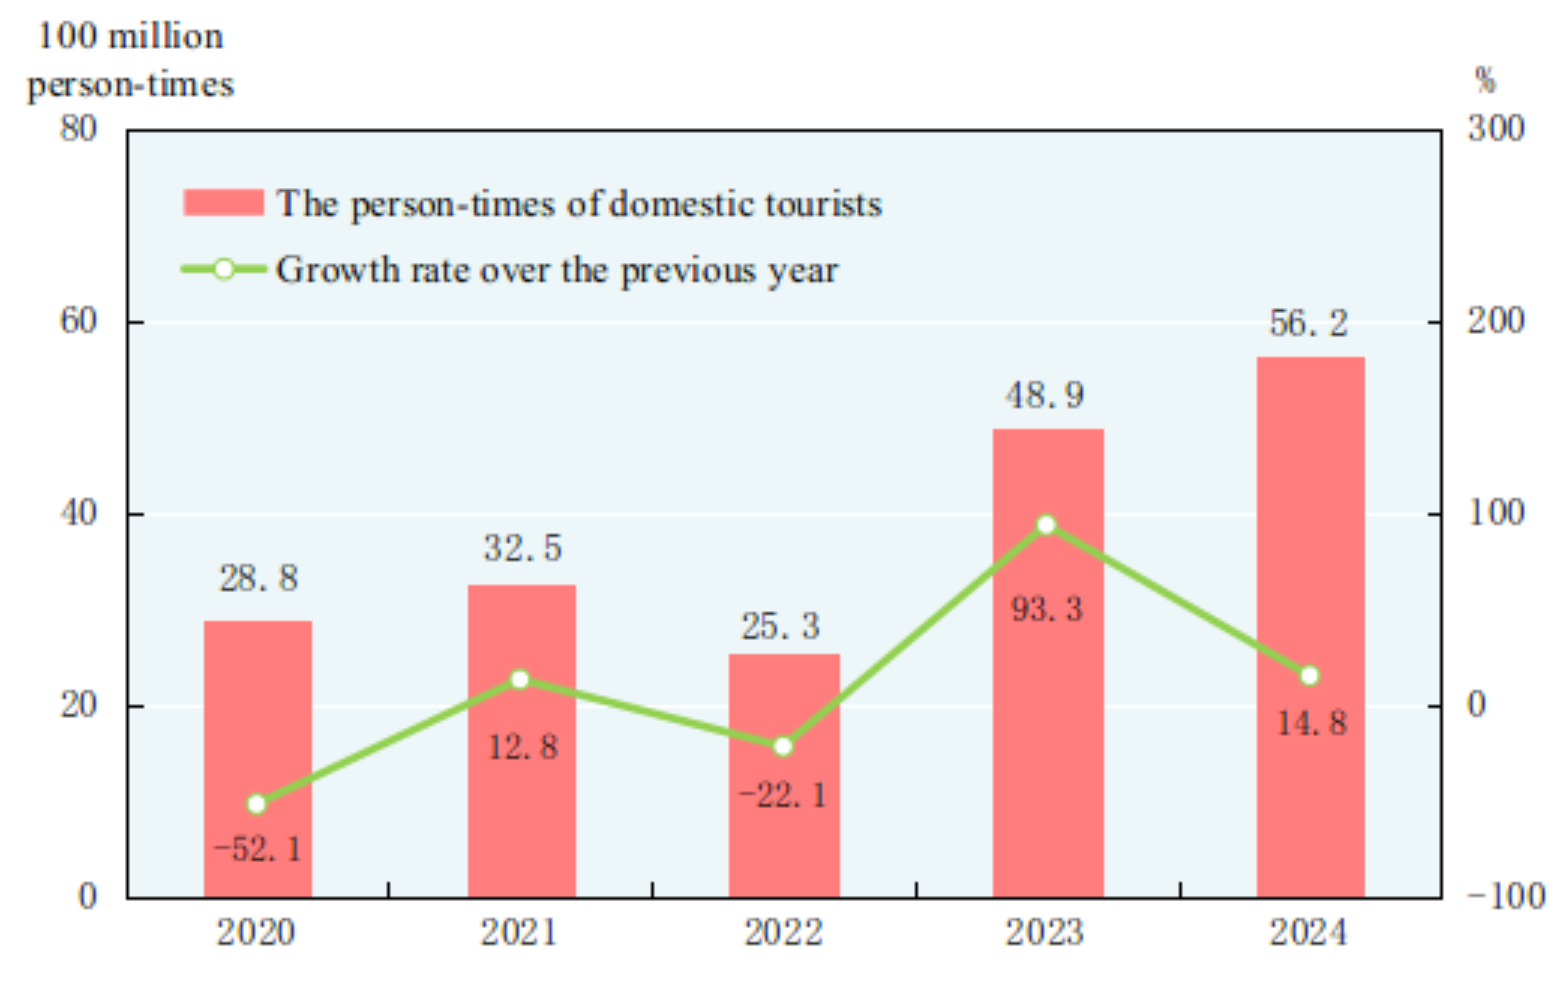
In 2024, a total of 5.62 billion domestic trips were made, up by 14.8 percent over that of the previous year. Of this total, the number of trips made by urban residents was 4.37 billion, an increase of 16.3 percent; and the number of trips made by rural residents was 1.25 billion, an increase of 9.9 percent. The expenditure of domestic tourists was 5,754.3 billion yuan, an increase of 17.1 percent. Of this total, tourists from urban areas spent 4,929.3 billion yuan, an increase of 18.0 percent; and tourists from rural areas spent 825.0 billion yuan, an increase of 12.2 percent. The number of inbound visits to China totaled 131.90 million, up by 60.8 percent. Of this total, 26.94 million were made by foreigners and 104.96 million by Chinese compatriots from Hong Kong, Macao and Taiwan. The expenditures of inbound visitors to China totaled 94.2 billion US dollars, up by 77.8 percent. The number of inbound trips made by foreigners to China under the visa-free policies totaled 20.12 million, up by 112.3 percent. The number of China’s outbound visits totaled 145.89 million. Of this total, 140.15 million were private visits and 97.12 million were to Hong Kong, Macao and Taiwan.
Figure 22: Person-times of Domestic Tourists and the Growth Rates 2020-2024
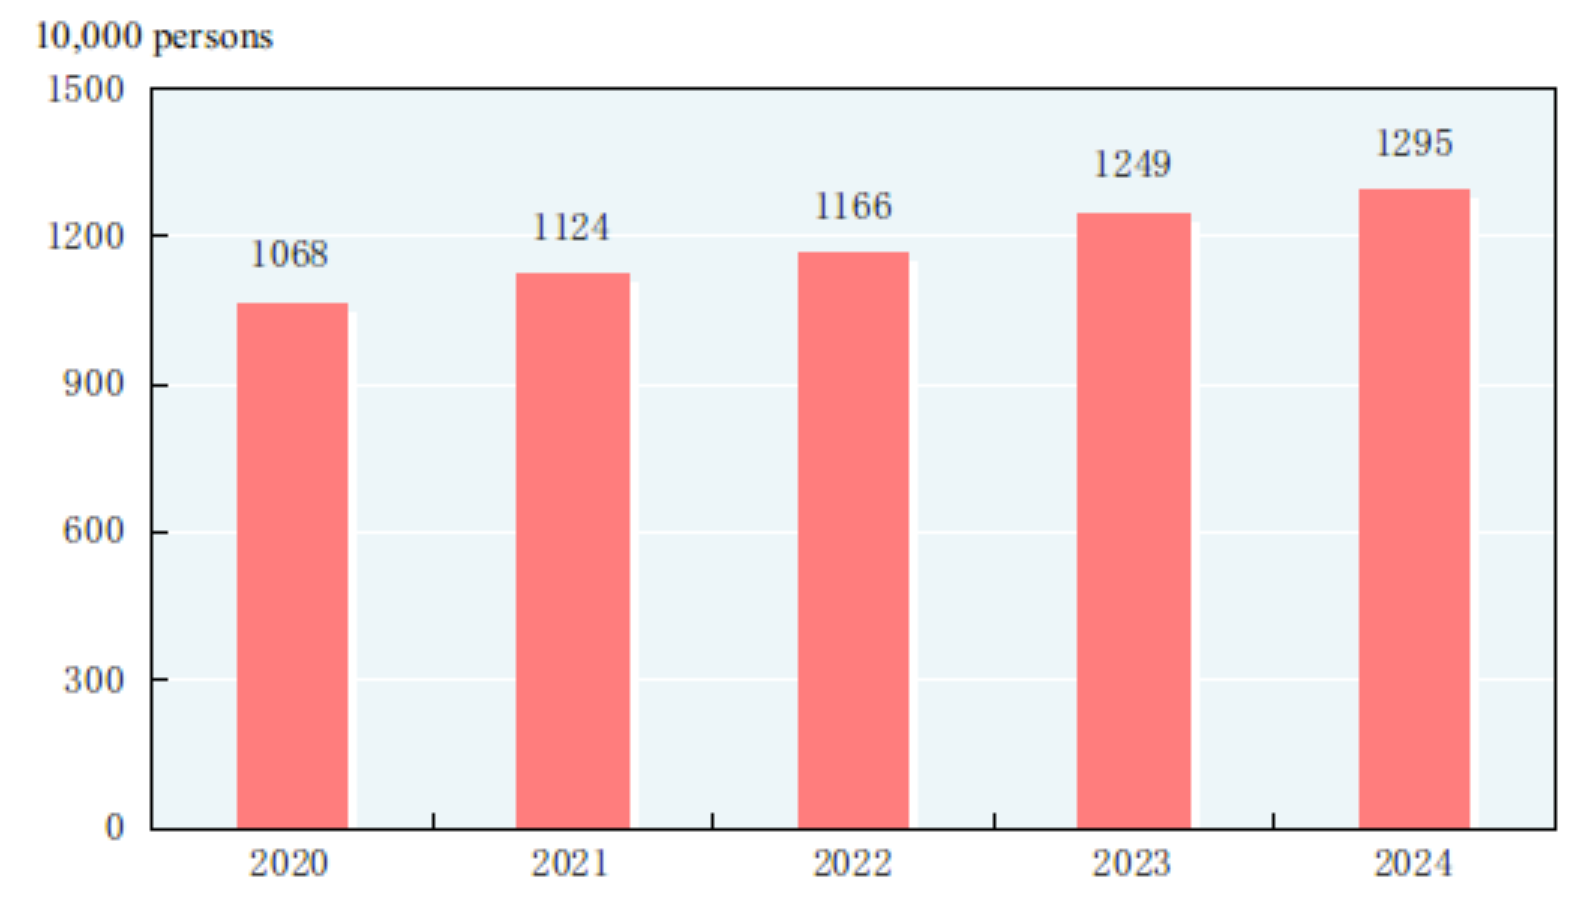
By the end of 2024, there were 1.092 million medical and health institutions in China, including 39 thousand hospitals. Of all the hospitals, 12 thousand were public, and 27 thousand were private. Of the 1.040 million medical and health institutions at grass-root level, 33 thousand were town and township health centers, 37 thousand community health service centers, 398 thousand clinics and 571 thousand village clinics. Of the 9,217 professional public health institutions (excluding health monitoring institutions), 3,429 were disease control and prevention centers. By the end of 2024, there were 12.95 million medical technical personnel in China, including 5.05 million licensed doctors and licensed assistant doctors and 5.84 million registered nurses. The medical and health institutions in China had 10.37 million beds, of which hospitals had 8.18 million and township health centers had 1.51 million. The total number of medical visits[79] and hospital discharges[80] in 2024 reached 10.11 billion and 0.31 billion respectively.
Figure 23: Year-end Number of Medical Technical Personnel 2020-2024
There were altogether 4.842 million sports venues[81]. The sports venue area[82] totaled 4.23 billion square meters and the per capita sports venue area was 3.0 square meters. In 2024, Chinese athletes won 194 world championships in 33 sport competitions and broke 19 world records. At the 33rd Summer Olympic Games, Chinese athletes won 40 gold medals and a total of 91 medals, marking the best performance at an overseas Olympic Games, joint first place in the Olympic gold medal tally and second in the overall medal table. Chinese physically-challenged athletes won 333 world championships in 45 international sport competitions. At the 17th Paralympic Games, Chinese athletes won 94 gold medals and a total of 220 medals, topping the gold medal tally and overall medal count for six times in a row at the Paralympic Games.
XII. Resources, Environment and Emergency Management
In 2024, the total supply of state-owned land for construction use[83] was 606 thousand hectares, a decrease of 19.1 percent over that of the previous year. Of this total, the land supply for industry, mining and warehousing was 155 thousand hectares, down by 11.5 percent; that for real estate[84] was 72 thousand hectares, down by 14.7 percent; and that for infrastructure facilities was 380 thousand hectares, down by 22.5 percent.
The total stock of water resources in 2024 was 3,001.0 billion cubic meters. With an increase of 0.3 percent over 2023, the total water consumption was 592.5 billion cubic meters, of which water consumption for domestic use was up by 1.9 percent, for industrial use down by 0.2 percent, for agricultural use down by 0.7 percent, and the artificial recharge for environmental and ecological use grew by 7.8 percent. Water consumption per 10,000 yuan of GDP[85] was 46 cubic meters, a decline of 4.4 percent. Water consumption per 10,000 yuan of industrial value added was 25 cubic meters, down by 5.6 percent. The per capita water consumption was 421 cubic meters, up by 0.4 percent.
In 2024, the total area of afforestation reached 4.45 million hectares, of which 1.18 million hectares were afforested by manpower, accounting for 26.6 percent of the total. The land area improved by grass plantation[86] was 3.22 million hectares. By the end of 2024, there were 5 national parks. The newly treated land of soil erosion covered an area of 64 thousand square kilometers.
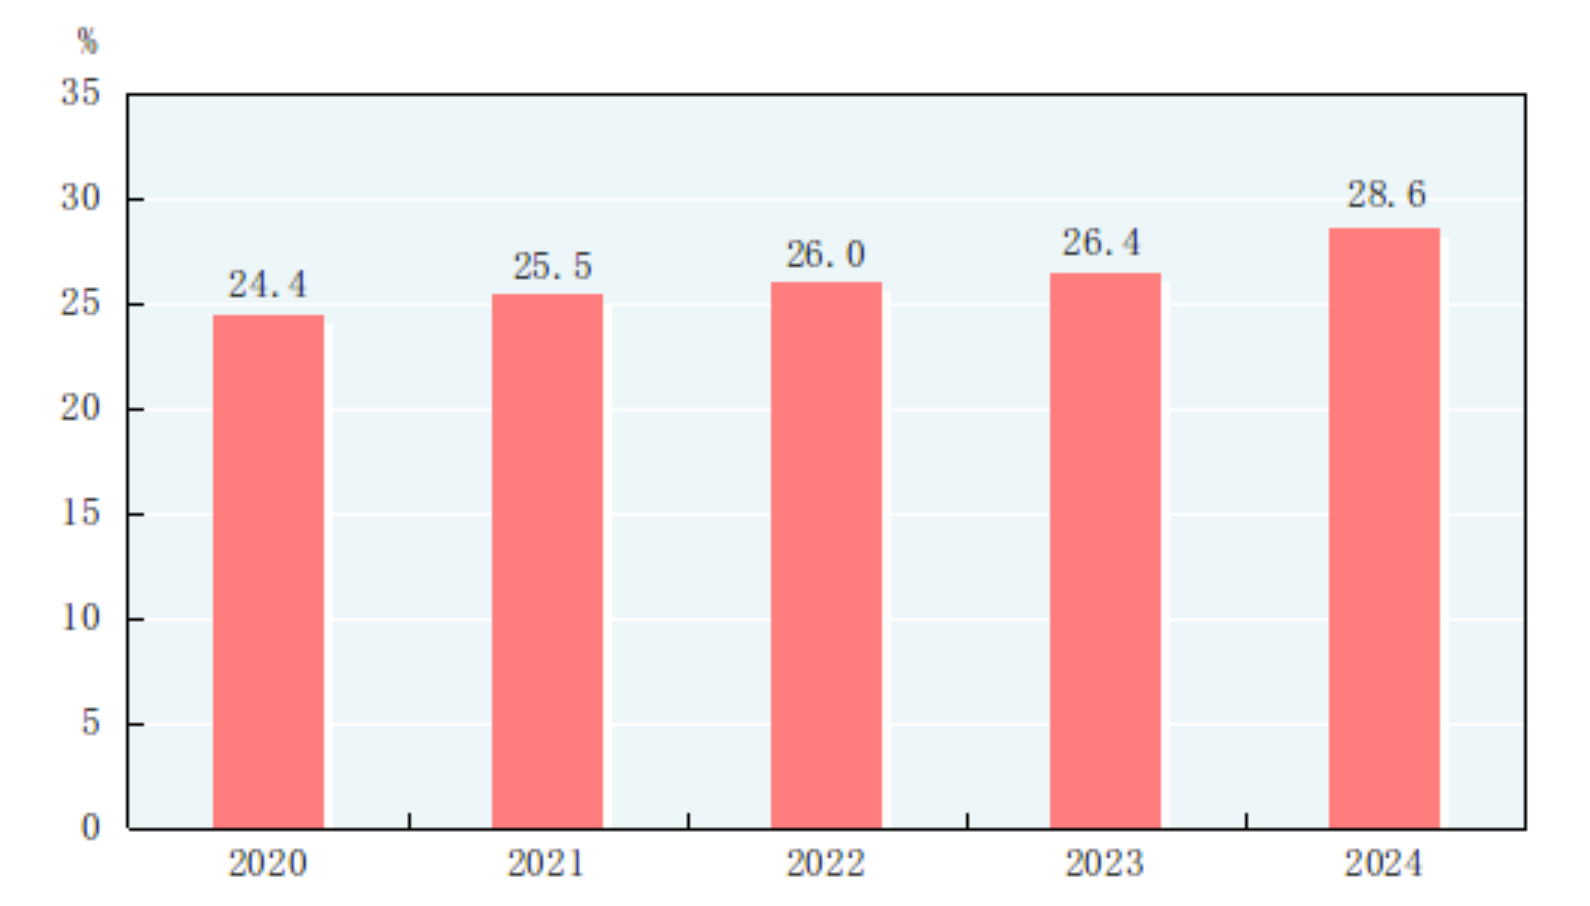
Preliminary estimation indicated that the total energy consumption[87] in 2024 amounted to 5.96 billion tons of standard coal equivalent, up by 4.3 percent over that of 2023. The consumption of coal increased by 1.7 percent; crude oil, down by 1.2 percent; natural gas, up by 7.3 percent; and electric power, up by 6.8 percent. The consumption of coal accounted for 53.2 percent of the total energy consumption, 1.6 percentage points lower than that of 2023, while clean energy consumption, such as natural gas, hydropower, nuclear power, wind power and solar power accounted for 28.6 percent, 2.2 percentage points higher. The comprehensive energy consumption per unit of calcium carbide by major energy-intensive industrial enterprises went down by 0.8 percent, per unit of synthetic ammonia down by 1.2 percent, per ton of steel down by 0.1 percent and per unit of electrolytic aluminium down by 0.2 percent. The standard coal consumption per kilowatt-hour of thermal power generation decreased by 0.2 percent. According to preliminary estimates, the energy consumption per 10,000 yuan worth of GDP[88] decreased by 3.8 percent over that of the previous year after deducting the consumption of raw materials and non-fossil energy. The trade volume of carbon emission quotas[89] at the China Carbon Emissions Trading Market reached 189 million tons with a turnover totaling 18.11 billion yuan.
Figure 24: Proportion of Clean Energy Consumption in the Total Energy Consumption 2020-2024
The area of offshore oceanic water[90] that met the national quality standard Grade I and II accounted for 83.7 percent; that met Grade III standard 4.1 percent; and that of Grade IV or inferior quality 12.2 percent.
Of the monitored 339 cities at prefecture level and above, the annual average concentration of particulate matter (PM2.5) was 29.3 micrograms per cubic meter, down by 2.7 percent over the previous year.
Of the 326 cities subject to urban regional daytime acoustic environment monitoring, 7.1 percent enjoyed excellent environment, 66.9 percent had good environment, 25.5 percent had average environment, 0.6 percent had relatively poor environment and no city had poor environment in 2024.
The average temperature in 2024 was 10.90℃, up by 0.19℃ compared with that of the previous year. Typhoons hit China 9 times in 2024.
In 2024, natural disasters hit 10.09 million hectares of crops, of which 1.24 million hectares suffered from complete crop failure. Flood, waterlogging and geological disasters caused a direct economic loss of 263.0 billion yuan. Droughts caused a direct economic loss of 8.4 billion yuan. Disasters caused by low temperature, frost and snow made a direct economic loss of 25.6 billion yuan. Oceanic disasters caused a direct economic loss of 10.9 billion yuan. The country recorded 25 earthquakes with magnitude 5.0 and above, and total direct economic losses of 3.8 billion yuan were caused by earthquakes of different magnitudes. The year 2024 witnessed 292 forest fires, with 7 thousand hectares of forests damaged.
The death toll due to work accidents amounted to 19,626 people in 2024, down by 7.6 percent over that of the previous year. Work accidents in industrial, mining and commercial companies caused 1.089 deaths out of every 100 thousand employees, down by 12.5 percent over that of 2023. The death toll for one million tons of coal produced in coal mines was 0.059 people, down by 37.2 percent. The road traffic death toll per 10 thousand vehicles was 1.31 people, down by 5.1 percent.
Data Sources:
In this Communiqué, data of newly increased employed people in urban areas, endowment insurance, unemployment insurance, work injury insurance and skilled workers schools in secondary vocational education are from the Ministry of Human Resources and Social Security; data of foreign exchange reserves and exchange rates are from the State Administration of Foreign Exchange; data of business entities, quality inspection, the formulation and revision of national standards and qualification rate of manufactured products are from the State Administration for Market Regulation; data of environment quality and carbon emission trading are from the Ministry of Ecology and Environment; data of output of aquatic products are from the Ministry of Agriculture and Rural Affairs; data of production of timber, area of afforestation, area of grass planting and improvement and national parks are from the National Forestry and Grassland Administration; data of installed power generation capacity, newly increased alternating current transformer equipment with a capacity of over 220 kilovolts and electricity consumption are from the China Electricity Council; data of volume of freight handled by ports, container shipping of ports, highway transportation, waterway transportation, new and rebuilt highways and new throughput capacity of berths for over 10,000-tonnage ships are from the Ministry of Transport; data of railway transportation are from the National Railway Administration; data of civil aviation and new civil transportation airports are from the Civil Aviation Administration of China; data of pipeline transportation are from China National Petroleum Corporation, China Petrochemical Corporation, China National Offshore Oil Corporation and China Oil & Gas Piping Network Corporation; data of motor vehicles for civilian use and traffic accidents are from the Ministry of Public Security; data of postal service are from the State Post Bureau; data of telecommunication, software revenue, state-level technology business incubators, national mass makerspaces and technology contracts are from the Ministry of Industry and Information Technology; data of internet users and internet coverage are from the China Internet Network Information Center; data of new railways put into operation, extended or new double-track railways put into operation and electrified railways put into operation are from China Railway; data of floor space of second-hand housing online transactions, government-subsidized housing, urban village renovation, renovation of dilapidated housing in urban areas, renovation of old urban residential communities and renovation of housing in rural areas are from the Ministry of Housing and Urban-Rural Development; data of imports and exports of goods are from the General Administration of Customs; data of imports and exports of services, newly established foreign-invested enterprises, actually utilized foreign investment, outbound direct investment, overseas contracted projects and overseas labor contracts are from the Ministry of Commerce; data of finance are from the Ministry of Finance; data of tax cuts, fee deductions and tax refunds are from the State Taxation Administration; data of monetary finance and corporate credit bonds are from the People’s Bank of China; data of funds raised through domestic exchange markets are from China Securities Regulatory Commission; data of the insurance sector are from the National Financial Regulatory Administration; data of medical insurance and maternity insurance are from the National Healthcare and Security Administration; data of urban and rural minimum living allowances, relief and assistance granted to rural residents living in extreme poverty, temporary assistance and social welfare are from the Ministry of Civil Affairs; data of entitled people are from the Ministry of Veterans Affairs; data of natural science foundation projects are from the National Natural Science Foundation; data of national engineering research centers and enterprise technology centers recognized by the National Development and Reform Commission are from the National Development and Reform Commission; data of National Guiding Fund for Transformation of Scientific and Technological Achievements are from the Ministry of Science and Technology; data of patents and trademarks are from the National Intellectual Property Administration; data of the proportion of citizens with scientific literacy are from the China Association for Science and Technology; data of satellite launches are from the State Administration of Science, Technology and Industry for National Defense; data of education are from the Ministry of Education; data of art-performing groups, public libraries, cultural centers and tourism are from the Ministry of Culture and Tourism; data of television and radio programs are from the National Radio and Television Administration; data of movies are from the China Film Administration; data of newspapers, magazines and books are from the National Press and Publication Administration; data of files are from the State Archives Administration; data of inbound trips made by foreigners to China under the visa-free policies, China’s outbound visits are from the National Immigration Administration; data of medical care and health are from the National Health Commission; data of sports are from the General Administration of Sport; data of physically-challenged athletes are from the China Disabled Persons’ Federation; data of supply of state-owned land for construction use and direct economic loss caused by oceanic disasters are from the Ministry of Natural Resources; data of stock of water resources, water consumption and newly treated land of soil erosion are from the Ministry of Water Resources; data of average temperature and typhoons are from the China Meteorological Administration; data of areas of crops hit by natural disasters, direct economic loss caused by flood, waterlogging and geological disasters, direct economic loss caused by droughts, direct economic loss caused by low temperature, frost and snow, the number of earthquakes, direct economic losses caused by earthquakes of different magnitudes, forest fires, areas of forests damaged and workplace accidents are from the Ministry of Emergency Management; all the other data are from the National Bureau of Statistics.
In case of any differences between English translation and the original Chinese text, the Chinese edition shall prevail.
Notes:
[1] All figures in this Communiqué are preliminary statistics. Statistics in this Communiqué do not include Hong Kong SAR, Macao SAR and Taiwan Province. Due to the rounding-off reasons, the subentries may not add up to the aggregate totals.
[2] Gross domestic product (GDP), value added of the three and related industries, regional GDP, per capita GDP and gross national income (GNI) as quoted in this Communiqué are calculated at current prices whereas their growth rates are at constant prices. According to the results of the Fifth National Economic Census, and in light of the synchronous reform on the accounting methods of owner-occupied dwellings services for urban residents, historical data of GDP, value added of the three and related industries and overall labor productivity (including Figure 1, Figure 2, Figure 3, Figure 9, Figure 10 and Figure 11) were revised.
[3] Gross national income, also known as gross national product, refers to the total primary distribution of the income created by all the resident units of a country (or a region) during a certain period of time. It equals to gross domestic product plus the net primary distribution of income from abroad.
[4] The overall labor productivity refers to the ratio between the GDP (at 2020 constant prices) and the total number of persons employed.
[5] The national population refers to the population of the 31 provinces, autonomous regions and municipalities directly under the central government and servicemen of the Chinese mainland, excluding residents of Hong Kong, Macao and Taiwan and foreigners living in the 31 provinces, autonomous regions and municipalities directly under the central government.
[6] By the end of 2024, the population aged 0 to 14 (under the age of 15) was 222.40 million and that aged 15 to 59 (under the age of 60) was 875.57 million.
[7] The number of newly increased employed people in urban areas equals the number of cumulative new employment minus the number of natural attrition in urban areas during the reporting period.
[8] The number of migrant workers includes those who are employed outside their villages and towns for more than six months in the year and those who are engaged in non-agricultural work in their villages and towns for more than six months in the year.
[9] The producer prices for farm products refer to the actual unit prices of farm products sold firsthand by producers.
[10] The prices for housing include prices for rent, maintenance and management, water, electricity and fuel, and services of owner-occupied dwellings etc.
[11] The growth rates and rate changes of relevant indicators of the industries above the designated size in 2024 were calculated on a comparable basis due to adjustments of survey coverage in the statistical survey programs, statistical law enforcement and removal of duplicated data.
[12] Manufacture of equipment includes manufacture of metal products, general purpose equipment, special purpose equipment, automobiles, railway, ship, aerospace and other transport equipment, electrical machinery and apparatus, computers, communication and other electric equipment and measuring instrument and machinery.
[13] High technology manufacturing industry includes manufacture of medicine, manufacture of aerospace vehicle and equipment, manufacture of electronic and communication equipment, manufacture of computers and office equipment, manufacture of medical equipment, manufacture of measuring instrument and equipment and manufacture of optical and photographic equipment.
[14] Service enterprises above the designated size refer to legal entities of transport, storage and post, information transmission, software and information technology services, water conservancy, environment and public facilities management, and health with annual business revenue of 20 million yuan and above; legal entities of real estate (excluding real estate development and operation), leasing and business services, scientific research and technical services and education with annual business revenue of 10 million yuan and above; and legal entities of household services, repair and other services, culture, sports and entertainment, and social services with annual business revenue of 5 million yuan and above. The growth rates of financial indicators of service enterprises above the designated size in 2024 were calculated on a comparable basis.
[15] Strategic emerging service industries refer to the related service sectors of information technology of new generation, manufacture of high-end equipment, new materials, biotech, new energy vehicles, new energy, energy-saving and environmental protection and digital creative industries, and service industries related to new technology, innovation and entrepreneurship.
[16] Investment in high technology industries refers to investment in six high technology manufacturing industries, including the manufacture of medicine and manufacture of aerospace vehicle and equipment, and nine high technology service industries, including information service and e-commerce service.
[17] Investment in technology transformation of manufacturing refers to the investment by manufacturing enterprises in transformation of existing facilities, techniques and production services by adopting new technologies, techniques, devices and materials.
[18] E-commerce transactions refer to the transactions of goods and services realized through e-commerce trading platforms (including self-built and third-party platforms), including transactions with entities and individuals. The historical data of e-commerce transactions were revised in accordance with the results of the Fifth National Economic Census. The growth rate of 2024 was calculated on a comparable basis.
[19] Online retail sales refer to the retail sales of goods and services realized through internet trading platforms (online platforms mainly in trading physical goods, including self-built websites and third-party platforms). The data of online retail sales and online retail sales of physical goods were revised in accordance with the results of the Fifth National Economic Census. The growth rate of 2024 was calculated on a comparable basis.
[20] The eastern region includes 10 provinces and municipalities: Beijing, Tianjin, Hebei, Shanghai, Jiangsu, Zhejiang, Fujian, Shandong, Guangdong and Hainan; the central region covers 6 provinces: Shanxi, Anhui, Jiangxi, Henan, Hubei and Hunan; the western region includes 12 provinces, autonomous regions and municipalities: Inner Mongolia, Guangxi, Chongqing, Sichuan, Guizhou, Yunnan, Xizang, Shaanxi, Gansu, Qinghai, Ningxia and Xinjiang; the northeastern region includes 3 provinces: Liaoning, Jilin and Heilongjiang.
[21] The carbon dioxide emissions per 10,000 yuan worth of GDP was calculated at 2020 constant prices.
[22] See Note 11.
[23] The data included the steel reprocessed among enterprises.
[24] Capacity utilization rate refers to the ratio of the actual production to the production capacity (in terms of value). Actual production refers to the total industrial output value during the enterprise’s reporting period. Production capacity refers to the production which can be realized and sustained for a long term under the condition of the supply of labor force, raw materials, fuel and transportation guaranteed and the production equipment in proper operation during the reporting period.
[25] According to Statistical Rules on Energy Consumption of Coal Enterprises (GB/T 28398-2023), solid waste generated during coal washing and processing is not included in coal consumption and comprehensive energy consumption. On this basis, adjustments were made in statistical coverage of the total primary energy output, total energy consumption and coal consumption. The growth rates of 2024 were calculated on a comparable basis.
[26] Thermal power refers to electricity generated by coal, oil, gas, residual heat, pressure and gas, waste incineration and biomass.
[27] A few installed power generation capacity (e.g. geothermal) is not listed.
[28] The total freight traffic and flows include the traffic and flows by railways, highways, waterways, civil aviation and pipelines. The growth rates in 2024 were calculated on a comparable basis.
[29] Since January 2024, the statistical coverage of highway passenger traffic and highway passenger flows has been adjusted with highway passenger traffic incorporating that of shuttle bus and chartered bus services, intercity and urban-rural bus services, and intercity and urban-rural taxi services (including cruising taxi and ride-hailing services), and highway passenger flows making corresponding adjustment. The growth rates of total passenger traffic, passenger flows, highway passenger traffic and highway passenger flows in 2024 were calculated on a comparable basis.
[30] The volume of postal and delivery services refers to the total volume of universal postal services and express delivery services provided by enterprises.
[31] The turnover of telecommunication services was calculated based on the prices of the previous year.
[32] The number of mobile phone base stations refers to the total number of wireless transceivers serving communities that handle the wireless communication between the base stations and mobile stations, relay between the mobile switchboards and mobile stations, and monitor the quality of wireless transmission at the end of the reporting period.
[33] Fixed broadband internet users refer to those who subscribe to the telecommunication enterprises and access the Internet through xDSL, FTTx+LAN, FTTH/O and other broadband access ways as well as general dedicated lines at the end of the reporting period.
[34] Users of broadband with the speed of 1000M and above refer to those who enjoy a downstream rate of 1000Mbit/s or above at the end of the reporting period.
[35] Users of mobile internet of things terminals refer to those who access the mobile internet and subscribe to the internet of things services at the end of the reporting period. Internet of things terminals refers to the internet of things devices that connect the sensing network layer and the transmission network layer to implement remote data collection and data transmission to the network layer.
[36] Software and information technology services industry includes software development, integrated circuit design, information system integration and internet of things technology services, operation maintenance services, information processing and storage support services, IT consulting services, digital content services and other IT services industry. The growth rate of software revenue of software and information technology services industry in 2024 was calculated on a comparable basis.
[37] The statistical coverage of express delivery was adjusted in 2024 and the growth rate was calculated on a comparable basis.
[38] The data of the total retail sales of consumer goods were revised in accordance with the results of the Fifth National Economic Census.
[39] The retail sales of services refer to the total value of services directly provided by enterprises (establishments, self-employed units) to individuals and other units for non-production and non-operating purposes in the form of transactions. It aims to reflect the value of services with the nature of consumption sold by service providers in monetary terms, including the retail sales of services in transportation, accommodation, catering, education, health, sports, entertainment and other fields.
[40] See Note 19.
[41] Due to the methodology reform of investment statistics, the revision of data based on the results of the Fifth National Economic Census, the statistical law enforcement and other factors, the growth rates of relevant indicators of investment in fixed assets in 2024 were calculated on a comparable basis.
[42] See Note 20.
[43] Investment in infrastructure includes investment in railway transportation, highway transportation, waterway transportation, civil aviation transportation, pipeline transportation, multi-modal transportation and forwarding agency, loading, unloading and delivery, postal service, telecommunication, radio, TV and satellite transmission, internet and related services, management of water conservancy, ecological conservation and environmental governance, and management of public facilities.
[44] Investment in social sector includes investment in education, health and social services, culture, sports and entertainment.
[45] Private investment refers to investment in the construction or purchase of fixed assets in the country by domestic collective, private and individual-owned survey units or their holding units (including absolute holding and relative holding).
[46] The investment in real estate includes the investment in real estate development, construction of buildings for own use, property management, intermediary services and other real estate investment.
[47] The historical data of indicators such as real estate development and sales of newly-built commercial buildings were revised in accordance with the results of the Fifth National Economic Census. The growth rates of 2024 were calculated on a comparable basis.
[48] The floor space of newly-built commercial buildings sold refers to the total contract floor space of newly-built commercial buildings sold by real estate development enterprises within the reporting period.
[49] The floor space of second-hand housing online transactions refers to the total contract floor space of second-hand housing online transactions in urban areas within the reporting period.
[50] The Belt and Road refers to the Silk Road Economic Belt and the 21st Century Maritime Silk Road.
[51] Other Regional Comprehensive Economic Partnership (RCEP) member countries include Indonesia, Malaysia, Philippines, Thailand, Singapore, Brunei, Cambodia, Laos, Myanmar, Vietnam, Japan, Republic of Korea, Australia and New Zealand.
[52] The AFRE (flow) refers to the total volume of financing provided by the financial system to the real economy within a certain period of time.
[53] The AFRE (stock) refers to the outstanding financing provided by the financial system to the real economy at the end of a period of time (a month, a quarter or a year).
[54] Inclusive loans to micro and small businesses include loans to micro and small businesses with single-client credit line under 10 million yuan, operating loans to self-employed businesses and owners of micro and small businesses.
[55] From June 2024, the statistical coverage of rural areas has been adjusted with the urban areas of a county being removed from rural areas. Figures of loans to agriculture, rural areas and rural residents are comparable figures.
[56] Funds raised through Shanghai and Shenzhen Stock Exchanges are calculated by the money raised on the listing date, and the funds raised include the actual exchanged convertible bonds, which were 83.2 billion yuan in 2023 and 169.4 billion yuan in 2024.
[57] Funds raised through Beijing Stock Exchanges are calculated by the money raised on the listing date.
[58] Preferred shares were excluded from the funds raised by listed companies in the National Equities Exchange and Quotations. Funds raised by shares are calculated by the disclosure date of the issuance report.
[59] Corporate credit bonds include debt financing instruments issued by non-financial businesses, enterprise bonds, corporate bonds and convertible bonds.
[60] The premium of primary insurance received by the insurance companies refers to the premium income from primary insurance contracts confirmed by the insurance companies.
[61] The median of per capita disposable income refers to the per capita income of household lied in the middle of all surveyed households which are ranked from low to high based on per capita disposable income level.
[62] The income quintile refers to the five equal partitions of all surveyed households, who are ranked from low to high based on per capita income level. The bottom 20 percent with the lowest income are classified as low-income group, and the other four levels are lower-middle-income group, middle-income group, upper-middle-income group and high-income group.
[63] Counties lifted out of poverty include 832 key counties under the national poverty alleviation and development program and counties in contiguous poor areas as well as 7 cities and counties in Aksu prefecture, Xinjiang.
[64] The consumption expenditure on services refers to the spending by households on services for daily lives including catering, clothing and footwear processing, housing, family, transportation and communication, education, culture and recreation, medical services and others.
[65] Rural residents living in extreme poverty refer to the aged, the disabled and the minor under 16 years of age in rural areas who have no ability to work, no sources of income and no statutory obligors to provide for them, bring them up or support them, or whose statutory obligors have no ability to fulfill their obligations.
[66] Temporary assistance refers to emergent and transitional assistance provided by the government to families or individuals who experience hardships because of emergencies, unexpected harm, major diseases or other unusual factors and are not covered by other forms of social assistance programs or still suffer hardships after receiving other social assistance programs.
[67] The beds provided by social welfare institutions include beds provided by adoption agencies, aid agencies and community agencies.
[68] The state-level technology business incubators are technology-based business start-up service providers consistent with the Administrative Measures for Technology Business Incubators that provide physical space, shared facilities and professional services with the mission of advancing transformation of technological achievements, cultivating technological enterprises and fostering the entrepreneurial spirit. They should be approved and accredited by the Ministry of Science and Technology.
[69] The national mass makerspaces are new service platform for entrepreneurship and innovation that are in conformity with the Guidelines on Developing Mass Makerspaces and are reviewed and registered by the Ministry of Science and Technology in accordance with the Provisional Registration Regulations on National Mass Makerspaces.
[70] The number of PCT patent applications accepted refers to the number of PCT patent application accepted by the State Intellectual Property Office which acts as the receiving office of PCT patent application. PCT is the abbreviation of Patent Cooperation Treaty, which is a treaty for international cooperation in the field of patents.
[71] The number of high-value invention patents per 10,000 people refers to the number of valid invention patents owned per 10,000 national residents which are authorized by the China National Intellectual Property Administration and satisfy any of the following conditions: invention patents for strategic emerging industries; invention patents having corresponding foreign patents; invention patents maintained more than 10 years; invention patents with a relatively high pledge financing amount; and invention patents that won the National Science and Technology Award and the China Patent Award.
[72] Citizens with scientific literacy refer to citizens carrying out scientific spirit, spreading scientific philosophy, mastering basic scientific methods and scientific knowledge, and able to apply them to analysis and problem solving. The proportion of citizens with scientific literacy was obtained from the sample survey for citizens aged from 18 to 69.
[73] The qualification rate of manufactured products is the ratio of the samples that have passed the sampling quality test, the process of which follows certain methods, procedure and standard, to the total amount of the sampled products. The survey samples cover 29 sectors of the manufacturing industry.
[74] Regular and vocational higher education institutes include regular universities, vocational undergraduate education and higher vocational colleges.
[75] Secondary vocational education includes regular specialized secondary schools, adult specialized secondary schools, vocational high schools and skilled workers schools.
[76] The people received by the public libraries refer to the number of people who visit libraries and use library services in the year, including borrowing and reading books, consultation and attending readers’ programs.
[77] Special movies refer to those using different display modes in terms of projection techniques, equipment and program as compared with the ordinary cinemas, such as IMAX movies, 3D movies, 4D movies, multidimensional movies and full dome movies.
[78] The average number of books possessed per person refers to the average number of books published in the year that can be possessed per person in China.
[79] The total number of medical visits refers to the number of people receiving medical services, including outpatient services, emergency treatment, home visits, appointment-based diagnosis and treatment, health check-up of a specific item, and health consultation and guidance (excluding health lectures and nucleic acid tests).
[80] The number of hospital discharges refers to the number of inpatients discharged from hospitals in the reporting period, including those who are discharged from hospitals or transferred to other medical institutions following doctors’ advice, discharged from hospitals without doctors’ permission, dead or other situations. The number of people who are recovered from family sickbeds is excluded.
[81] The sports venues belonging to armed forces and railway system are excluded in the census on sports venues.
[82] The sports venue area refers to area used for physical training, sports competitions and physical fitness.
[83] Total supply of state-owned land for construction use refers to the total amount of state-owned land for construction use with the land-use right transferred, allocated or leased to units or individuals through signed transaction contracts and allocation decisions by the municipal or county governments according to annual land supply plan and in line with relevant laws in the reporting period.
[84] Land used for real estate refers to the sum of land used for commercial service and for residence.
[85 The water consumption per 10,000 yuan of GDP and water consumption per 10,000 yuan of industrial value added are calculated at prices of 2020.
[86] The land area improved by grass plantation refers to the area of grasslands that are ecologically restored through manual grass plantation, aerial grass seeding, the quality improvement of grasslands and fencing enclosure.
[87] See Note 25.
[88] The energy consumption per 10,000 yuan worth of GDP is calculated at prices of 2020.
[89] The carbon emission quotas at the China Carbon Emissions Trading Market refers to the emission quotas of greenhouse gases such as carbon dioxide allocated to major emission entities for the prescribed period at the China Carbon Emissions Trading Market. One unit of carbon emission quota is equivalent to one ton of carbon dioxide equivalent emitted into the atmosphere.
[90] Offshore oceanic water quality is evaluated by the area method.