Consumer Price Index for January 2024
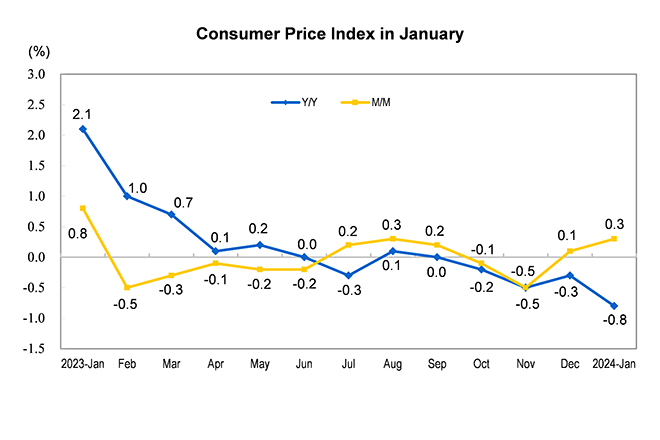
In January 2024, China saw sustainable growth in domestic consumer demand driven by the holiday effect. The national consumer price index (CPI) increased by 0.3 percent month on month in January, rising for two consecutive months, an increase of 0.2 percentage point higher than that in December 2023. Among them, the price in urban areas increased by 0.3 percent and the price in rural areas increased by 0.2 percent; the price for food increased by 0.4 percent, while for nonfood increased by 0.2 percent; prices for consumer goods increased by 0.2 percent and for services increased by 0.4 percent.
In January, the national CPI went down by 0.8 percent year on year due to the high base of the Chinese New Year “different-month effect” in the same period of the previous year. Among them, the price in urban areas decreased by 0.8 percent and the price in rural areas decreased by 0.8 percent; the price for food decreased by 5.9 percent, while for nonfood increased by 0.4 percent; prices for consumer goods decreased by 1.7 percent and for services increased by 0.5 percent. Of the year-on-year decrease of 0.8 percent in the CPI in January, the carryover effect sent the CPI down by 1.1 percentage points, while new price increases edged the growth up by 0.3 percentage point.
I. Month-on-Month Changes of Prices for Different Categories
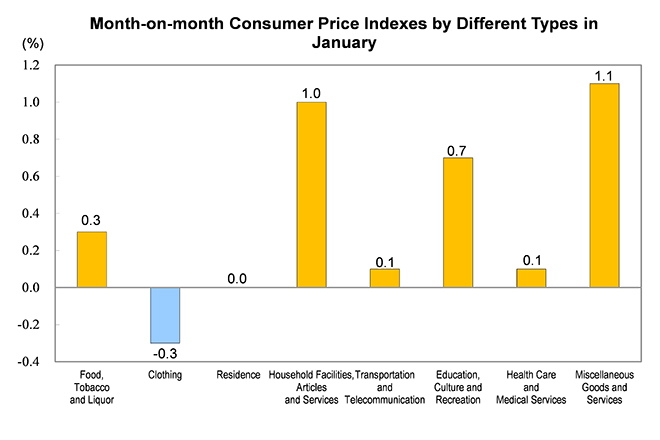
In January, prices for food, tobacco and liquor increased by 0.3 percent month on month, affecting the CPI increased by about 0.09 percentage point. Among food categories, the cold weather and the increase in consumer demand as the Spring Festival approached caused prices for fresh vegetables to rise by 3.8 percent, dragging up the CPI by about 0.08 percentage point; prices for aquatic products increased by 2.6 percent, affecting the CPI increased by about 0.05 percentage point. All regions in China worked to increase the supply of commodities related to people's livelihood, with prices for eggs decreased by 1.5 percent, affecting the CPI decreased by about 0.01 percentage point; prices for fresh fruits decreased by 0.5 percent, affecting the CPI decreased by about 0.01 percentage point; the price for meat of livestock decreased by 0.5 percent, affecting the CPI decreased by about 0.01 percentage point;
Prices for other seven major categories increased five, leveled one and decreased one month on month. Among them, prices for miscellaneous goods and services, household facilities, articles and services, and education, culture and recreation increased by 1.1, 1.0 and 0.7 percent respectively; prices for both transportation and telecommunication, and health care and medical services increased by 0.1 percent; the price for residence maintained the same; the price for clothing decreased by 0.3 percent.
II. Year-on-Year Changes of Prices for Different Categories
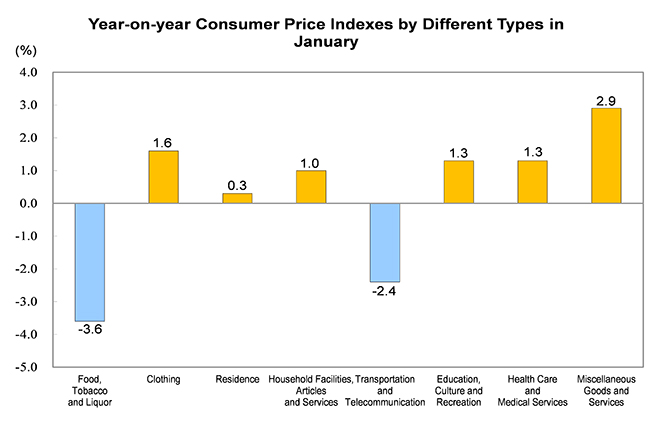
In January, prices for food, tobacco and liquor decreased by 3.6 percent year on year, affecting the CPI decreased by about 1.04 percentage points. Among food categories, prices for fresh vegetables decreased by 12.7 percent due to the high comparison base in the same period last year, affecting the CPI decreased by about 0.32 percentage point; the price for meat of livestock decreased by 11.6 percent, affecting the CPI decreased by about 0.39 percentage point, of which the price for pork decreased by 17.3 percent, affecting the CPI decreased by about 0.25 percentage point; prices for fresh fruits decreased by 9.1 percent, affecting the CPI decreased by about 0.21 percentage point; prices for eggs decreased by 6.4 percent, affecting the CPI decreased by about 0.05 percentage point; prices for aquatic products decreased by 3.4 percent, affecting the CPI decreased by about 0.07 percentage point;
Prices for the other seven major categories increased six and decreased one year on year. Among them, prices for miscellaneous goods and services, and clothing increased by 2.9 and 1.6 percent respectively; prices for both education, culture and recreation, and health care and medical services increased by 1.3 percent; prices for household facilities, articles and services, and residence increased by 1.0 and 0.3 percent respectively; the price for transportation and telecommunication decreased by 2.4 percent.
Consumer Price Index in January 2024
Annotations:
1. Explanatory Notes
The consumer price index (CPI) is a relative number that measures changes in the price level of consumer goods and services over time, and comprehensively reflects changes in the price levels of consumer goods and services purchased by residents.
2. Statistical Coverage
The consumer price index (CPI) covers the prices of goods and services of 8 categories and 268 basic divisions which cover the living consumption of urban and rural residents, including food, tobacco and liquor; clothing; residence; household facilities, articles and services; transportation and telecommunication; education, culture and recreation; health care and medical services; miscellaneous goods and services.
3. Survey Methods
Sampling survey methodology is adopted to select and determine survey sites, and according to the principle of "fixed person, fixed point and fixed time", statisticians are directly sent to the survey sites or collect the original price from the Internet. The data comes from about 500 cities and counties in 31 provinces (autonomous regions and municipalities) and nearly 100,000 price survey sites, including shopping malls (stores), supermarkets, farmers' markets, service outlets and internet e-commerce.
4. Data Description
Due to rounding-off, the aggregate data may be equal to the high or low value of the classified data.