Total Retail Sales of Consumer Goods in December 2023
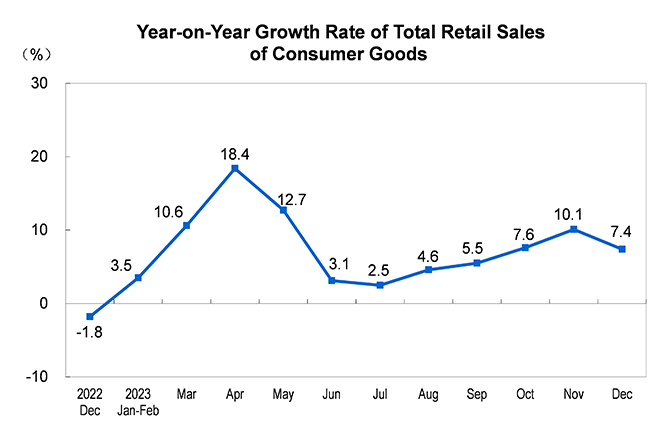
In December, the total retail sales of consumer goods reached 4,355.0 billion yuan, up by 7.4 percent year on year, of which the retail sales of consumer goods other than automobiles reached 3,813.1 billion yuan, up by 7.9 percent.
In 2023, the total retail sales of consumer goods were 47,149.5 billion yuan, up by 7.2 percent year on year, of which the retail sales of consumer goods other than automobiles reached 42,288.1 billion yuan, up by 7.3 percent.
According to the location of business units, the retail sales of consumer goods in urban areas in December were 3,707.1 billion yuan, up by 7.2 percent year on year; the retail sales of consumer goods in rural areas reached 647.9 billion yuan, up by 8.9 percent. In 2023, the retail sales of consumer goods in urban areas reached 40,749.0 billion yuan, up by 7.1 percent over the previous year; the retail sales of consumer goods in rural areas reached 6,400.5 billion yuan, up by 8.0 percent.
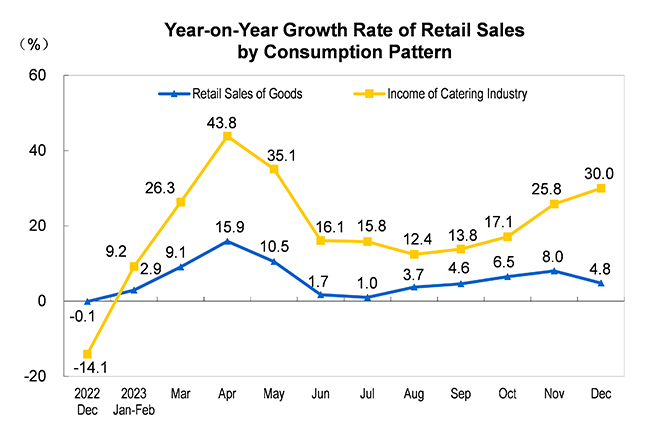
According to consumption patterns, in December, the retail sales of goods reached 3,814.5 billion yuan, up by 4.8 percent year on year; the income of catering industry was 540.5 billion yuan, up by 30.0 percent. In 2023, the retail sales of goods reached 41,860.5 billion yuan, up by 5.8 percent over the previous year; the income of catering industry was 5,289.0 billion yuan, up by 20.4 percent.
According to the retail formats, in 2023, the retail sales of department store, convenience store, specialty store and brand store in retail enterprises above the designated size increased by 8.8, 7.5, 4.9 and 4.5 percent respectively over the previous year, and the retail sales of supermarket decreased by 0.4 percent over the previous year.
In 2023, the online retail sales nationwide reached 15,426.4 billion yuan, up by 11.0 percent over the previous year, of which the online retail sales of physical goods reached 13,017.4 billion yuan, up by 8.4 percent, accounting for 27.6 percent of the total retail sales of consumer goods; among the online retail sales of physical goods, food, clothing and consumer goods increased by 11.2, 10.8 and 7.1 percent respectively.
Total Retail Sales of Consumer Goods in December 2023
|
Item |
December |
Jan-Dec |
||
|
Absolute Value (100 million yuan) |
Y/Y (%) |
Absolute Value (100 million yuan) |
Y/Y (%) |
|
|
Total retail sales of consumer goods |
43550 |
7.4 |
471495 |
7.2 |
|
Of which: Retail sales of the enterprises (units) excluding automobiles |
38131 |
7.9 |
422881 |
7.3 |
|
Of which: Retail sales of the enterprises (units) above the designated size |
17885 |
6.6 |
178563 |
6.5 |
|
Of which: Online retail sales of physical goods |
- |
- |
130174 |
8.4 |
|
Grouped by different areas |
||||
|
Urban |
37071 |
7.2 |
407490 |
7.1 |
|
Rural |
6479 |
8.9 |
64005 |
8.0 |
|
Grouped by consumption patterns |
||||
|
Income of catering industry |
5405 |
30.0 |
52890 |
20.4 |
|
Of which: Income of catering industry by enterprises (units) above the designated size |
1252 |
37.7 |
13356 |
20.9 |
|
Retail sales of goods |
38145 |
4.8 |
418605 |
5.8 |
|
Of which: Income of retail sales of goods by enterprises (units) above the designated size |
16633 |
4.8 |
165207 |
5.5 |
|
Grain, oil and food |
1906 |
5.8 |
18887 |
5.2 |
|
Beverage |
276 |
7.7 |
2991 |
3.2 |
|
Tobacco and liquor |
543 |
8.3 |
5507 |
10.6 |
|
Clothes, shoes, hats and textiles |
1576 |
26.0 |
14095 |
12.9 |
|
Cosmetics |
323 |
9.7 |
4142 |
5.1 |
|
Gold, silver and jewelry |
304 |
29.4 |
3310 |
13.3 |
|
Articles for daily use |
670 |
-5.9 |
7576 |
2.7 |
|
Sports & recreational articles |
109 |
16.7 |
1186 |
11.2 |
|
Household appliances and audio-video equipment |
772 |
-0.1 |
8719 |
0.5 |
|
Traditional Chinese and western medicines |
682 |
-18.0 |
6710 |
5.1 |
|
Cultural and office appliances |
393 |
-9.0 |
4126 |
-6.1 |
|
Furniture |
165 |
2.3 |
1516 |
2.8 |
|
Telecommunication equipment |
628 |
11.0 |
6814 |
7.0 |
|
Petroleum and petroleum products |
2034 |
8.6 |
23219 |
6.6 |
|
Motor vehicles |
5420 |
4.0 |
48614 |
5.9 |
|
Building and decoration materials |
170 |
-7.5 |
1569 |
-7.8 |
|
Notes: 1. The data in this table is the nominal growth rate without deducting the price factor. 2. Some of the data in this table may not be equal to the total due to rounding off. |
||||
Annotations:
1. Explanatory Notes
Total Retail Sales of Consumer Goods: refers to the amount of physical goods sold by enterprises (units and individual households) to individuals and social groups for non-production and non-business purposes through transactions, as well as the amount of income obtained from providing catering services.
Online Retail Sales: refers to the sales of goods and services got through public online trading platform (including self-built websites and third-party platform). Goods and services include physical goods and non-physical goods (such as virtual product, services).
The total retail sales of consumer goods include online retail sales of physical goods, excludes online retail sales of non-physical goods.
2. Statistical Coverage
Legal person enterprises, industrial activity units and self-employed households engaged in goods retail activities or providing catering services. Among them, units above the designated size refer to wholesale enterprises (units and individuals) with annual main business income of 20 million yuan and above, retail enterprises (units and individuals) with annual main business income of 5 million yuan and above, and hotels and catering enterprises (units and individuals) with annual main business income of 2 million yuan and above.
As the range of wholesale and retail enterprises, accommodation and catering enterprises (units and individual households) above the designated size changes every year, in order to ensure that the data of this year are comparable with the previous year, the same period number used to calculate the year-on-year growth rate of various indicators such as retail sales of consumer goods of units above the designated size is consistent with the statistical range of enterprises (units and individual households) in this period, and there is a different data access standard between the data published in this year and the previous year. The main reason is that every year, some enterprises (units and individuals) meet the quota standards and are included in the investigation scope. At the same time, some enterprises (units and individuals) withdraw from the investigation scope due to their small scale and fail to meet the quota standards. And there are also the impacts of enterprises (units and individuals) that are newly opened, bankrupt, and revoked or cancelled.
3. Survey Methods
All enterprises above the designated size are surveyed, while the data of enterprises below the designated size are collected by sampling survey.
4. Month-on-Month Figure Revision
According to the auto-revision function of the seasonal adjustment model, the month-on-month growth rate of the total retail sales of consumer goods since December 2022 was revised. The revised results and the month-on-month data of December 2023 are as follows:
|
Months |
Growth Rate (%) |
|
2022-December |
-0.15 |
|
2023-January |
0.72 |
|
February |
2.09 |
|
March |
0.41 |
|
April |
0.91 |
|
May |
0.45 |
|
June |
0.33 |
|
July |
-0.01 |
|
August |
1.30 |
|
September |
0.18 |
|
October |
0.37 |
|
November |
0.09 |
|
December |
0.42 |