Industrial Production Operation in July 2023
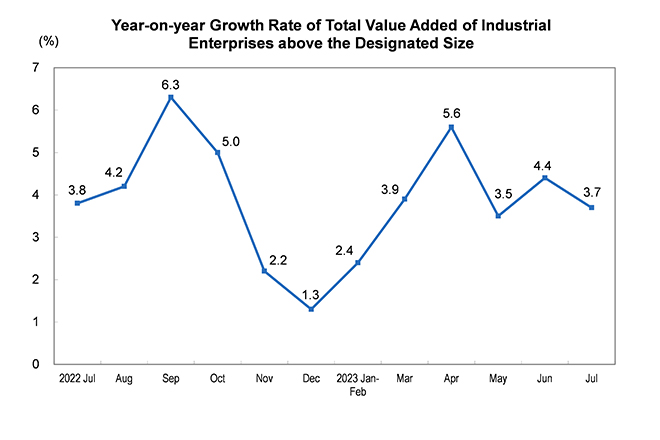
In July, the total value added of industrial enterprises above the designated size increased by 3.7 percent year-on-year (the growth rates of value added are the real growth rates after deducting price factors). From a month-on-month comparison, in July, the total value added of industrial enterprises above the designated size increased by 0.01 percent over the previous month. From January to July, the total value added of industrial enterprises above the designated size increased by 3.8 percent year on year.
In terms of sectors, in July, the value added of the mining industry increased by 1.3 percent year-on-year, that of the manufacturing industry increased by 3.9 percent, and that of the production and supply of electricity, thermal power, gas and water increased by 4.1 percent.
In terms of ownership, in July, the value added of state-holding enterprises increased by 3.4 percent year on year; that of share-holding enterprises increased by 5.0 percent, and that of enterprises funded by foreign investors and investors from Hong Kong, Macao and Taiwan decreased by 1.8 percent; and that of private enterprises increased by 2.5 percent.
From the perspective of industries, in July, the value added of 23 of the 41 major industries kept year-on-year growth. Among them, the value added of the mining and washing of coal went up by 0.4 percent, of the extraction of petroleum and natural gas up by 4.2 percent, of the processing of food from agricultural and sideline products up by 3.0 percent, of the manufacture of wines, beverages and refined tea down by 3.1 percent, of the textile industry down by 0.3 percent, of the manufacture of raw chemical materials and chemical products up by 9.8 percent, of the manufacture of non-metallic mineral products down by 3.4 percent, of the smelting and pressing of ferrous metals up by 15.6 percent, of the smelting and pressing of non-ferrous metals up by 8.9 percent, of the manufacture of general-purpose machinery down by 1.4 percent, of the manufacture of special-purpose machinery up by 1.5 percent, of the manufacture of automobiles up by 6.2 percent, of the manufacture of railway, ship, aerospace and other transport equipment up by 1.0 percent, of the manufacture of electrical machinery and apparatus up by 10.6 percent, of the manufacture of computers, communication equipment and other electronic equipment up by 0.7 percent, and of the production and supply of electricity and thermal power up by 4.6 percent.
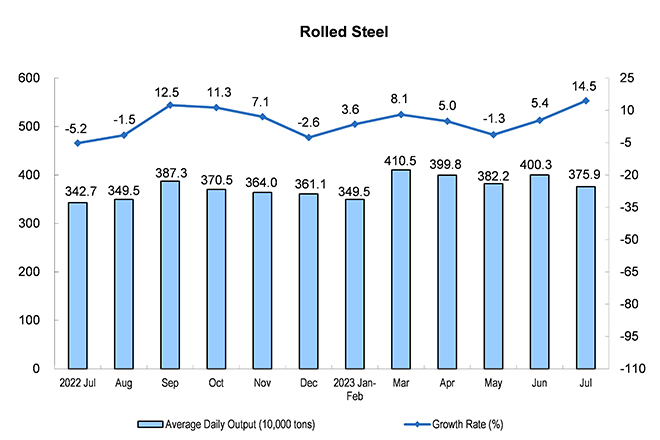
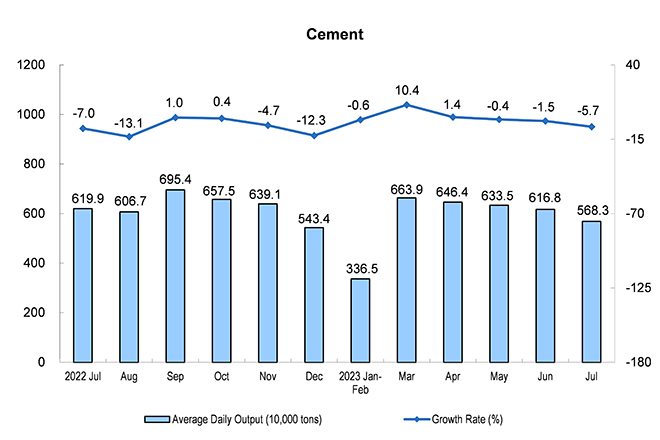
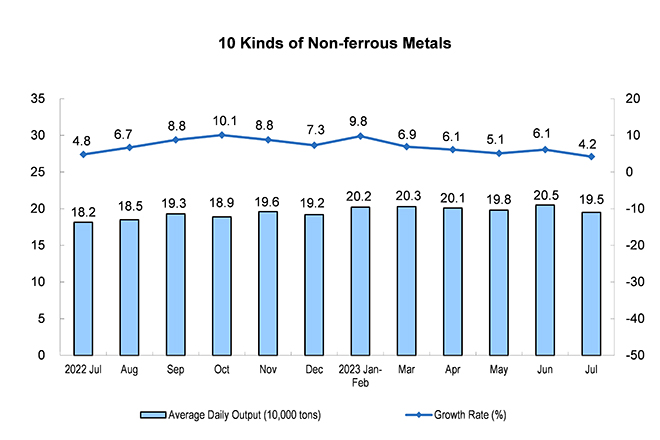
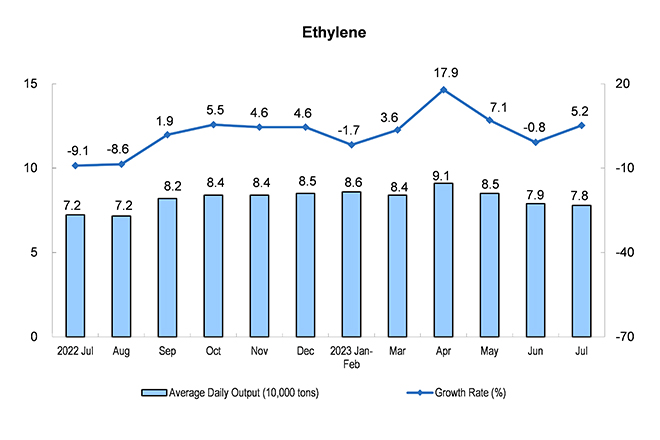
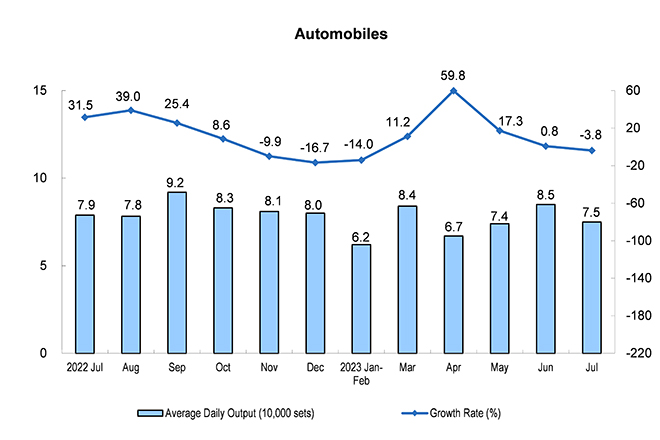
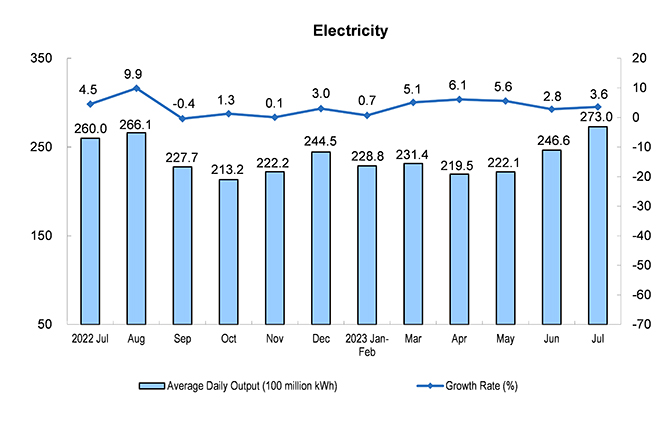
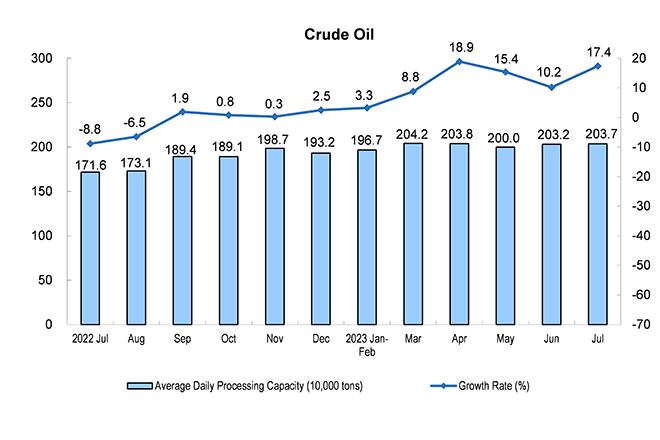
In terms of products, in July, the output of 303 of 620 products increased year on year. The output of rolled steel was 116.53 million tons, up by 14.5 percent year on year; that of cement was 176.18 million tons, down by 5.7 percent; that of ten kinds of non-ferrous metals was 6.03 million tons, up by 4.2 percent; that of ethylene was 2.41 million tons, up by 5.2 percent; that of automobiles was 2.324 million sets, down by 3.8 percent, including 752,000 new energy automobiles, up by 24.9 percent; the power generation was 846.2 billion kWh, up by 3.6 percent; and the crude oil processing capacity was 63.13 million tons, up by 17.4 percent.
In July, the product sales rate of industrial enterprises was 97.8 percent, a year-on-year increase of 0.1 percentage point; and industrial enterprises realized an export delivery value of 1,202.3 billion yuan, a nominal decrease of 6.4 percent year on year.
Industrial Production Operation in July 2023
|
July |
Jan-Jul |
|||
|
Absolute Value |
Growth rate Y/Y (%) |
Absolute Value |
Growth rate Y/Y (%) |
|
|
Value-added of Industries Above the Designated Size |
… |
3.7 |
… |
3.8 |
|
Grouped by three sectors |
||||
|
Mining |
… |
1.3 |
… |
1.7 |
|
Manufacturing |
… |
3.9 |
… |
4.2 |
|
Of which: High technology manufacturing |
… |
0.7 |
… |
1.6 |
|
Production and supply of electricity, thermal power, gas and water |
… |
4.1 |
… |
4.1 |
|
Grouped by ownership |
||||
|
Of which: State-holding enterprises |
… |
3.4 |
… |
4.3 |
|
Of which: Share-holding enterprises |
… |
5.0 |
… |
4.5 |
|
Enterprises funded by foreign investors and investors from Hong Kong, Macao and Taiwan |
… |
-1.8 |
… |
0.4 |
|
Of which: Private enterprises |
… |
2.5 |
… |
2.0 |
|
The Value-Added of the Main Sectors |
||||
|
Mining and washing of coal |
… |
0.4 |
… |
1.5 |
|
Extraction of petroleum and natural gas |
… |
4.2 |
… |
4.0 |
|
Processing of food from agricultural and sideline products |
… |
3.0 |
… |
-0.3 |
|
Manufacture of foods |
… |
0.0 |
… |
2.3 |
|
Manufacture of wines, beverages and refined tea |
… |
-3.1 |
… |
-0.3 |
|
Textile industry |
… |
-0.3 |
… |
-2.1 |
|
Manufacture of raw chemical materials and chemical products |
… |
9.8 |
… |
7.8 |
|
Manufacture of medicine |
… |
-3.5 |
… |
-4.6 |
|
Manufacture of rubber and plastics articles |
… |
3.6 |
… |
1.1 |
|
Manufacture of non-metallic mineral products |
… |
-3.4 |
… |
-0.1 |
|
Smelting and pressing of ferrous metals |
… |
15.6 |
… |
6.7 |
|
Smelting and pressing of non-ferrous metals |
… |
8.9 |
… |
7.6 |
|
Manufacture of metal products |
… |
1.4 |
… |
1.6 |
|
Manufacture of general purpose machinery |
… |
-1.4 |
… |
2.8 |
|
Manufacture of special purpose machinery |
… |
1.5 |
… |
4.9 |
|
Manufacture of automobiles |
… |
6.2 |
… |
12.0 |
|
Manufacture of railway, ship, aerospace and other transport equipment |
… |
1.0 |
… |
6.9 |
|
Manufacture of electrical machinery and apparatus |
… |
10.6 |
… |
15.1 |
|
Manufacture of computers, communication equipment and other electronic equipment |
… |
0.7 |
… |
0.1 |
|
Production and supply of electricity and thermal power |
… |
4.6 |
… |
4.4 |
|
Output of major products |
||||
|
Cloth (100 million meters) |
26 |
-5.9 |
176 |
-5.4 |
|
Sulfuric acid (100%) (10,000 tons) |
765 |
2.1 |
5443 |
0.7 |
|
Caustic soda (100%) (10,000 tons) |
329 |
-0.8 |
2345 |
2.0 |
|
Ethylene (10,000 tons) |
241 |
5.2 |
1783 |
5.3 |
|
Chemical fiber (10,000 tons) |
632 |
17.1 |
3988 |
5.0 |
|
Cement (10,000 tons) |
17618 |
-5.7 |
112677 |
0.6 |
|
Plate glass (10,000 weight boxes) |
8221 |
-5.4 |
55054 |
-8.7 |
|
Pig iron (10,000 tons) |
7760 |
10.2 |
52892 |
3.5 |
|
Crude steel (10,000 tons) |
9080 |
11.5 |
62651 |
2.5 |
|
Rolled steel (10,000 tons) |
11653 |
14.5 |
78900 |
5.4 |
|
10 Kinds of nonferrous metals (10,000 tons) |
603 |
4.2 |
4232 |
7.0 |
|
Of which: Primary aluminium (electrolytic aluminium) (10,000 tons) |
348 |
1.5 |
2362 |
2.8 |
|
Metal-cutting machine tool (10,000 sets) |
5 |
-2.1 |
35 |
-1.7 |
|
Industrial robot (set) |
34274 |
-13.3 |
256260 |
3.8 |
|
Automobile (10,000 sets) |
232.4 |
-3.8 |
1540.8 |
4.5 |
|
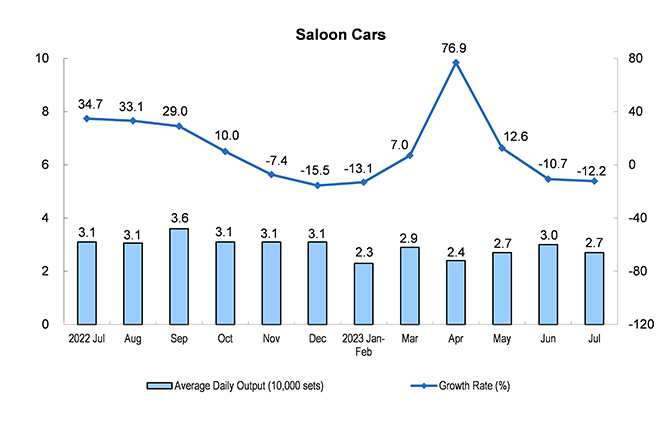
Of which: Saloon cars (10,000 sets) |
82.5 |
-12.2 |
552.1 |
0.8 |
|
SUV (10,000 sets) |
92.5 |
0.5 |
589.2 |
4.1 |
|
Of which: New energy automobiles (10,000 sets) |
75.2 |
24.9 |
435.8 |
33.2 |
|
Generator set (power generation equipment) (10,000 kWh) |
1128 |
15.7 |
10958 |
29.0 |
|
Solar cells (photovoltaic cells) (10,000 kWh) |
4450 |
65.1 |
27661 |
56.3 |
|
Micro computer equipment (10,000 sets) |
2642 |
-22.3 |
18877 |
-24.4 |
|
Mobile telephones (10,000 sets) |
12101 |
5.2 |
81002 |
-1.6 |
|
Of which: Smartphone (10,000 sets) |
8880 |
1.6 |
59251 |
-7.9 |
|
Integrated circuit (100 million pieces) |
292 |
4.1 |
1912 |
-3.9 |
|
Raw coal (10,000 tons) |
37754 |
0.1 |
267182 |
3.6 |
|
Coke (10,000 tons) |
4043 |
3.7 |
28434 |
1.9 |
|
Crude oil (10,000 tons) |
1731 |
1.0 |
12237 |
1.9 |
|
Crude processing capacity (10,000 tons) |
6313 |
17.4 |
42671 |
10.9 |
|
Natural gas (100 million cubic meters) |
184 |
7.6 |
1340 |
5.7 |
|
Electricity (100 million kWh) |
8462 |
3.6 |
50130 |
3.8 |
|
Thermal power (100 million kWh) |
5997 |
7.2 |
35474 |
7.5 |
|
Hydro-electric power (100 million kWh) |
1211 |
-17.5 |
5717 |
-21.8 |
|
Nuclear power (100 million kWh) |
380 |
2.9 |
2499 |
5.9 |
|
Wind power (100 million kWh) |
614 |
25.0 |
4836 |
16.8 |
|
Solar power (100 million kWh) |
259 |
6.4 |
1604 |
7.9 |
|
Sales ratio (%) |
97.8 |
0.1 (percentage point) |
97.5 |
0.5 (percentage point) |
|
Export delivery value (100 million yuan) |
12023 |
-6.4 |
82477 |
-4.9 |
Annotations:
1. Explanation of Indicator
Growth rate of value added of the industrial enterprises: also known as industrial growth rate, which is used to reflect a certain period of increase or decrease in volume of industrial production indicators of the degree of change. The indicator can be used to estimate the short-term trend of the industrial economy, to judge the range of the economic expansion, and also to be an important reference and basis for the formulation and adjustment of economic policies, and for the implementation of macroeconomic adjustment and control.
Sales ratio: refers to ratio of sales value to total industrial output, which reflecting the situation between production and sales of industrial products.
Export delivery value: refers to the value of products exported by industrial enterprises (including those sold to Hong Kong, Macao and Taiwan) or handed over to foreign trade departments for export, and the value of products produced by foreign companies such as samples, materials processing, parts assembly and compensation trade.
Daily product output: the total production of the total value added of the industrial enterprises above the designated size in the current month divided by number of days in the month.
2. Statistical Coverage
The standard starting point of industrial enterprises above the designated size was 20 million yuan of annual revenue from primary business.
Due to the annual changes of the coverage of industrial enterprises above the designated size, and in order to ensure that the data for this year is comparable with that of the previous year, the data of the corresponding period used for calculating the year-on-year growth rates of various indicators such as product output is as consistent with the enterprise statistical coverage of the current period as possible, and there is a difference in caliber from the data published last year. The main reasons are: (1) Coverage changes of statistical units. Each year, some companies will be included in the survey after having reached requisite size, and some will exit the survey due to their smaller size, and there are also influence of new built and starting enterprises, bankruptcies, and companies that have been suspended or sold. (2) There is cross-regional repeated calculation in the output data of some enterprise group (company) products, which has been eliminated according to specific surveys.
3. Survey Methods
The reports of industrial enterprises above the designated size are conducted with complete survey on a monthly basis (excluding the report for January).
4. Standard on industrial classification
The Industrial Classification for National Economic Activities (GB/T4754-2017) was performed.
5. Revision on month-on-month data
The month-on-month growth rate of the total value added of the industrial enterprises above the designated size from July 2022 to June 2023 was revised according to the results of automatic revision of seasonal adjustment model. The revised results and the month-on-month data in July 2023 are as follows:
|
Months |
Growth Rate (%) |
|
2022-July |
0.35 |
|
August |
0.24 |
|
September |
0.83 |
|
October |
0.18 |
|
November |
-0.24 |
|
December |
0.13 |
|
2023-January |
0.42 |
|
February |
0.27 |
|
March |
0.56 |
|
April |
-0.23 |
|
May |
0.63 |
|
June |
0.68 |
|
July |
0.01 |