Producer Price Index in the Industrial Sector for March 2023
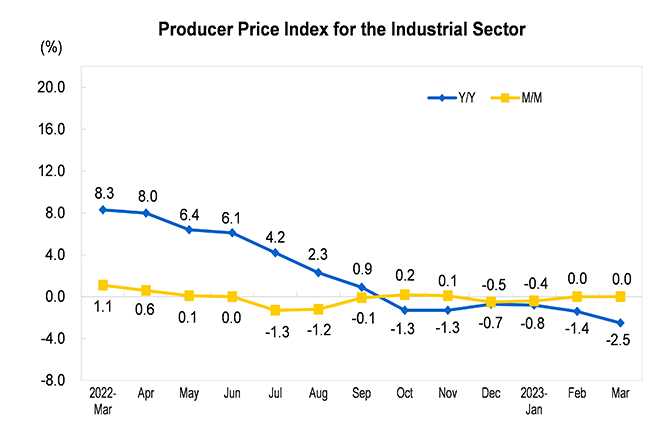
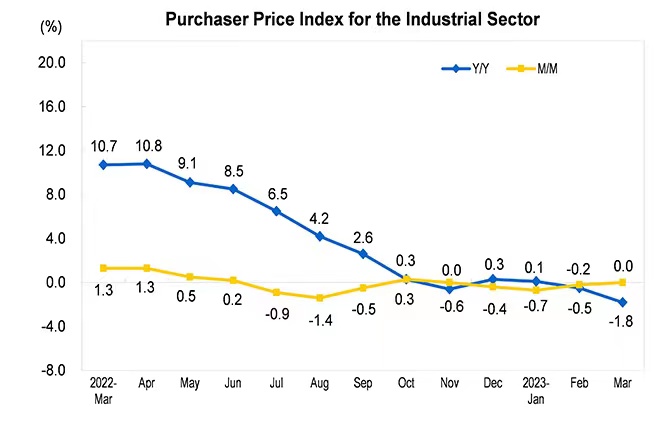
In March 2023, Producer Price Index (PPI) for manufactured goods decreased by 2.5 percent year-on-year and was unchanged month-on-month; the purchasing price of industrial products decreased by 1.8 percent year-on-year and was unchanged month-on-month. In the first quarter, the producer price of industrial products decreased by 1.6 percent over the same period last year, and the purchasing price of industrial products decreased by 0.8 percent.
1. Year-on-Year Changes of Prices of Different Categories in March
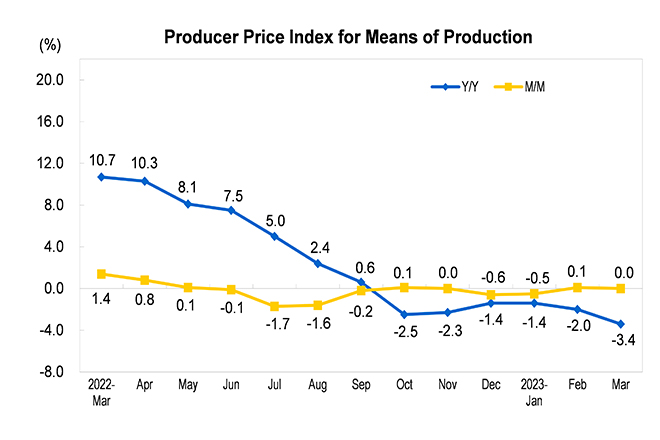
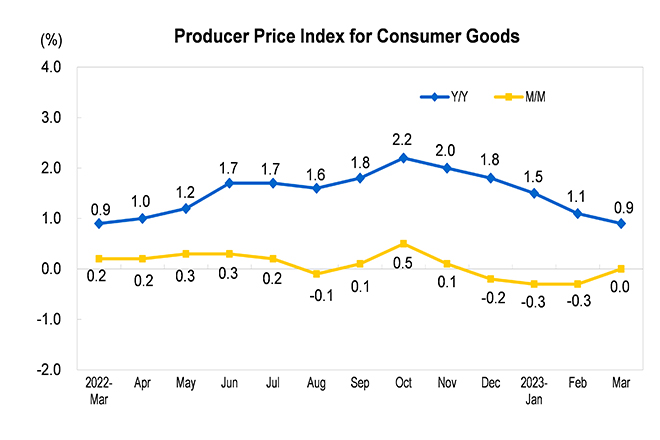
Among the producer price of industrial products, the price of means of production decreased by 3.4 percent, affecting the overall level of producer price of industrial products decreased by about 2.65 percentage points. Among them, the price of the mining industry decreased by 4.7 percent, the price of the raw material industry decreased by 4.2 percent, and the price of the processing industry decreased by 2.8 percent. The price of means of living increased by 0.9 percent, affecting the overall level of producer price of industrial products increased by about 0.20 percentage point. Among them, the prices of food and clothing both increased by 2.0 percent, general commodity prices increased by 0.5 percent, and durable consumer goods prices decreased by 0.2 percent.
Among the purchase prices of industrial producers, the price of chemical raw materials decreased by 7.1 percent, the price of ferrous metal materials decreased by 7.0 percent, the price of building materials and non-metallic decreased by 4.6 percent, the price of non-ferrous metal materials and wires decreased by 3.5 percent; the price of agricultural and sideline products increased by 3.7 percent, the price of fuel and power increased by 0.1 percent.
2. Month-on-Month Changes of Prices of Different Categories in March
Among the producer price of industrial products, the price of means of production was flat. Among them, the price of mining industry decreased by 0.5 percent, the price of raw materials industry decreased by 0.2 percent, and the price of processing industry increased by 0.1 percent. The price of means of living was flat. Among them, food prices and durable consumer goods prices both decreased by 0.1 percent, clothing prices increased by 0.1 percent, and general commodity prices increased by 0.2 percent.
Among the purchase prices of industrial producers, the price of ferrous metal materials increased by 1.1 percent, the price of non-ferrous metal materials and wires increased by 0.7 percent, the price of agricultural and sideline products increased by 0.2 percent, the price of building materials and non-metallic increased by 0.1 percent; the price of fuel and power decreased by 1.1 percent, the price of chemical raw materials decreased by 0.2 percent.
Price Indexes for the Industrial Sector in March 2023
|
M/M (%) |
Y/Y (%) |
Jan-Mar Growth Rate (%) |
|
|
I. Producer Price Indexes |
0.0 |
-2.5 |
-1.6 |
|
Means of production |
0.0 |
-3.4 |
-2.3 |
|
Mining and quarrying |
-0.5 |
-4.7 |
-0.9 |
|
Raw materials |
-0.2 |
-4.2 |
-1.9 |
|
Processing |
0.1 |
-2.8 |
-2.6 |
|
Means of Livelihood |
0.0 |
0.9 |
1.2 |
|
Food |
-0.1 |
2.0 |
2.5 |
|
Clothing |
0.1 |
2.0 |
1.8 |
|
General Commodity |
0.2 |
0.5 |
0.8 |
|
Durable consumer goods |
-0.1 |
-0.2 |
-0.1 |
|
II. Purchaser Price Indexes |
0.0 |
-1.8 |
-0.8 |
|
Fuel and Power |
-1.1 |
0.1 |
4.1 |
|
Ferrous Metals |
1.1 |
-7.0 |
-7.3 |
|
Non-ferrous Metal Materials and Wires |
0.7 |
-3.5 |
-2.5 |
|
Chemical Raw Materials |
-0.2 |
-7.1 |
-5.7 |
|
Wood and Pulp |
-0.7 |
2.5 |
3.4 |
|
Building Materials and Non-metallic |
0.1 |
-4.6 |
-4.9 |
|
Other Industrial Raw Materials and Semi-products |
0.1 |
-0.3 |
-0.1 |
|
Agricultural and Sideline Products |
0.2 |
3.7 |
4.5 |
|
Textile Raw Materials |
-0.2 |
-4.5 |
-4.0 |
|
III. Producer Price Indexes of Major Industries |
|||
|
Mining and Washing of Coal |
-1.2 |
-3.2 |
-0.8 |
|
Extraction of Petroleum and Natural Gas |
-0.9 |
-15.7 |
-5.3 |
|
Mining of Ferrous Metal Ores |
2.4 |
-7.2 |
-5.8 |
|
Mining of Non-Ferrous Metal Ores |
1.5 |
6.1 |
5.8 |
|
Mining and Processing of Nonmetal Ores |
-0.5 |
2.9 |
3.0 |
|
Processing of Food from Agricultural Products |
-0.5 |
3.5 |
4.9 |
|
Manufacture of Foods |
-0.1 |
0.1 |
0.5 |
|
Manufacture of Wines, Beverages and Refined Tea |
0.2 |
1.4 |
1.5 |
|
Manufacture of Cigarettes and Tobacco |
0.0 |
0.5 |
0.5 |
|
Manufacture of Textile |
0.1 |
-4.0 |
-3.6 |
|
Manufacture of Textile Wearing Apparel and Finery |
0.0 |
1.3 |
1.1 |
|
Processing of Timbers, Manufacture of Wood, Bamboo, Rattan, Palm, and Straw Products |
0.1 |
-1.3 |
-1.1 |
|
Manufacture of Paper and Paper Products |
-1.1 |
-3.0 |
-2.2 |
|
Printing, Reproduction of Recording Media |
0.2 |
-0.5 |
-0.4 |
|
Processing of Petroleum, Coal and Other Fuels |
-0.4 |
-6.1 |
0.3 |
|
Manufacture of Chemical Raw Material and Chemical Products |
0.0 |
-7.7 |
-6.3 |
|
Manufacture of Medicines |
0.1 |
-0.2 |
0.1 |
|
Manufacture of Chemical Fibers、 |
0.3 |
-3.7 |
-2.7 |
|
Manufacture of Rubber and Plastics Products |
-0.3 |
-3.0 |
-2.7 |
|
Manufacture of Non-metallic Mineral Products |
0.0 |
-6.0 |
-6.2 |
|
Smelting and Pressing of Ferrous Metals |
1.3 |
-11.0 |
-11.2 |
|
Smelting and Pressing of Ferrous Metals |
-0.3 |
-8.0 |
-5.9 |
|
Manufacture of Fabricated Metal Products |
0.0 |
-3.5 |
-3.2 |
|
Manufacture of General-Purpose Machinery |
-0.1 |
-0.1 |
-0.2 |
|
Manufacture of Motor Vehicles |
-0.1 |
-0.9 |
-0.7 |
|
Manufacture of Railway, Ship, Aerospace and Other transport equipment |
0.1 |
0.7 |
0.9 |
|
Manufacture of Computer, Communication Equipment and Other Electronic Equipment |
0.4 |
0.0 |
0.0 |
|
Production and Supply of Electric Power and Heat Power |
-0.3 |
2.2 |
2.6 |
|
Production and Supply of Gas |
-0.6 |
4.5 |
7.1 |
|
Production and Supply of Water |
0.1 |
0.4 |
0.3 |
Annotations:
1. Explanatory Notes
Producer Price Index for manufactured goods consists of producer price index and purchaser price index.
The industrial producer price index reflects the trend and level of prices change when the products are sold for the first time.
The industrial purchaser price index reflects the trend and level of prices change for the products purchased by the industrial enterprises as intermediate inputs.
2. Statistical Coverage
The factory price survey of industrial producers covers the prices of industrial products in 40 major industrial categories and more than 1300 basic categories; the purchase price survey of industrial producers covers the prices of industrial products in 9 major categories and more than 800 basic categories.
3. Survey Methods
The industrial producer price survey adopts the method of combining key survey with typical survey, involving more than 40,000 industrial enterprises in China.
4. Statistical Standard
Industrial Classification is based on the “Industrial Classification for National Economic Activities” (GB/T4754-2017).
5. Data Description
Due to "rounding-off", sometimes the aggregate data is the same as the high or low value of the classified data. The price changes of some categories or industries are small, and according to the "rounding-off" to retain 1 decimal place after the rise and fall is 0, in the expression of price changes as flat.