Energy production from January to February 2022
From January to February, the production of major energy products in industries above designated size increased to varying degrees. Compared with December of last year, the growth rate of raw coal, crude oil and natural gas production accelerated, and power production changed from decline to rise.
I. Raw Coal, Crude Oil and Natural Gas Production and Relevant Information
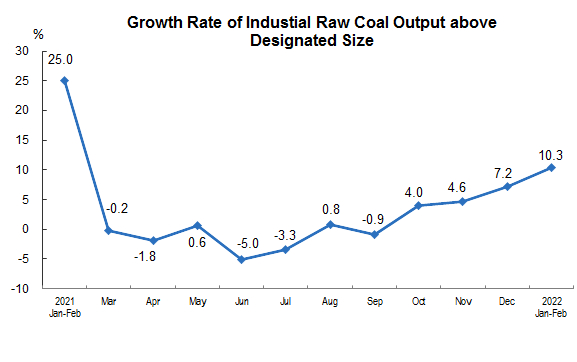
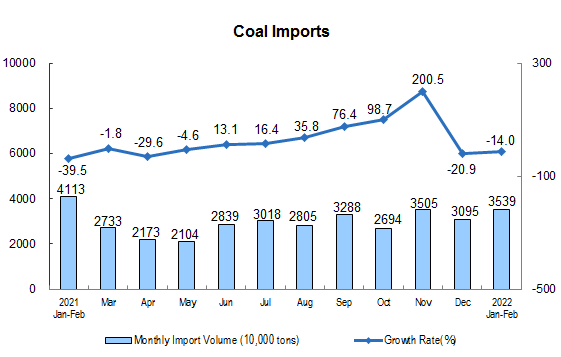
Raw coal production increased rapidly and the decline in imports narrowed. From January to February, 690 million tons of raw coal were produced, with a year-on-year increase of 10.3 percent, 3.1 percentage points faster than that in December of last year, and the average daily output was 11.64 million tons. Imported coal was 35.39 million tons, a year-on-year decrease of 14.0 percent, 6.9 percentage points lower than that in December last year.
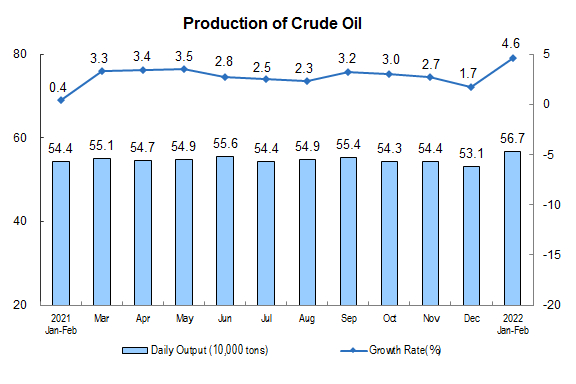
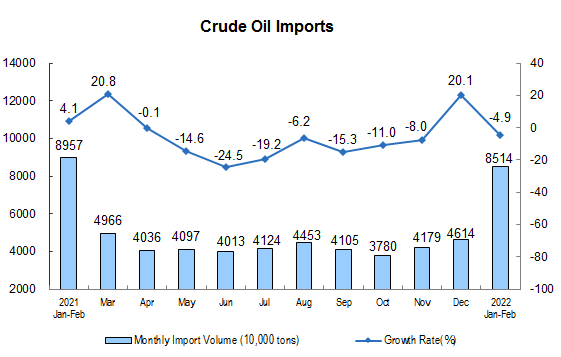
Crude oil production increased steadily and imports changed from increase to decrease. From January to February, 33.47 million tons of crude oil were produced, with a year-on-year increase of 4.6 percent, 2.9 percentage points faster than that in December of last year, and the average daily output was 567,000 tons. Imported crude oil was 85.14 million tons, a year-on-year decrease of 4.9 percent, an increase of 20.1 percent in December last year.
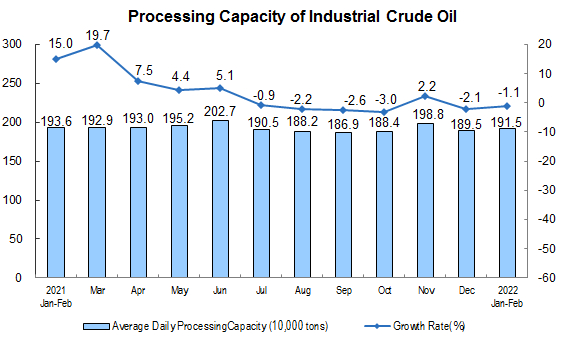
Crude oil processing volume decreased slightly. From January to February, 113.01 million tons of crude oil were processed, a year-on-year decrease of 1.1 percent, 1.0 percentage point lower than that in December of last year, and the average daily processing was 1.915 million tons.
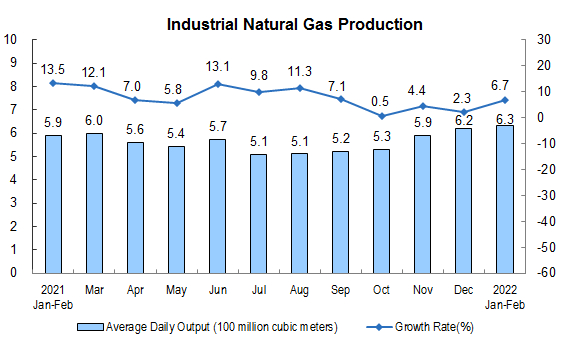
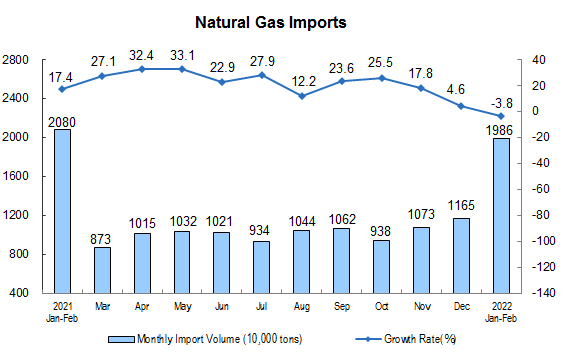
Natural gas production kept growth and imports decreased. From January to February, the production of natural gas was 37.2 billion cubic meters, a year-on-year increase of 6.7 percent, 4.4 percentage points faster than that in December of last year, and the average daily output was 630 million cubic meters. The import of natural gas was 19.86 million tons, a year-on-year decrease of 3.8 percent, an increase of 4.6 percent in December last year.
II. Electric Power Production
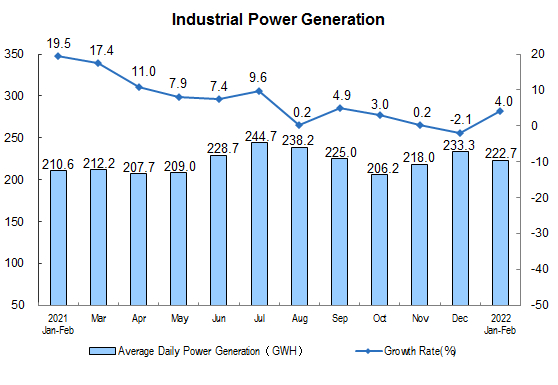
Power production has changed from down to up. From January to February, the power generation was 1,314.1 billion kwh, a year-on-year increase of 4.0 percent, a decrease of 2.1 percent in December last year, and the average daily power generation was 22.27 billion kwh.
In terms of varieties, in addition to wind power, thermal power, hydropower, nuclear power and solar power generation have increased to varying degrees. Among them, thermal power increased by 4.3 percent, hydropower increased by 8.2 percent, nuclear power increased by 9.6 percent, solar power increased by 6.5 percent and wind power decreased by 7.6 percent.
Annotations:
1. Explanatory Notes
Average daily product output: It is calculated by dividing the total output of Industrial Enterprises above the designated size announced in that month by the calendar days of that month.
2. Statistical Coverage
The statistical caliber of the output data in the report is above the designated size of industry, and the statistical scope is industrial enterprises with annual main business income of more than 20 million yuan.
Because the scope of Industrial Enterprises above the designated size changes every year, in order to ensure that this year's data is comparable with the previous year's, the same period used to calculate the growth rate of various indicators such as product output is consistent with the statistical scope of enterprises in this period, and there is a caliber difference between the data released last year.
3. Data Source
Import data comes from the General Administration of Customs, of which the data on January to February 2022 are express data.
4. Conversion relationship of natural gas units: 1 ton is equal to 1380 cubic meters.