China's Innovation Index in 2020
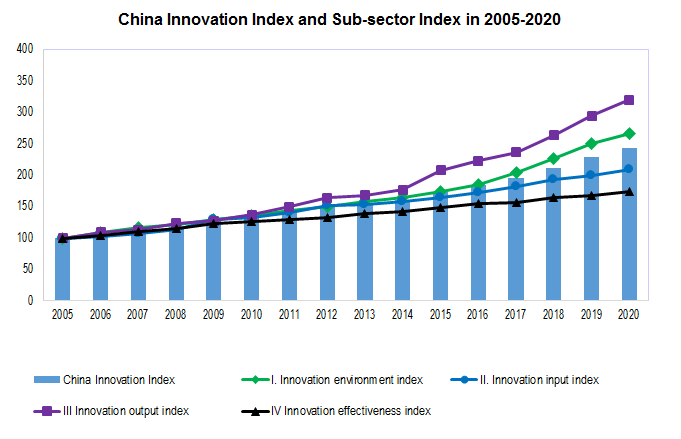
According to the calculation of the research group of Department of Social, Science and Technology, and Cultural Statistics of National Bureau of Statistics on China's innovation index [1], the innovation index of China reached 242.6 in 2020 (take 2005 as 100), an increase of 6.4 percent over the previous year. By field, the innovation environment index, innovation input index, innovation output index and innovation effectiveness index reached 266.3, 209.7, 319.8 and 174.7 respectively, an increase of 6.3, 5.4, 8.5 and 3.8 percent respectively over the previous year. The calculation results showed that in 2020, China's innovation ability and level continued to improve, the innovation environment continued to be optimized, the innovation input continued to increase, the innovation output grew rapidly, and the innovation results were further demonstrated.
I. Network economy index.
In 2020, China's innovation environment index was 266.3, an increase of 6.3 percent over the previous year. The five evaluation index indexes in this field increased four and decreased one. Among them, the index of the number of people with college degree or above in the labor force, the index of the proportion of science and engineering graduates in the school-age population, and the index of the proportion of enterprises enjoying tax exemption and deduction all achieved double-digit growth, with growth rates of 14.3, 13.1 and 12.4 percent respectively; per capita GDP index increased by 2.2 percent; the proportion index of science and technology allocation in financial allocation decreased by 8.4 percent.
II. Economic vitality index.
In 2020, the innovation investment index was 209.7, an increase of 5.4 percent over the previous year. The six evaluation indexes in this field have increased in varying degrees. Among them, the full-time equivalent index of R&D personnel per 10,000 people and the proportion of R&D funds in GDP have increased rapidly, with the growth rates of 8.9 and 7.2 percent respectively; the proportion index of enterprises with R&D institutions, the proportion index of enterprise R&D funds in main business income and the proportion index of enterprises carrying out industry university research cooperation increased by 6.9, 4.9 and 3.8 percent respectively; the per capita funding index for basic researchers increased by 0.9 percent.
III. Innovation driven index.
In 2020, the innovation output index was 319.8, an increase of 8.5 percent over the previous year. The five evaluation index indexes in this field increased four and decreased one. Among them, the patent authorization index per 10,000 R&D personnel, the technology market turnover index per 10,000 scientific and technological activity personnel and the trademark ownership index per 100 enterprises all achieved double-digit growth, with growth rates of 24.6, 19.1 and 17.6 percent respectively; The number of scientific and technological papers per 10,000 people increased by 0.1 percent; the proportion index of invention patent authorization in patent authorization decreased by 13.8 percent.
IV. Knowledge capability index.
In 2020, the innovation effectiveness index was 174.7, an increase of 3.8 percent over the previous year. The five evaluation indexes in this field have increased in varying degrees. Among them, the proportion of new product sales revenue in main business revenue has increased rapidly, with a growth rate of 9.9 percent; the per capita main business income index and the proportion index of the export of high-tech products in the export of goods increased by 5.9 and 2.5 percent respectively; the contribution rate index of scientific and technological progress and energy consumption index per unit GDP increased by 0.8 and 0.2 percent respectively.
China Innovation Index
|
| 2005 | 2010 | 2015 | 2019 | 2020 |
|
|
|
|
|
|
|
| China Innovation Index | 100 | 133.0 | 173.8 | 228.1 | 242.6 |
| I. Innovation Environment Index | 100 | 135.7 | 174.5 | 250.4 | 266.3 |
| Index of the Number of People with College Degree or Above in the Labor Force. | 100 | 161.7 | 246.5 | 278.7 | 318.5 |
| Per Capita GDP | 100 | 166.6 | 236.5 | 299.9 | 306.5 |
| Proportion Index of Science and Engineering Graduates in the Population of School Age | 100 | 142.8 | 182.8 | 219.0 | 247.7 |
| Ratio Index of Science and Technology Appropriation to Financial Appropriation | 100 | 116.4 | 101.2 | 114.0 | 104.4 |
| Index of Proportion of Enterprises Enjoying Additional Tax Deduction and Exemption | 100 | 103.0 | 150.3 | 476.7 | 535.7 |
| II. Innovation Input Index | 100 | 132.3 | 164.1 | 199.0 | 209.7 |
| Full Time Equivalent Index of R&D Personnel Per 10,000 People | 100 | 182.5 | 260.3 | 326.2 | 355.1 |
| Ratio Index of R&D Expenditure to GDP | 100 | 130.7 | 157.5 | 171.3 | 183.6 |
| Basic Researcher's Per Capita Expenditure Index | 100 | 163.5 | 248.0 | 298.6 | 301.3 |
| Ratio Index of R&D Funds to Main Business Income | 100 | 112.8 | 125.5 | 142.1 | 149.0 |
| Proportion Index of Enterprises with R&D Institutions | 100 | 117.6 | 143.8 | 195.4 | 208.7 |
| Proportion Index of Enterprises Carrying Out Industry University Research Cooperation | 100 | 103.7 | 106.6 | 134.6 | 139.7 |
| III. Innovation Output Index. | 100 | 137.2 | 208.1 | 294.7 | 319.8 |
| Index of Scientific Papers Per 10,000 People | 100 | 152.8 | 164.3 | 191.3 | 191.6 |
| Patent Authorization Index Per 10,000 R&D Personnel | 100 | 230.6 | 337.9 | 429.3 | 534.9 |
| Proportion Index of the Number of Invention Patents Authorized to the Number of Patents Authorized | 100 | 89.3 | 136.7 | 144.8 | 124.8 |
| Index of Trademark Ownership Per Hundred Enterprises | 100 | 100.1 | 180.0 | 386.4 | 454.6 |
| Index of Technical Market Turnover Per 10,000 Scientific and Technological Activity Personnel | 100 | 155.3 | 287.7 | 489.1 | 582.3 |
| IV. Innovation Effectiveness Index | 100 | 126.8 | 148.5 | 168.3 | 174.7 |
| Proportion Index of New Product Sales Revenue to Main Business Revenue | 100 | 115.2 | 127.3 | 170.8 | 187.8 |
| Index of the Proportion of High-tech Products Exports to Goods Exports | 100 | 109.0 | 100.6 | 102.1 | 104.6 |
| Energy Consumption Index Per Unit GDP | 100 | 123.8 | 150.7 | 173.4 | 173.7 |
| Per Capita Main Business Income Index | 100 | 179.0 | 292.5 | 324.5 | 343.7 |
| Science and Technology Progress Contribution Rate Index | 100 | 117.8 | 128.0 | 137.7 | 138.9 |
|
|
|
|
|
|
|
Note [1]: Due to the revision of historical data of relevant indicators after the Seventh National Population Census and the revision of historical data of Gross Domestic Product (GDP) and other indicators according to the routine statistical system, the historical calculation results of China innovation index are adjusted accordingly.
Annotation:
China’s Innovation Index System and the Compiling Methods of the Index
I. China's Innovation Index System
China's innovation index system is divided into three levels. The first level is used to reflect the overall development of innovation in China, which is realized by calculating the total innovation index; the second level is used to reflect the development of China in four fields, including innovation environment, innovation input, innovation output and innovation effect, which is realized by calculating the sub field index; the third level is used to reflect the specific development of all aspects of the innovation ability, which is realized by the above-mentioned 4 fields and 21 evaluation indexes selected in each field (see the attached table for the framework of index system). Four areas and 21 evaluation indicators are briefly described as follows:
(I) Innovation Environment
This field mainly reflects the support of human, financial and other basic conditions necessary to drive the development of innovation ability, as well as the guidance and support of policy environment for innovation. There are five evaluation indicators.
1. Number of Workers with College Degree or Above
This index is used to reflect the comprehensive quality of labor force in China. Labor force refers to the population aged 16 and above who have the ability to work and participate in or require to participate in social and economic activities. In 2015 and prior years, the index is named as the number of people with college degree or above in the economically active population.
2. Per Capita GDP
This is the most representative indicator of a country's economic strength, which can reflect the interdependence and mutual promotion between economic growth and innovation capacity development.
3. Proportion of Science and Engineering Graduates in School Age Population
This index reflects the situation of potential innovative human resources in China. Graduates of science and engineering refer to the number of graduates of science, engineering, agriculture and medicine at or above the undergraduate level, and the population of school age refers to the population aged 20-34 in China.
4. Proportion of Science and Technology Appropriation in Financial Appropriation
The government's financial allocation for science and technology plays a leading role in the innovation investment and innovation activities of the whole society. This indicator reflects the government's direct investment in innovation as well as the planning and guidance on key, important and frontier fields.
5. Proportion of Enterprises Enjoying Additional Tax Deduction or Exemption
The policy of adding and deducting R&D expenses before tax is considered as one of the most direct and favorable supporting policies to encourage enterprises to increase R&D investment and carry out innovation activities. This indicator can reflect the implementation of relevant government policies, and then reflect the innovation environment of enterprises from one side. Limited by data sources, the data caliber of this indicator is large and medium-sized industrial enterprises.
(II) Innovation Investment
This field reflects the role and relationship of each subject in the national innovation system through the human and financial input of innovation, the construction of departments (R&D institutions) that play a key role in the innovation subject of enterprises and the cooperation of innovation subjects. Due to the lack of human and financial input indicators for innovation and R&D is the most important link of innovation in China, the input indicators here are replaced by R&D input indicators. There are six indicators in this area.
1. Full Time Equivalent of R&D Personnel Per 10,000 People
It refers to the full-time equivalent of R&D personnel based on the average of the total resident population. This index reflects the input scale and intensity of independent innovation manpower. R&D personnel include R&D personnel of enterprises, scientific research institutions and colleges and universities. They are the joint forces of R&D manpower input of all kinds of innovation subjects in the whole society. The full-time equivalent of R&D personnel refers to the R&D personnel converted by workload.
2. Proportion of R & D expenditure in GDP
This index, also known as R&D input intensity, is the core index that is generally used in the world and reflects the level of national or regional scientific and technological input, and is also an important evaluation index in the outline of China's medium and long-term scientific and technological development plan.
3. Per Capita Funding of Basic Researchers
It refers to the average basic research funds according to the full-time equivalent of basic researchers. Basic research is the foundation of the development of science and technology, and its level can represent a country's original innovation ability to a certain extent. This indicator system uses this indicator to reflect the national efforts to strengthen the original innovation capacity.
4. Proportion of R & D Funds in Main Business Income
Enterprises are the main body of innovation activities, while industrial enterprises play a leading role in enterprise innovation activities. This indicator reflects the investment of the main body of innovation activities. Limited by data sources, the data caliber of this indicator is large and medium-sized industrial enterprises with R&D activities.
5. Proportion of Enterprises with R&D Institutions
R & D institutions run by enterprises are specialized institutions for enterprises to carry out R&D activities and important guarantee for enterprises to carry out innovation activities continuously and stably. This indicator reflects the ability of enterprises to carry out innovation activities continuously from one side. Limited by data sources, the data caliber of this indicator is large and medium-sized industrial enterprises.
6. Proportion of Enterprises Carrying out Industry University Research Cooperation
This index is an important index reflecting the cooperation between industry, university and research institute. This index system reflects the cooperation among innovation subjects in China through the cooperation of industry, university and research. Limited by data sources, the data caliber of this indicator is large and medium-sized industrial enterprises.
(III) innovation output
In this field, the turnover of papers, patents, trademarks and technological achievements reflects the intermediate output of innovation. There are five indicators in this area.
1. Number of Scientific and Technological Papers Per 10,000 People
Scientific and technological papers refer to the academic papers produced by scientific and technological projects approved by enterprises and institutions and published in journals with regular numbers. Scientific and technological papers are one of the important forms of achievements produced in the process of innovation activities. This indicator reflects the output level and efficiency of R&D activities.
2. Number of Patent Authorizations Per 10,000 R & D Personnel
It refers to the average number of patent authorizations according to the full-time equivalent of R&D personnel. The number of patent authorizations in this indicator system refers to the number of domestic patent authorizations, which is another important form of intermediate output of innovation activities. This indicator is also an important indicator reflecting the output level and efficiency of R&D activities.
3. Proportion of the Number of Invention Patents Authorized to the Number of Patents Authorized
Invention patents have the highest technology content among the three patents, which can reflect the level of patents, and also reflect the market value and competitiveness of research and development achievements. The number of invention patents authorized in this indicator system refers to the number of domestic invention patents authorized. This index is the key index reflecting patent quality.
4. Trademark Ownership Per Hundred Enterprises
Trademark ownership refers to the number of trademarks that are protected by intellectual property law and registered by intellectual property departments at home and abroad. To a certain extent, the index reflects the ownership of independent brand and the operation ability of independent brand. Limited by data sources, the data caliber of this indicator is large and medium-sized industrial enterprises.
5. Technical Market Turnover Per 10,000 Scientific and Technological Activity Personnel
It refers to the average transaction amount of technology market per 10,000 scientific and technological personnel. This indicator reflects the overall scale of technology transfer and transformation of scientific and technological achievements. The turnover in the technology market refers to the total amount of the contracted projects in the national technology market.
(IV) Innovation Effect
This field reflects the impact of innovation on economic and social development through product structure adjustment, industrial international competitiveness, energy conservation, economic growth and other aspects. There are five indicators in this area.
1. Proportion of Sales Revenue of New Products in Main Business Revenue
Sales revenue of new products is an indicator that reflects the innovation achievements of enterprises and successfully pushes new products to the market. This index is used to reflect the effect of innovation on product structure adjustment. Limited by data sources, the data caliber of this indicator is large and medium-sized industrial enterprises.
2. Proportion of Export of High-tech Products in Export Volume of Goods
There is an interactive relationship between high-tech industry and innovation. This index reflects the effect of innovation on the international competitiveness of the industry through the change of high-tech products export. The data caliber of this index is industrial enterprises above designated size.
3. Energy Consumption Per Unit of GDP
It refers to the energy consumed in standard coal per 10,000 yuan of GDP. Energy conservation is one of the purposes of enterprise technology innovation. Innovation is the way and guarantee of energy conservation, and plays a decisive role in energy conservation. This indicator reflects the effect of innovation on energy consumption reduction.
4. Per Capita Main Business Income
It refers to the ratio of the main business income of industrial enterprises to the average number of workers in a certain period of time to reflect the production efficiency. Innovation is an important factor affecting production efficiency, and improving production efficiency is one of the purposes of enterprise innovation. This index reflects the role of innovation in promoting industrial economic development. The data caliber is industrial enterprises above designated size.
5. Contribution Rate of Scientific and Technological Progress
It refers to the contribution share of generalized technological progress to economic growth, i.e. the contribution of other factors to economic growth except capital and labor. The index data comes from the evaluation results of the contribution rate of scientific and technological progress carried out by the relevant departments. It is a comprehensive index to measure the competitive strength of science and technology and the transformation of science and technology into real productivity. This indicator system uses the average level of the reporting period and the previous four years to reflect the promotion effect of innovation on national economic development.
II. Compilation Method of China Innovation Index
(I) Determine Index Weight
On the basis of comparing the advantages and disadvantages of weighting methods at home and abroad, this topic adopts the "level by level equal weight method" to distribute the weights, that is, the weights of each field are all 1 / 4; in a certain field, the weights of indicators to their fields are 1 / n (n is the number of indicators in this field); therefore, the final weights of indicators are 1 / 4N. See the attached table for the weight of each indicator.
(II) Calculation of Index Growth Rate
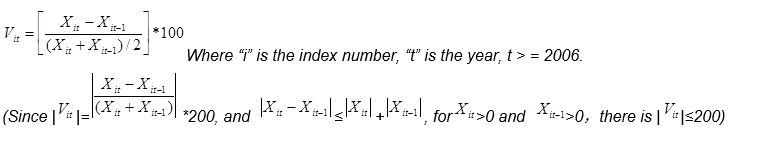
Generally, the growth rate or development speed of indicators is compared based on the indicator value of the base year. In a certain index system, if the growth rate of each index is calculated according to the usual method and weighted average is carried out, there may be a situation that the growth rate of some indexes is too high (or too low), which will cause the incompatibility between the growth rate of indexes (that is, the effect of some indexes with too high or too low growth rate covers the role of other indexes), thus causing the distortion of the whole index system. Therefore, it is necessary to control the growth range of each index in the index system. A better method is to set the benchmark value of index growth as the two-year average value of the index, so that the calculated growth range of each index can be controlled within the range of [- 200, 200].
In this index system, except that "10,000-yuan GDP energy consumption" is the inverse index, the other 20 indexes are all positive indexes. Take the reciprocal of the inverse index and calculate the index growth rate.
The calculation method for the growth rate of each index in the adjacent years is as follows:
(III) Composite Sub Domain Index and Total Index
The index synthesis method is divided into the following three steps:
1. Calculate the weighted growth rate of indicators in each field:
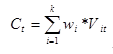 ,Where “wi” is the weight of each indicator to its field, “K” is the number of indicators in the field, “t” is the year, t > = 2006.
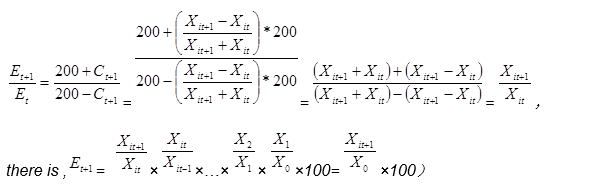
2. Calculate the sub index of each field of the cumulative development of the fixed base:
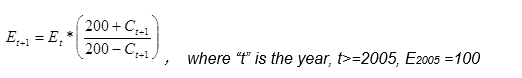
(when calculating the development speed of a certain indicator in the indicator system, if this method is adopted, the result is consistent with the usual method, that is, the development speed of the indicator in the current year is equal to the product of the development speed of the indicator in the previous year and that in the current year divided by 100, and the development speed of the indicator in the current year is equal to the ratio of the value of the indicator in the current year multiplied by 100 and that in the base period.
This is due to:
Attached Table
China's Innovation Index System Framework
| Item | Indicator | Unit | Weight※ |
| Innovation Environment (1/4) | Index of the Number of People with College Degree or Above in the Labor Force. | Person /10,000 persons | 1/5 |
| Per Capita GDP | yuan/person | 1/5 | |
| Proportion Index of Science and Engineering Graduates in the Population of School Age | percent | 1/5 | |
| Ratio Index of Science and Technology Appropriation to Financial Appropriation | percent | 1/5 | |
| Index of Proportion of Enterprises Enjoying Additional Tax Deduction and Exemption | percent | 1/5 | |
| Innovation Input (1/4) | Full Time Equivalent Index of R&D Personnel Per 10,000 People | man-year/10,000 persons | 1/6 |
| Ratio Index of R&D Expenditure to GDP | percent | 1/6 | |
| Basic Researcher's Per Capita Expenditure Index | 10,000 yuan/man-year | 1/6 | |
| Ratio Index of R&D Funds to Main Business Income | percent | 1/6 | |
| Proportion Index of Enterprises with R&D Institutions | percent | 1/6 | |
| Proportion Index of Enterprises Carrying Out Industry University Research Cooperation | percent | 1/6 | |
| Innovation Output (1/4) | Index of Scientific Papers Per 10,000 People | piece/10,000 persons | 1/5 |
| Patent Authorization Index Per 10,000 R&D Personnel | piece/10,000 man-year | 1/5 | |
| Proportion Index of the Number of Invention Patents Authorized to the Number of Patents Authorized | percent | 1/5 | |
| Index of Trademark Ownership Per Hundred Enterprises | piece/100 unit | 1/5 | |
| Index of Technical Market Turnover Per 10,000 Scientific and Technological Activity Personnel | 100 million yuan/10,000 persons | 1/5 | |
| Innovation Effectiveness (1/4) | Proportion Index of New Product Sales Revenue to Main Business Revenue | percent | 1/5 |
| Index of the Proportion of High-tech Products Exports to Goods Exports | percent | 1/5 | |
| Energy Consumption Index Per Unit GDP | tons of SCE/10,000 yuan | 1/5 | |
| Per Capita Main Business Income Index | 10,000 yuan/person | 1/5 | |
| Science and Technology Progress Contribution Rate Index | percent | 1/5 |
※Note: the weight of each sub field is 1 / 4, and the weight of an indicator in a sub field to its field is 1 / N (“n” is the number of indicators in this field).