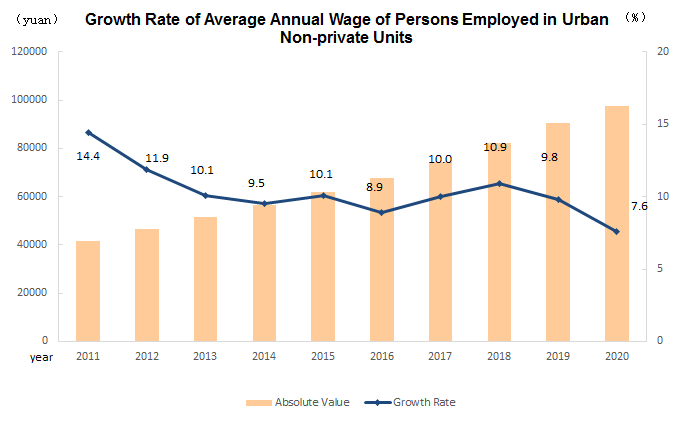
The Average Annual Wage of Persons Employed in Urban Non-private Units In 2020
In 2020, the average annual wage of urban non-private sector employees in China was 97,379 yuan, an increase of 6,878 yuan over the previous year, a nominal increase [1] of 7.6 percent, and the growth rate was 2.2 percentage points lower than that in 2019. After deducting the price factor, the annual average wage of non-private sector employees in urban units increased by 5.2 percent in real terms in 2020.
In terms of the four major regions, the average annual wages of urban non private sector employees were 112,372, 88,000, 78,193 and 77,631 yuan in the eastern, western, central and northeast regions respectively, increased by 8.0, 7.4, 6.4 and 8.2 percent over the previous year. The ratio of average wages in the highest and lowest areas was 1.45, which was basically the same as that of the previous year.
| Average Annual Wage of Persons Employed in Urban Non-private Units In 2020 By Region | |||
| Regions | 2020 (yuan) | 2019 (yuan) | Growth Rate (%) |
| | | | |
| National Total | 97379 | 90501 | 7.6 |
| Eastern | 112372 | 104069 | 8.0 |
| Central | 78193 | 73457 | 6.4 |
| Western | 88000 | 81954 | 7.4 |
| Northeastern | 77631 | 71721 | 8.2 |
| | | | |
In terms of industry categories, the three industries with the highest annual average wage were information transmission, software and information technology services, which were 177,544 yuan, scientific research and technology services, which were 139,851 yuan, and financial industry, which were 133,390 yuan, 1.82, 1.44 and 1.37 times of the national average respectively. The three industries with the lowest annual average wage were agriculture, forestry, animal husbandry and fishery, accommodation and catering, and resident service, repair and other service industries, which were 48,540, 48,833 and 60,722 yuan, respectively 50, 50 and 62 percent of the national average.
In terms of growth rate, the three industries with the highest annual average wage growth were agriculture, forestry, animal husbandry and fishery, public management, social security and social organizations, and information transmission, software and information technology service industries, with an increase of 23.4, 10.7 and 10.0 percent respectively. The three industries with the lowest growth rate were accommodation and catering industry, which decreased by 3.0 percent, residential service, repair and other service industry increased by 0.8 percent, and financial industry increased by 1.5 percent.
| Average Annual Wage of Persons Employed in Urban Non-private Units In 2020 By Sector | |||
| Sectors | 2020 (yuan) | 2019 (yuan) | Growth Rate (%) |
| | | | |
| Total | 97379 | 90501 | 7.6 |
| Farming, Forestry, Animal Husbandry, and Fishery | 48540 | 39340 | 23.4 |
| Mining | 96674 | 91068 | 6.2 |
| Manufacturing | 82783 | 78147 | 5.9 |
| Production and Supply of Electricity, Heat, Gas and Water | 116728 | 107733 | 8.3 |
| Construction | 69986 | 65580 | 6.7 |
| Wholesale and Retail Trades | 96521 | 89047 | 8.4 |
| Transport, Storage, and Post | 100642 | 97050 | 3.7 |
| Accommodation and Restaurants | 48833 | 50346 | -3.0 |
| Information Transmission, Software and Information Technology Services | 177544 | 161352 | 10.0 |
| Finance | 133390 | 131405 | 1.5 |
| Real Estate | 83807 | 80157 | 4.6 |
| Renting and Leasing Activities and Business Services | 92924 | 88190 | 5.4 |
| Scientific Research and Technical Services | 139851 | 133459 | 4.8 |
| Management of Water Conservancy, Environment and Public Facilities | 63914 | 61158 | 4.5 |
| Residential Services, Repairs and Other Services | 60722 | 60232 | 0.8 |
| Education | 106474 | 97681 | 9.0 |
| Health, Social Works | 115449 | 108903 | 6.0 |
| Culture, Sports and Entertainment | 112081 | 107708 | 4.1 |
| Public Administration, Social Security and Social Organization | 104487 | 94369 | 10.7 |
| | | | |
According to the types of registration, the highest annual average wage was 112,089 yuan, which was 1.15 times of the national average; the lowest annual average wage was 68,590 yuan, which was 70 percent of the national average.
In terms of growth rate, the annual average wage of investment units of Hong Kong, Macao and Taiwan businesses grew the highest, with an increase of 9.7 percent. Except for the state-owned, collective and Hong Kong, Macao and Taiwan investment units, the average wage growth of other units was lower than the national average.
| Average Annual Wage of Persons Employed in Urban Non-private Units In 2020 By Registration Status | |||
| | |||
| Registration Status | 2020 (yuan) | 2019 (yuan) | Growth Rate (%) |
| | | | |
| Total | 97379 | 90501 | 7.6 |
| State-owned Enterprises | 108132 | 98899 | 9.3 |
| Collective-owned Enterprises | 68590 | 62612 | 9.5 |
| Limited Liability Corporations | 84439 | 79515 | 6.2 |
| Share-holding Corporation Ltd. | 108583 | 103087 | 5.3 |
| Funds from Hong Kong, Macao and Taiwan | 100155 | 91304 | 9.7 |
| Foreign Investment | 112089 | 106604 | 5.1 |
| Others | 74399 | 72494 | 2.6 |
| | | | |
Note: [1] the following are all nominal growth, unless noted specially.
Annotations:
1. Explanatory Notes
(1) Persons Employed in Various Units: refers to those who work in the unit and are paid labor remuneration by the unit.
(2) Total Wage: according to the Regulations on the Composition of Total Wage (see the official website http://www.stats.gov.cn/zjtj/tjfg/xzfg/200207/t20020702_36026.html),
Total Wage refers to the total amount of labor remuneration paid directly to the employees of the unit during the reporting period (quarterly or annual). It includes time wage, piece wage, bonus, allowance and subsidy, overtime wage and salary paid in special circumstances.
The total wage is the pretax wage, including the personal income tax, social insurance fund, housing accumulation fund and other personal contributions directly withheld or paid by the unit from the personal wage, as well as the room fee, water and electricity fee.
The total amount of wage, whether included in the cost or not, whether paid in currency or in physical, shall be included in the calculation scope of the total amount of wage.
(3) Average wage: refers to the per capita wage paid by the unit in the reporting period. The calculation formula is:
Average wage=Total Amount of Wage in the Reporting Period/Average Number of People in the Reporting Period
2. Statistical Coverage
Non private legal person units in urban areas and industrial activity units recognized statistically as legal person units. Specifically, it includes state-owned units, urban collective units, joint ventures, joint-stock systems, foreign investment, Hong Kong, Macao and Taiwan investment units.
Wage statistics mainly focus on the employees of legal entities, while non unit employees such as individual employees and freelancers are not included in the scope of wage statistics.
3. Survey Methods
According to the Survey System of Enterprise One Table and the Survey System of Labor Wage formulated by the National Bureau of statistics, the comprehensive investigation method is adopted for the legal entity with one set of tables, and the sampling investigation method is adopted for the non-legal entity with one set of tables.
4. Division Method of East, Central, West and Northeast China
The East includes: Beijing, Tianjin, Hebei, Shanghai, Jiangsu, Zhejiang, Fujian, Shandong, Guangdong and Hainan.
The central part includes Shanxi, Anhui, Jiangxi, Henan, Hubei and Hunan.
The West includes: Inner Mongolia, Guangxi, Chongqing, Sichuan, Guizhou, Yunnan, Tibet, Shaanxi, Gansu, Qinghai, Ningxia and Xinjiang.
The Northeast includes Liaoning, Jilin and Heilongjiang.
5. Industrial Classification Standard
The industrial classification standard of wage statistics shall be implemented in accordance with the Industrial Classification of National Economy (GB / T4754-2017).
6. Registration Type
Others include share cooperation, joint venture and other domestic capital.
7. The data of the base period of the previous year shall be subject to the officially published China Statistical Yearbook -2020.