Households' Income and Consumption Expenditure in 2020
I. Households' Income
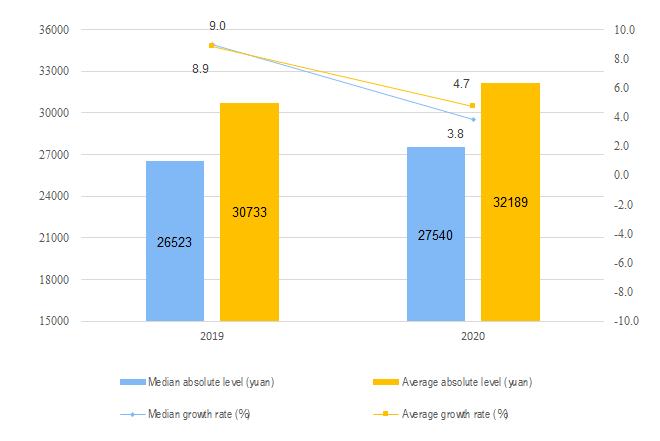
In 2020, China's per capita disposable income reached 32,189 yuan, a nominal increase of 4.7 percent over the previous year, and a real increase of 2.1 percent after deducting price factors. Among them, the per capita disposable income of urban residents was 43,834 yuan, an increase of 3.5 percent (if there is no special explanation below, it is the nominal growth rate on a year-on-year basis), with an actual increase of 1.2 percent after deducting the price factor; the per capita disposable income of rural residents was 17,131 yuan, an increase of 6.9 percent, with an actual increase of 3.8 percent after deducting the price factor.
In 2020, the median per capita disposable income of residents in China was 27,540 yuan, an increase of 3.8 percent, and the median was 85.6 percent of the average. Among them, the median per capita disposable income of urban residents was 40,378 yuan, an increase of 2.9 percent, which was 92.1 percent of the average; the median per capita disposable income of rural residents was 15,204 yuan, an increase of 5.7 percent, which was 88.7 percent of the average.
According to the source of income, in 2020, the per capita wage income of national residents was 17,917 yuan, an increase of 4.3 percent, accounting for 55.7 percent of the disposable income; the per capita net operating income was 5,307 yuan, an increase of 1.1 percent, accounting for 16.5 percent of the disposable income; the per capita net property income was 2,791 yuan, an increase of 6.6 percent, accounting for 8.7 percent of the disposable income; the per capita net transfer income was 6,173 yuan, an increase of 8.7 percent, accounting for 19.2 percent of the disposable income.
II. Consumption Expenditure of Households
In 2020, China's per capita consumption expenditure was 21,210 yuan, a nominal decrease of 1.6 percent over the previous year, and a real decrease of 4.0 percent after deducting price factors. Among them, the per capita consumption expenditure of urban residents was 27,007 yuan, a decrease of 3.8 percent, after deducting the price factor, the actual decrease was 6.0 percent; the per capita consumption expenditure of rural residents was 13,713 yuan, an increase of 2.9 percent, after deducting the price factor, the actual decrease was 0.1 percent.
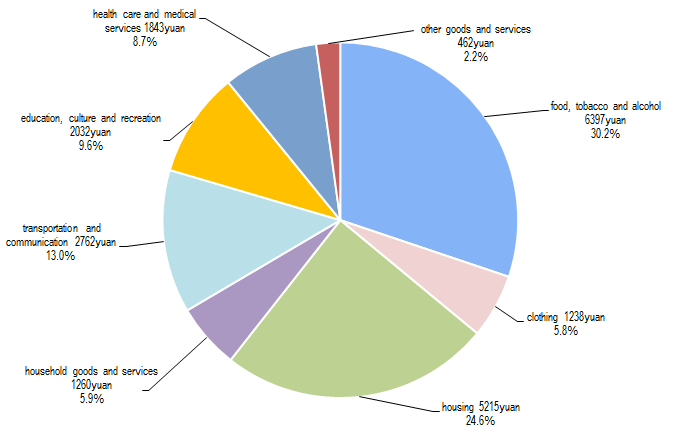
In 2020, the per capita food, tobacco and alcohol consumption expenditure of national residents was 6,397 yuan, an increase of 5.1 percent, accounting for 30.2 percent of the per capita consumption expenditure; the per capita clothing consumption expenditure was 1,238 yuan, a decrease of 7.5 percent, accounting for 5.8 percent of the per capita consumption expenditure; the per capita residential consumption expenditure was 5,215 yuan, an increase of 3.2 percent, accounting for 24.6 percent of the per capita consumption expenditure; the per capita household goods and services consumption expenditure was 1,260 yuan, a decrease of 1.7 percent, accounting for 5.9 percent of per capita consumption expenditure; the per capita transportation and communication consumption expenditure was 2,762 yuan, down 3.5 percent, accounting for 13.0 percent of per capita consumption expenditure; per capita education, culture and entertainment consumption expenditure was 2,032 yuan, down 19.1 percent, accounting for 9.6 percent of per capita consumption expenditure; per capita health care consumption expenditure was 1,843 yuan, down 3.1 percent, accounting for 8.7 percent of per capita consumption expenditure; per capita other supplies and the expenditure on service consumption was 462 yuan, down 11.8 percent, accounting for 2.2 percent of the per capita consumption expenditure.
| Table 1 Income and Expenditure Nationwide in 2020
|
| ||||||||||||||||||||||||||||||||||||||||||||||||||||||||||||||||||||||||||||||||||||||||||||||||||||||||||||||||||||||||||||||||||||||||||||||||||||||||||||||||||||||||||||||||||||||||||||||||||||||||||||||||||||||||||||
| Item | Absolute Value ( yuan) | Y/Y(%) |
| ||||||||||||||||||||||||||||||||||||||||||||||||||||||||||||||||||||||||||||||||||||||||||||||||||||||||||||||||||||||||||||||||||||||||||||||||||||||||||||||||||||||||||||||||||||||||||||||||||||||||||||||||||||||||||
|
|
|
|
|
|
| ||||||||||||||||||||||||||||||||||||||||||||||||||||||||||||||||||||||||||||||||||||||||||||||||||||||||||||||||||||||||||||||||||||||||||||||||||||||||||||||||||||||||||||||||||||||||||||||||||||||||||||||||||||||||
| Total Per Capita Income Nationwide | 32189 | 4.7(2.1) | |||||||||||||||||||||||||||||||||||||||||||||||||||||||||||||||||||||||||||||||||||||||||||||||||||||||||||||||||||||||||||||||||||||||||||||||||||||||||||||||||||||||||||||||||||||||||||||||||||||||||||||||||||||||||||
| Grouped by Permanent Residence |
|
| |||||||||||||||||||||||||||||||||||||||||||||||||||||||||||||||||||||||||||||||||||||||||||||||||||||||||||||||||||||||||||||||||||||||||||||||||||||||||||||||||||||||||||||||||||||||||||||||||||||||||||||||||||||||||||
| Urban Households | 43834 | 3.5(1.2) | |||||||||||||||||||||||||||||||||||||||||||||||||||||||||||||||||||||||||||||||||||||||||||||||||||||||||||||||||||||||||||||||||||||||||||||||||||||||||||||||||||||||||||||||||||||||||||||||||||||||||||||||||||||||||||
| Rural Households | 17131 | 6.9(3.8) | |||||||||||||||||||||||||||||||||||||||||||||||||||||||||||||||||||||||||||||||||||||||||||||||||||||||||||||||||||||||||||||||||||||||||||||||||||||||||||||||||||||||||||||||||||||||||||||||||||||||||||||||||||||||||||
| Grouped by Income Source |
|
| |||||||||||||||||||||||||||||||||||||||||||||||||||||||||||||||||||||||||||||||||||||||||||||||||||||||||||||||||||||||||||||||||||||||||||||||||||||||||||||||||||||||||||||||||||||||||||||||||||||||||||||||||||||||||||
| Income of Wages and Salaries | 17917 | 4.3 | |||||||||||||||||||||||||||||||||||||||||||||||||||||||||||||||||||||||||||||||||||||||||||||||||||||||||||||||||||||||||||||||||||||||||||||||||||||||||||||||||||||||||||||||||||||||||||||||||||||||||||||||||||||||||||
| Net Business Income | 5307 | 1.1 | |||||||||||||||||||||||||||||||||||||||||||||||||||||||||||||||||||||||||||||||||||||||||||||||||||||||||||||||||||||||||||||||||||||||||||||||||||||||||||||||||||||||||||||||||||||||||||||||||||||||||||||||||||||||||||
| Net Income from Property | 2791 | 6.6 | |||||||||||||||||||||||||||||||||||||||||||||||||||||||||||||||||||||||||||||||||||||||||||||||||||||||||||||||||||||||||||||||||||||||||||||||||||||||||||||||||||||||||||||||||||||||||||||||||||||||||||||||||||||||||||
| Net Income from Transfer | 6173 | 8.7 | |||||||||||||||||||||||||||||||||||||||||||||||||||||||||||||||||||||||||||||||||||||||||||||||||||||||||||||||||||||||||||||||||||||||||||||||||||||||||||||||||||||||||||||||||||||||||||||||||||||||||||||||||||||||||||
| Total Per Capita Income Nationwide Median | 27540 | 3.8 | |||||||||||||||||||||||||||||||||||||||||||||||||||||||||||||||||||||||||||||||||||||||||||||||||||||||||||||||||||||||||||||||||||||||||||||||||||||||||||||||||||||||||||||||||||||||||||||||||||||||||||||||||||||||||||
| Grouped by Permanent Residence |
|
| |||||||||||||||||||||||||||||||||||||||||||||||||||||||||||||||||||||||||||||||||||||||||||||||||||||||||||||||||||||||||||||||||||||||||||||||||||||||||||||||||||||||||||||||||||||||||||||||||||||||||||||||||||||||||||
| Urban Households | 40378 | 2.9 | |||||||||||||||||||||||||||||||||||||||||||||||||||||||||||||||||||||||||||||||||||||||||||||||||||||||||||||||||||||||||||||||||||||||||||||||||||||||||||||||||||||||||||||||||||||||||||||||||||||||||||||||||||||||||||
| Rural Households | 15204 | 5.7 | |||||||||||||||||||||||||||||||||||||||||||||||||||||||||||||||||||||||||||||||||||||||||||||||||||||||||||||||||||||||||||||||||||||||||||||||||||||||||||||||||||||||||||||||||||||||||||||||||||||||||||||||||||||||||||
| Total Per Capita Expenditure Nationwide | 21210 | -1.6(-4.0) | |||||||||||||||||||||||||||||||||||||||||||||||||||||||||||||||||||||||||||||||||||||||||||||||||||||||||||||||||||||||||||||||||||||||||||||||||||||||||||||||||||||||||||||||||||||||||||||||||||||||||||||||||||||||||||
| Grouped by Permanent Residence |
|
| |||||||||||||||||||||||||||||||||||||||||||||||||||||||||||||||||||||||||||||||||||||||||||||||||||||||||||||||||||||||||||||||||||||||||||||||||||||||||||||||||||||||||||||||||||||||||||||||||||||||||||||||||||||||||||
| Urban Households | 27007 | -3.8(-6.0) | |||||||||||||||||||||||||||||||||||||||||||||||||||||||||||||||||||||||||||||||||||||||||||||||||||||||||||||||||||||||||||||||||||||||||||||||||||||||||||||||||||||||||||||||||||||||||||||||||||||||||||||||||||||||||||
| Rural Households | 13713 | 2.9(-0.1) | |||||||||||||||||||||||||||||||||||||||||||||||||||||||||||||||||||||||||||||||||||||||||||||||||||||||||||||||||||||||||||||||||||||||||||||||||||||||||||||||||||||||||||||||||||||||||||||||||||||||||||||||||||||||||||
| Grouped by Consumption Category |
|
| |||||||||||||||||||||||||||||||||||||||||||||||||||||||||||||||||||||||||||||||||||||||||||||||||||||||||||||||||||||||||||||||||||||||||||||||||||||||||||||||||||||||||||||||||||||||||||||||||||||||||||||||||||||||||||
| Food, tobacco and liquor | 6397 | 5.1 | |||||||||||||||||||||||||||||||||||||||||||||||||||||||||||||||||||||||||||||||||||||||||||||||||||||||||||||||||||||||||||||||||||||||||||||||||||||||||||||||||||||||||||||||||||||||||||||||||||||||||||||||||||||||||||
| Clothing | 1238 | -7.5 | |||||||||||||||||||||||||||||||||||||||||||||||||||||||||||||||||||||||||||||||||||||||||||||||||||||||||||||||||||||||||||||||||||||||||||||||||||||||||||||||||||||||||||||||||||||||||||||||||||||||||||||||||||||||||||
| Residence | 5215 | 3.2 | |||||||||||||||||||||||||||||||||||||||||||||||||||||||||||||||||||||||||||||||||||||||||||||||||||||||||||||||||||||||||||||||||||||||||||||||||||||||||||||||||||||||||||||||||||||||||||||||||||||||||||||||||||||||||||
| Household facilities, articles and services | 1260 | -1.7 | |||||||||||||||||||||||||||||||||||||||||||||||||||||||||||||||||||||||||||||||||||||||||||||||||||||||||||||||||||||||||||||||||||||||||||||||||||||||||||||||||||||||||||||||||||||||||||||||||||||||||||||||||||||||||||
| Transportation and telecommunication | 2762 | -3.5 | |||||||||||||||||||||||||||||||||||||||||||||||||||||||||||||||||||||||||||||||||||||||||||||||||||||||||||||||||||||||||||||||||||||||||||||||||||||||||||||||||||||||||||||||||||||||||||||||||||||||||||||||||||||||||||
| Education, culture and recreation | 2032 | -19.1 | |||||||||||||||||||||||||||||||||||||||||||||||||||||||||||||||||||||||||||||||||||||||||||||||||||||||||||||||||||||||||||||||||||||||||||||||||||||||||||||||||||||||||||||||||||||||||||||||||||||||||||||||||||||||||||
| Health care and medical services | 1843 | -3.1 | |||||||||||||||||||||||||||||||||||||||||||||||||||||||||||||||||||||||||||||||||||||||||||||||||||||||||||||||||||||||||||||||||||||||||||||||||||||||||||||||||||||||||||||||||||||||||||||||||||||||||||||||||||||||||||
| Miscellaneous goods and services | 462 | -11.8 | |||||||||||||||||||||||||||||||||||||||||||||||||||||||||||||||||||||||||||||||||||||||||||||||||||||||||||||||||||||||||||||||||||||||||||||||||||||||||||||||||||||||||||||||||||||||||||||||||||||||||||||||||||||||||||
|
|
|
| |||||||||||||||||||||||||||||||||||||||||||||||||||||||||||||||||||||||||||||||||||||||||||||||||||||||||||||||||||||||||||||||||||||||||||||||||||||||||||||||||||||||||||||||||||||||||||||||||||||||||||||||||||||||||||
| Notes:
| |||||||||||||||||||||||||||||||||||||||||||||||||||||||||||||||||||||||||||||||||||||||||||||||||||||||||||||||||||||||||||||||||||||||||||||||||||||||||||||||||||||||||||||||||||||||||||||||||||||||||||||||||||||||||||||
| |||||||||||||||||||||||||||||||||||||||||||||||||||||||||||||||||||||||||||||||||||||||||||||||||||||||||||||||||||||||||||||||||||||||||||||||||||||||||||||||||||||||||||||||||||||||||||||||||||||||||||||||||||||||||||||
Annotations:
1. Explanatory Notes
Disposable income of Households refers to the sum of final consumption expenditure and savings that residents can use, that is, the income that residents can use for free disposal, including both cash income and physical income. According to the source of income, disposable income includes wage and salary income, net business income, net property income and net transfer income.
Consumer spending refers to all the expenditures that residents use to meet their daily needs, including both cash and physical consumption. Consumer spending includes eight categories: food, tobacco and alcohol, clothing, housing, daily necessities and services, transportation and communication, education, culture and recreation, medical care and other supplies and services.
The median of the nationwide per capita disposable income of households refers to the per capita disposable income of households which lies in the middle of all surveyed households ranked from low to high on the basis of per capita disposable income level.
The quarterly income and expenditure data do not include the income and consumption of the self-produced and self-used parts of households, and the annual income and expenditure data includes.
2.Survey Methods
The national and sub urban and rural households' income and expenditure data comes from the household income and expenditure and living conditions survey organized and implemented by the National Bureau of Statistics, which is released quarterly.
Using stratified, multi-stage, probability sampling method proportional to the size of population, the National Bureau of Statistics randomly selected 160000 households in 1800 counties (cities, districts) of 31 provinces (regions, cities) as survey households.
According to the unified system and method, the survey organizations directly under the National Bureau of statistics will organize the household to record and collect the data of households' income, expenditure, family operation, production and investment; meanwhile, according to the unified questionnaire, collect other surveys such as the employment of household members and labor force, the ownership of housing and durable consumer goods, and the enjoyment of households' basic social and public services. After the completion of data collection, the municipal and county survey organizations use unified methods and data processing procedures to code, review and input the original investigation data, and then directly transmit the basic household data to the National Bureau of Statistics for unified summary and calculation.