Energy production in December 2020
In December, the production of raw coal, natural gas and electric power in industries above designated size accelerated, while the production of crude oil slowed down slightly. In 2020, the output of raw coal for industries above designated size increased slightly, the growth rate of crude oil production accelerated, natural gas maintained rapid growth, and power production grew steadily.
I. Raw Coal, Crude Oil and Natural Gas Production and Relevant Information
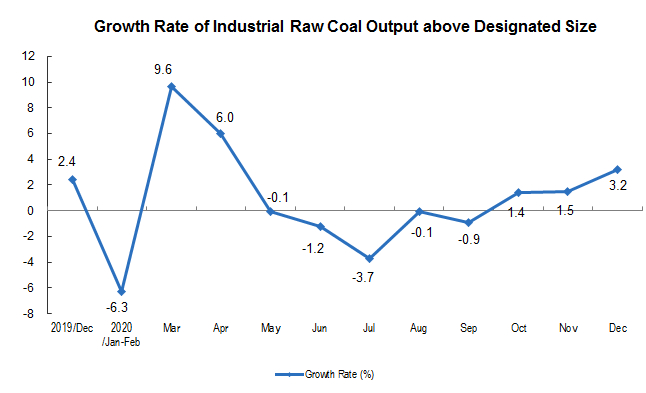
The production of raw coal accelerated. In December, 350 million tons of raw coal were produced, a year-on-year increase of 3.2 percent, 1.7 percentage points faster than that of last month; the daily output was 11.35 million tons, a month on month decrease of 230,000 tons. In 2020, 3.84 billion tons of raw coal were produced, an increase of 0.9 percent over the previous year.
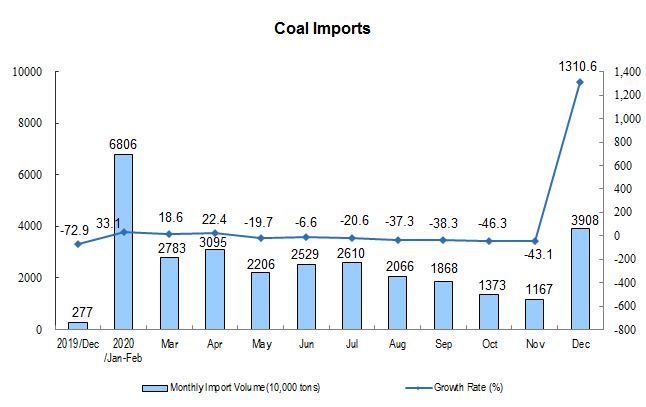
Coal imports increased. In December, 39.08 million tons of coal were imported, a month on month increase of 27.32 million tons. In 2020, 304 million tons of coal were imported, an increase of 1.5 percent over the previous year.
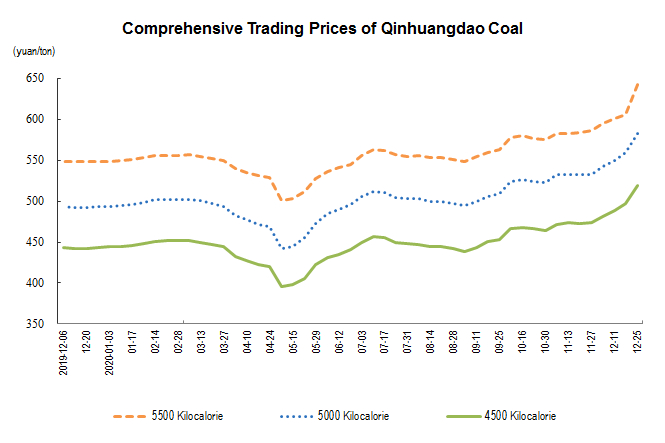
The comprehensive trading price of port coal rose. On December 25, the comprehensive transaction prices of 5500, 5000 and 4500 kcal steam coal in Qinhuangdao Port were 642, 583 and 519 yuan per ton respectively, up 56, 50 and 45 yuan respectively from November 27.
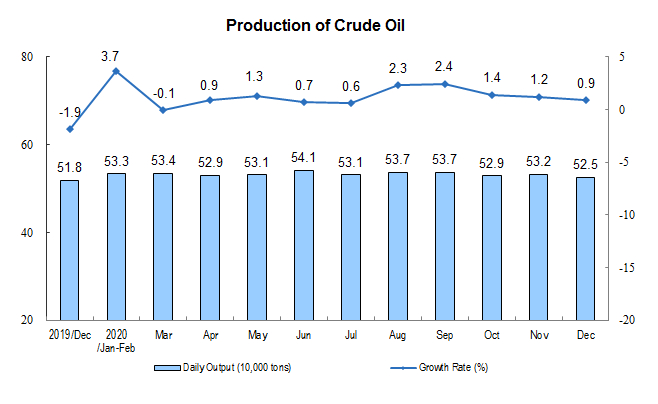
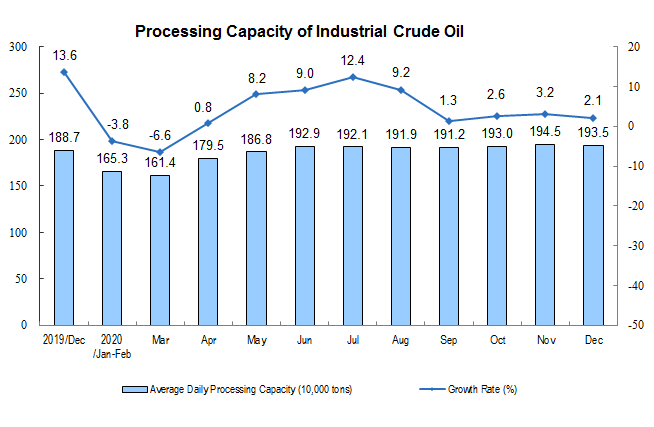
Crude oil production growth slowed slightly. In December, 16.27 million tons of crude oil were produced, with a year-on-year increase of 0.9 percent, and the growth rate was 0.3 percentage point lower than that of last month; the daily output was 525,000 tons, with a month on month decrease of 7000 tons. 60 million tons of crude oil were processed, an increase of 2.1 percent year on year, 1.1 percentage points lower than last month. In 2020, 195 million tons of crude oil were produced, an increase of 1.6 percent over the previous year, and 670 million tons of crude oil were processed, an increase of 3.0 percent.
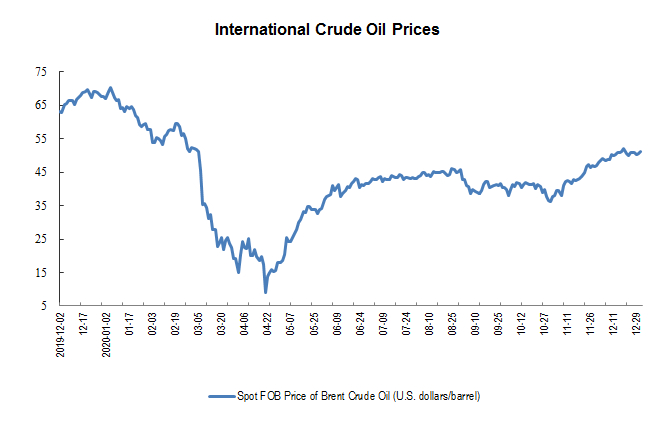
The decline in crude oil imports expanded, and international crude oil prices continued to rise. Imported crude oil was 38.47 million tons, a month on month decrease of 6.89 million tons, a year-on-year decrease of 15.4 percent, the decrease rate expanded 14.6 percentage points over the previous month; in 2020, imported crude oil was 540 million tons, an increase of 7.3 percent over the previous year. On December 31, the spot FOB price of Brent crude oil was 51.22 USD per barrel, up 9.4 percent from 46.84 USD per barrel on November 30.

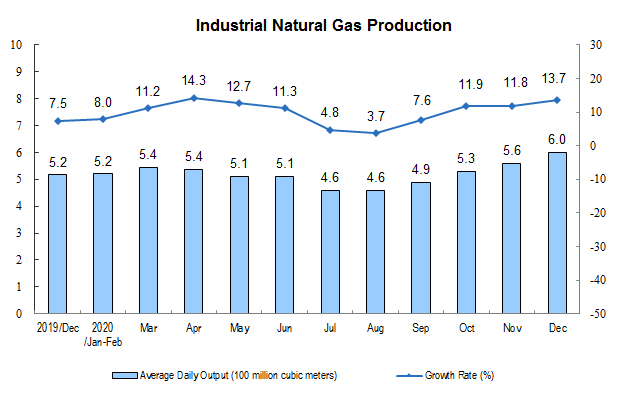
Natural gas production continued to grow rapidly. In December, 18.7 billion cubic meters of natural gas were produced, a year-on-year increase of 13.7 percent, 1.9 percentage points faster than last month; the daily production was 600 million cubic meters, a month on month increase of 40 million cubic meters. In 2020, 188.8 billion cubic meters of natural gas were produced, an increase of 9.8 percent over the previous year, with an increase of more than 10 billion cubic meters for four consecutive years.
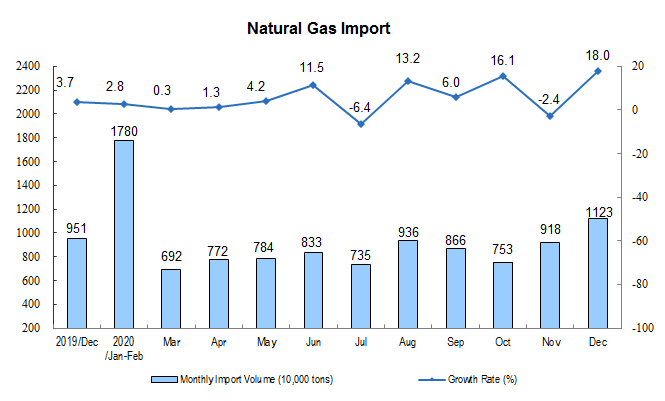
The import of natural gas increased from a decrease. In December, the import of natural gas was 11.23 million tons, a year-on-year increase of 18.0 percent, which was a decrease of 2.4 percent in last month. In 2020, 102 million tons of natural gas were imported, an increase of 5.3 percent over the previous year.
II. Electric Power Production
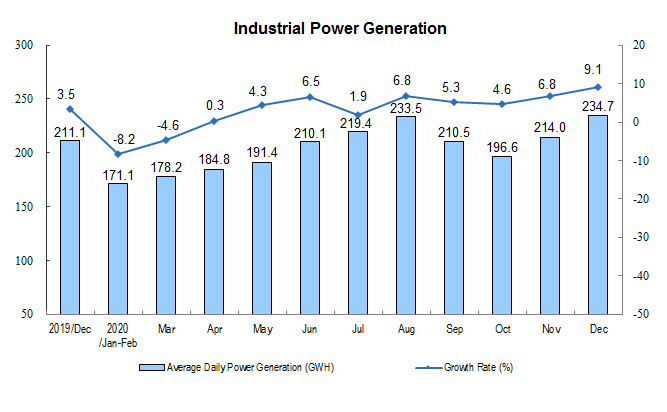
The growth rate of power production continued to accelerate. In December, the power generation was 727.7 billion kwh, up 9.1 percent year on year, 2.3 percentage points faster than last month; the daily average power generation was 23.47 billion kwh, up 2.07 billion kwh month on month. In 2020, the generating capacity was 7,417 billion kwh, an increase of 2.7 percent over the previous year.
In terms of varieties, the growth rate of thermal power, wind power and solar power generation accelerated in December, the growth rate of nuclear power turned from negative to positive, and the growth rate of hydropower was the same as last month. Among them, thermal power increased by 9.2 percent year on year, 2.6 percentage points faster than last month; wind power increased by 7.1 percent, 1.2 percentage points faster; solar power increased by 8.9 percent, 3.6 percentage points faster; nuclear power increased by 6.2 percent, which was a decrease of 0.8 percent in last month; hydropower increased by 11.3 percent.
Annotations:
1. Explanatory Notes
Average daily product output: It is calculated by dividing the total output of Industrial Enterprises above the designated size announced in that month by the calendar days of that month.
2. Statistical Coverage
The statistical caliber of the output data in the report is above the designated size of industry, and the statistical scope is industrial enterprises with annual main business income of more than 20 million yuan.
Because the scope of Industrial Enterprises above the designated size changes every year, in order to ensure that this year's data is comparable with the previous year's, the same period used to calculate the growth rate of various indicators such as product output is consistent with the statistical scope of enterprises in this period, and there is a caliber difference between the data released last year.
3. Data Source
Import data comes from the General Administration of Customs, of which January and February data are express data; coal price data comes from China Coal Market Network; crude oil price data comes from the United States Energy Information Agency (EIA).
4. Conversion relationship of natural gas units: 1 ton is equal to 1380 cubic meters.