Energy production in August of 2020
In August, the decline rate of raw coal production in industries above designated size was narrowed, the growth rate of crude oil and electric power production was accelerated, and the production of natural gas slowed down.
I. Raw Coal, Crude Oil and Natural Gas Production and Relevant Information
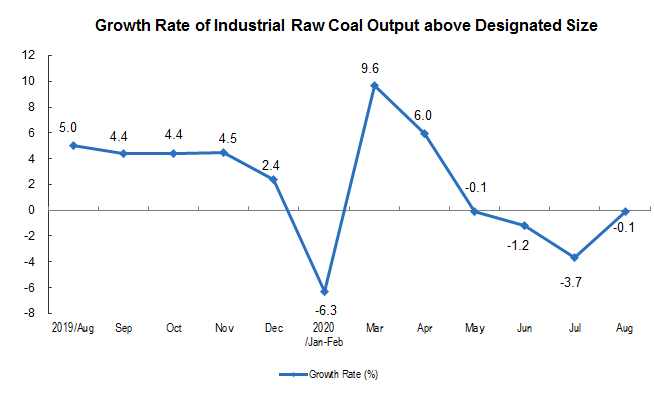
The decline of raw coal production was narrowed. In August, the production of raw coal was 330 million tons, a year-on-year decrease of 0.1 percent, and the decline rate was 3.6 percentage points lower than that of the previous month; the daily average output was 10.51 million tons, with an increase of 250 thousand tons on a month on month basis. From January to August, 2.45 billion tons of raw coal was produced, down 0.1 percent year on year.
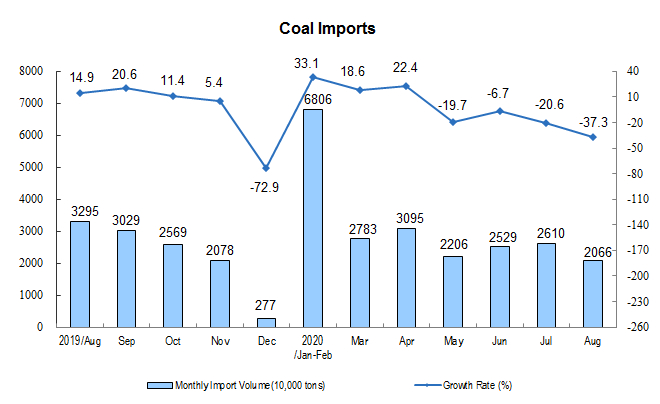
The decline of coal import continued to expand. In August, the import of coal was 20.66 million tons, a decrease of 5.44 million tons on a month on month basis, a year-on-year decrease of 37.3 percent, and the decrease rate expanded 16.7 percentage points over the previous month; from January to August, the import of coal was 220 million tons, with a year-on-year increase of 0.2 percent.
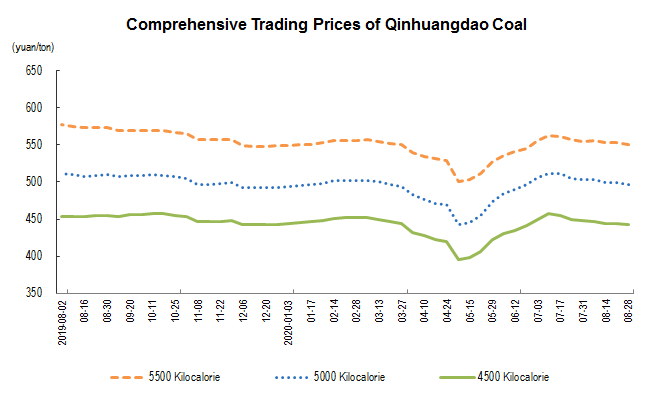
Port coal comprehensive trading price continued to fall. On August 28, the coal prices of 5500 kcal, 5000 kcal and 4500 kcal at Qinhuangdao Port were 551, 497 and 442 yuan per ton, respectively, down 4, 6 and 6 yuan from July 31.
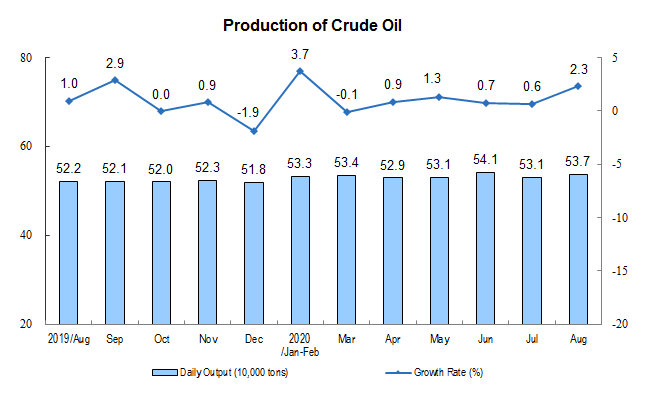
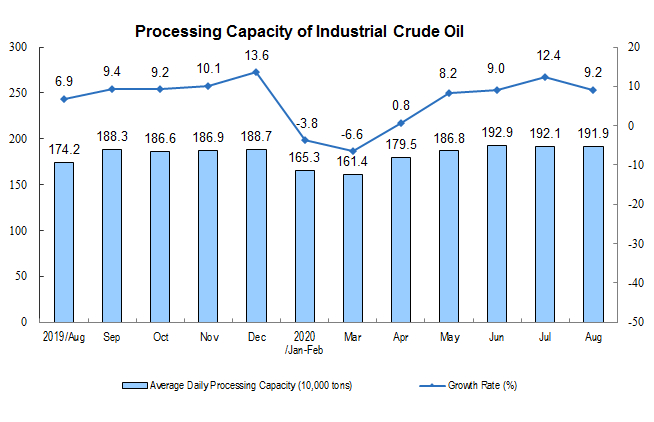
Crude oil production accelerated and processing slowed down. In August, 16.65 million tons of crude oil were produced, with a year-on-year increase of 2.3 percent, 1.7 percentage points faster than that of the previous month; and 59.47 million tons of crude oil were processed, with an increase of 9.2 percent, which was 3.2 percentage points slower than that of the previous month. From January to August, 130.15 million tons of crude oil were produced, with a year-on-year increase of 1.5 percent; and 440 million tons of crude oil were processed, with a year-on-year increase of 3.2 percent.
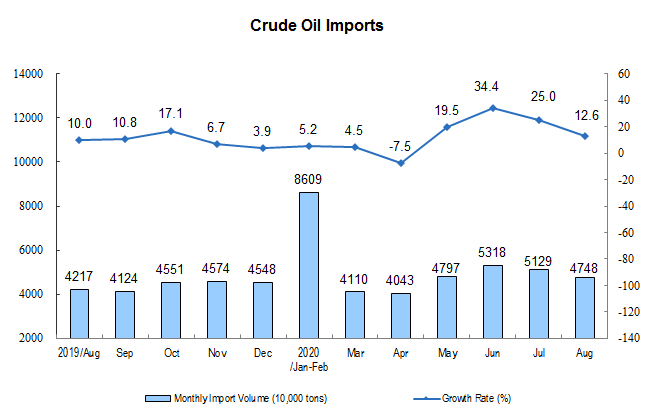
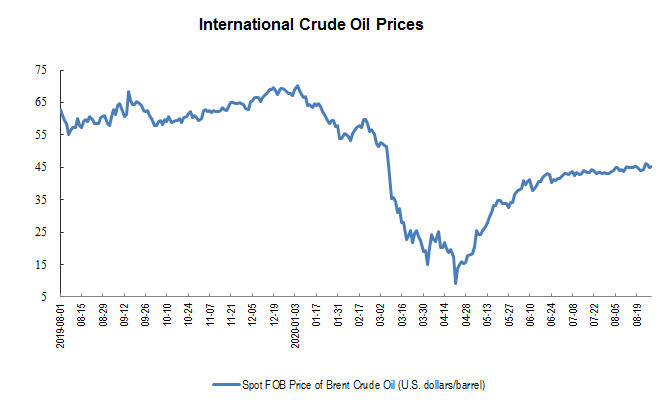
The growth rate of crude oil import fell and the international crude oil price rose slightly. In August, 47.48 million tons of crude oil were imported, up 12.6 percent year-on-year, and the growth rate was 12.4 percentage points lower than that of the previous month. From January to August, 370 million tons of crude oil were imported, up 12.1 percent year on year. On August 28, the spot FOB price of Brent crude oil was 45.22 USD per barrel, up 4.8 percent from 43.13 USD per barrel on July 31.
Natural gas production has slowed down. In August, 14.2 billion cubic meters of natural gas were produced, with a year-on-year increase of 3.7 percent, and the growth rate was 1.1 percentage points slower than that of the previous month; the average daily output was 460 million cubic meters, which was the same as last month. From January to August, 122.5 billion cubic meters of natural gas were produced, an increase of 8.8 percent year on year.
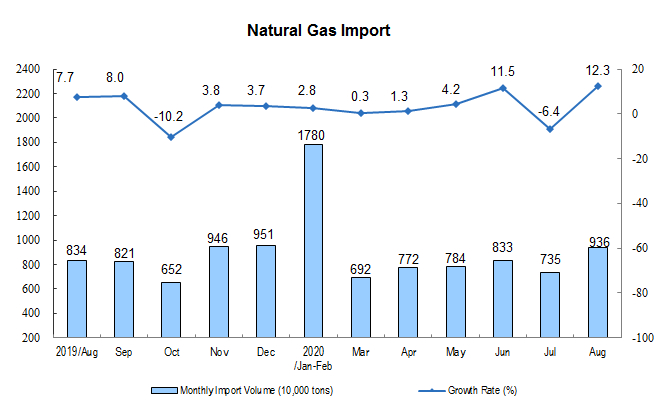
The growth rate of natural gas import has changed from negative to positive. In August, imports of natural gas were 9.36 million tons, up 12.3 percent year-on-year, down 6.4 percent in last month. From January to August, imported natural gas was 65.07 million tons, up 3.3 percent year on year.
II. Electric Power Production
Electric power production grew rapidly. In August, the power generation was 723.8 billion kwh, an increase of 6.8 percent year-on-year, 4.9 percentage points faster than that of the previous month; the average daily power generation was 23.35 billion kwh, with a month on month increase of 1.41 billion kwh. From January to August, power generation reached 4,772.8 billion kwh, up 0.3 percent year on year.
In terms of varieties, in August, the growth rate of thermal power and solar power generation turned from negative to positive, the growth rate of hydropower was accelerated, and that of nuclear power and wind power decreased. Among them, thermal power increased by 6.2 percent year-on-year, decreased by 0.7 percent in last month; solar power generation increased by 2.1 percent, decreased by 0.6 percent in last month; hydropower increased by 8.9 percent, the growth rate increased by 2.8 percentage points compared with the previous month; nuclear power increased by 0.9 percent, decreased by 5.8 percentage points; wind power increased by 18.7 percent, decreased by 4.5 percentage points.

Annotations:
1. Explanatory Notes
Average daily product output: It is calculated by dividing the total output of Industrial Enterprises above the designated size announced in that month by the calendar days of that month.
2. Statistical Coverage
The statistical caliber of the output data in the report is above the designated size of industry, and the statistical scope is industrial enterprises with annual main business income of more than 20 million yuan.
Because the scope of Industrial Enterprises above the designated size changes every year, in order to ensure that this year's data is comparable with the previous year's, the same period used to calculate the growth rate of various indicators such as product output is consistent with the statistical scope of enterprises in this period, and there is a caliber difference between the data released last year.
3. Data Source
Import data comes from the General Administration of Customs, of which January and February data are express data; coal price data comes from China Coal Market Network; crude oil price data comes from the United States Energy Information Agency (EIA).
4. Conversion relationship of natural gas units: 1 ton is equal to 1380 cubic meters.