Energy production in May of 2020
In May, the production of industrial raw coal above designated size changed from increasing to decreasing, the production of crude oil and electric power accelerated, and the production of natural gas maintained a rapid growth.
I. Raw Coal, Crude Oil and Natural Gas Production and Relevant Information
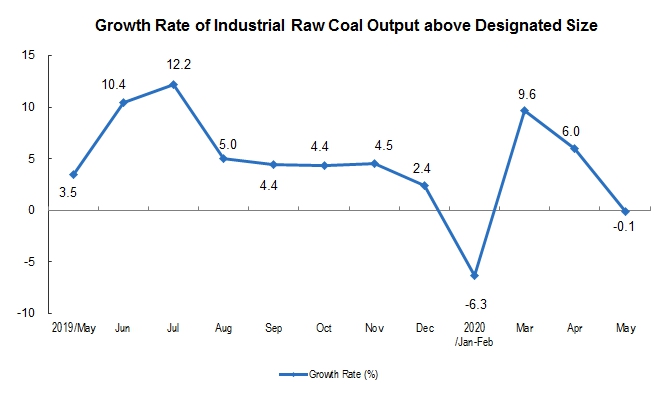
Raw coal production has changed from increasing to decreasing. In May, the production of raw coal reached 320 million tons, down 0.1 percent year-on-year, up 6.0 percent in last month; the daily average output was 10.29 million tons, down 450 thousand tons month on month. From January to May, 1.47 billion tons of raw coal was produced, an increase of 0.9 percent year on year.
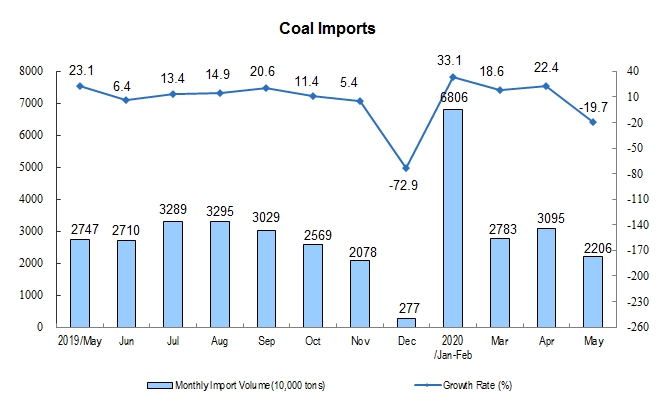
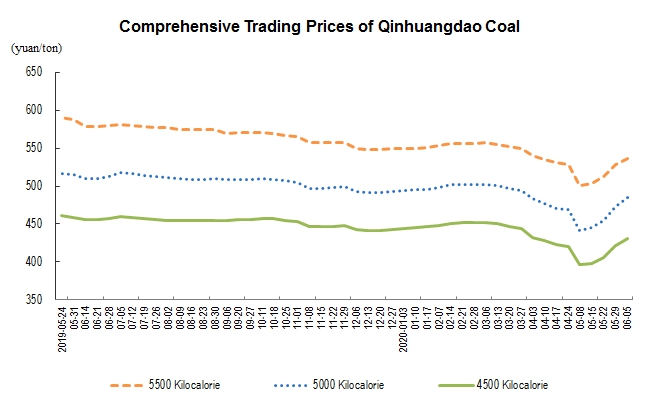
The import of coal fell sharply and the trading price of the port recovered. In May, imports of coal reached 22.06 million tons, a decrease of 8.89 million tons on a month on month basis, a year-on-year decrease of 19.7 percent; from January to May, imports of coal reached 149 million tons, a year-on-year increase of 16.8 percent. The comprehensive trading price of port coal stopped falling and recovered. On June 5, the price of 5500, 5000 and 4500 kcal coal in Qinhuangdao port was 536, 485 and 431 yuan per ton respectively, up 35, 43 and 35 yuan respectively from the lowest point in the year on May 8.
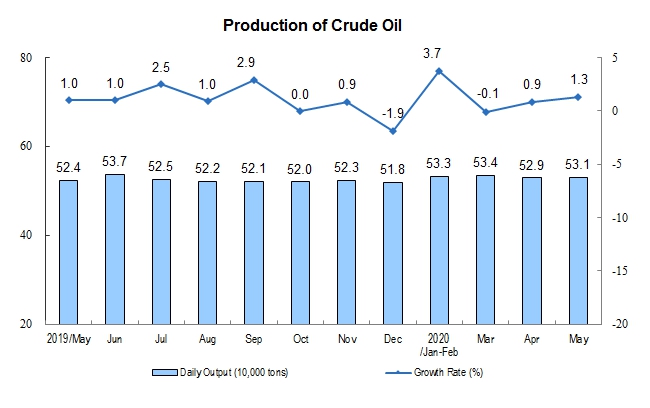
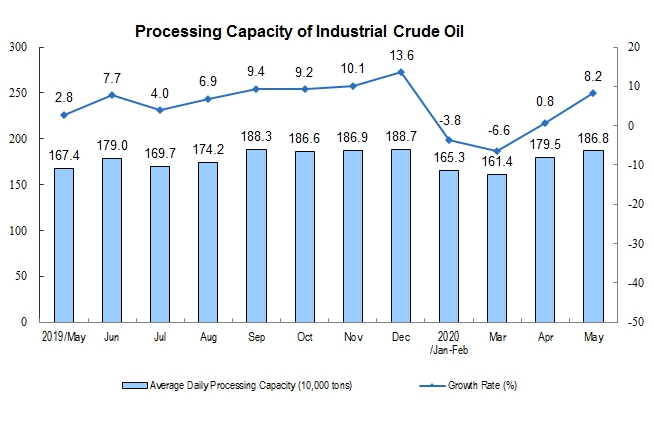
Crude oil production has been accelerated and processing volume has increased rapidly. In May, the production of crude oil reached 16.46 million tons, a year-on-year increase of 1.3 percent, an increase of 0.4 percentage point over the previous month; the processing of crude oil reached 57.9 million tons, up 8.2 percent, an increase of 7.4 percentage points over the previous month. From January to May, 80.9 million tons of crude oil were produced, up 1.9 percent year on year; 261.39 million tons of crude oil were processed, down 1.0 percent.
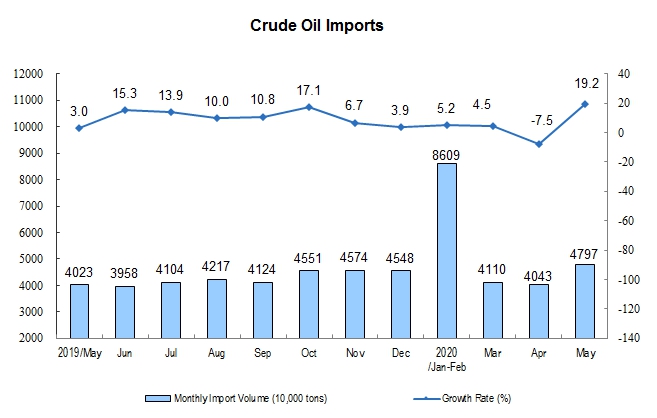
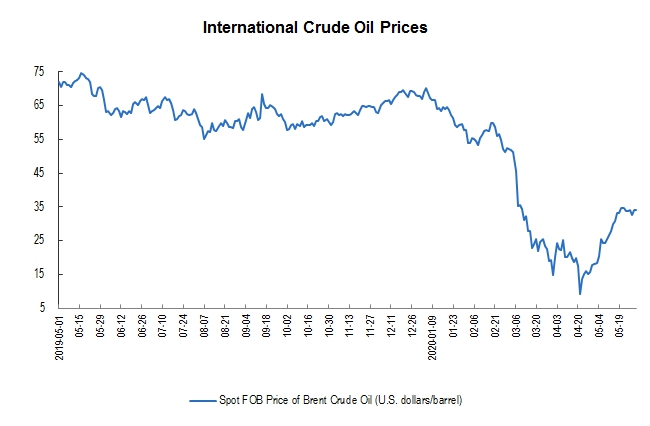
The import of crude oil changed from decline to increase, and the international crude oil price rose rapidly. In May, the import of crude oil reached 47.97 million tons, up 19.2 percent year on year, down 7.5 percent in last month. From January to May, imported crude oil was 215.58 million tons, up 5.2 percent year on year. The spot FOB price of Brent crude oil on May 29 was 34.15 USD per barrel, up 88.6 percent from 18.11 USD per barrel on April 30.
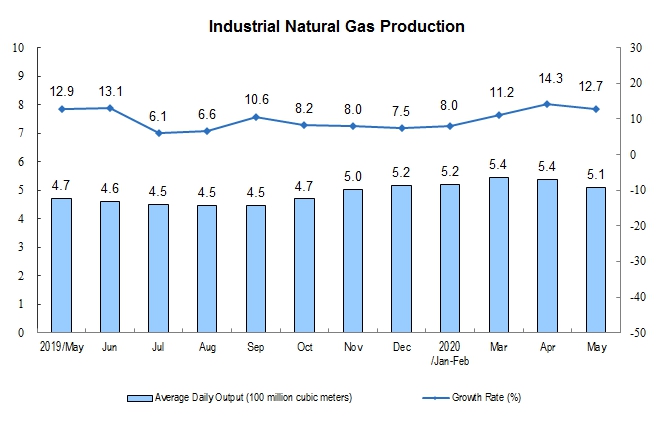
Natural gas production has maintained a rapid growth. In May, it produced 15.9 billion cubic meters of natural gas, up 12.7 percent year on year, down 1.6 percentage points from last month, with an average daily output of 510 million cubic meters. From January to May, 78.8 billion cubic meters of natural gas was produced, up 10.1 percent year on year.
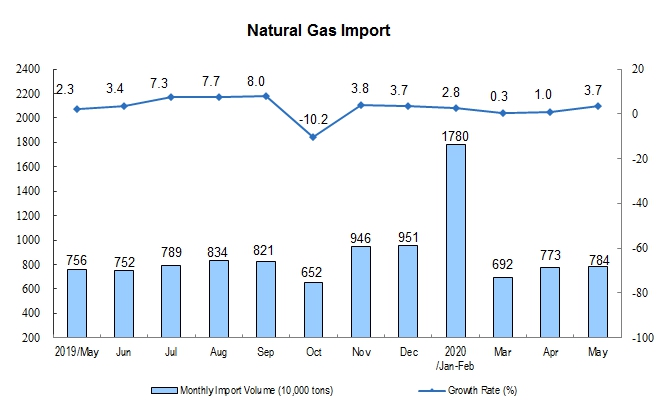
The import of natural gas increased steadily. In May, 7.84 million tons of natural gas were imported, up 3.7 percent year on year. From January to May, 40.12 million tons of natural gas were imported, up 1.9 percent year on year.
II. Electric Power Production
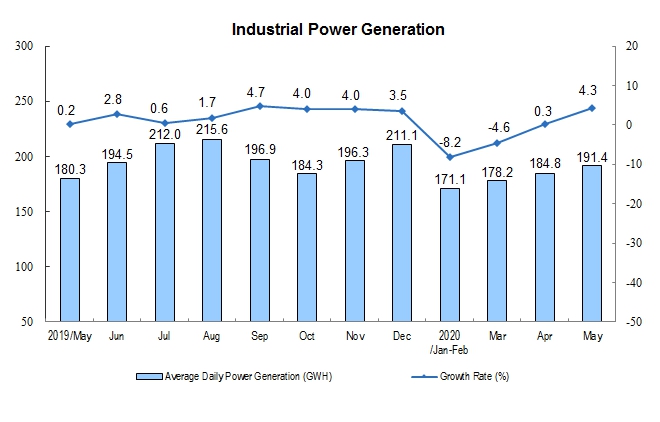
The production of electric power has been significantly accelerated. In May, the power generation was 593.2 billion kwh, up 4.3 percent year on year, 4.0 percentage points higher than last month. The average daily power generation was 19.14 billion kwh, an increase of 660 million kwh on a month on month basis. From January to May, the generating capacity was 2,732.5 billion kwh, down 3.1 percent year on year.
In terms of varieties, in May, the growth rate of thermal power, nuclear power and wind power increased significantly, the decline of hydropower expanded, and the growth rate of solar power fell. Among them, thermal power increased by 9.0 percent year-on-year, 7.8 percentage points faster than last month; nuclear power rose by 14.3 percent, 3.6 percentage points faster; wind power rose by 5.2 percent, 4.0 percentage points faster; hydropower rose by 16.5 percent, 7.3 percentage points higher than last month; solar power increased by 7.1 percent, 5.2 percentage points lower than last month.
Annotations:
1. Explanatory Notes
Average daily product output: It is calculated by dividing the total output of Industrial Enterprises above the designated size announced in that month by the calendar days of that month.
2. Statistical Coverage
The statistical caliber of the output data in the report is above the designated size of industry, and the statistical scope is industrial enterprises with annual main business income of more than 20 million yuan.
Because the scope of Industrial Enterprises above the designated size changes every year, in order to ensure that this year's data is comparable with the previous year's, the same period used to calculate the growth rate of various indicators such as product output is consistent with the statistical scope of enterprises in this period, and there is a caliber difference between the data released last year.
3. Data Source
Import data comes from the General Administration of Customs, of which January and February data are express data; coal price data comes from China Coal Market Network; crude oil price data comes from the United States Energy Information Agency (EIA).
4. Conversion relationship of natural gas units: 1 ton is equal to 1380 cubic meters.