Purchasing Managers Index for February 2020
Department of Service Statistics of NBS
China Federation of Logistics and Purchasing(CFLP)
Affected by novel coronavirus pneumonia in February 2020, the Purchasing Managers Index (PMI) of China has dropped significantly. But with the overall promotion of epidemic prevention and control and economic and social development by the CPC Central Committee and State Council, the recovery rate of enterprises was picking up rapidly, and production and operation activities were recovering in an orderly manner. As of February 25, 78.9 percent of the enterprises surveyed by purchasing managers in China had returned to work, of which 85.6 percent were large and medium-sized manufacturing enterprises.
1. Manufacturing Purchasing Managers Index
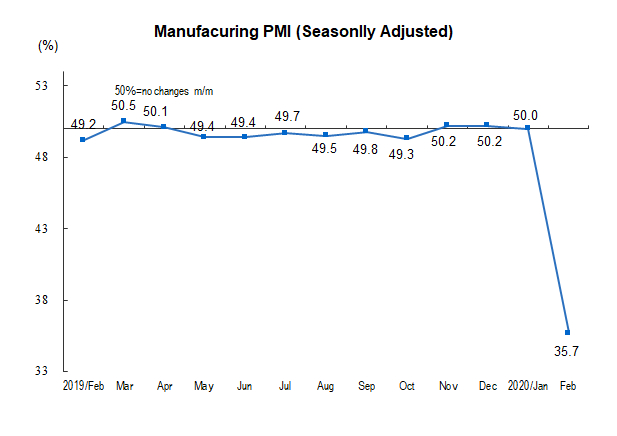
In February 2020, affected by the epidemic, China's manufacturing PMI was 35.7 percent, down 14.3 percentage points from last month.
In terms of enterprise scale, the PMI of large, medium and small enterprises was 36.3, 35.5 and 34.1 percent respectively, 14.1, 14.6 and 14.5 percentage points lower than that of last month.
According to the classification index, the five sub-indices composing PMI, were all below the threshold.
Production index was 27.8 percent, down by 23.5 percentage points from last month, indicating that the manufacturing production activity had slowed down.
New orders index was 29.3 percent, down by 22.1 percentage points from last month, indicating that the manufacturing market demand had declined.
Main raw materials inventory index was 33.9 percent, lower 13.2 percentage points than last month, indicating that the main raw material inventory of manufacturing industry had decreased.
The employment index was 31.8 percent, fell 15.7 percentage points than last month, indicating that the employment of manufacturing enterprises had decreased.
Supplier distribution time index was 32.1 percent, decreased by 17.8 percentage points than last month, indicating that the delivery time of raw material suppliers in manufacturing industry has slowed down.
| China's Manufacturing PMI (Seasonally Adjusted) | ||||||
| Unit: % | ||||||
|
| PMI |
| ||||
| Production Index | New Orders Index | Main Raw Materials Inventory Index | Employed Person Index | Supplier Delivery Time Index | ||
|
|
|
|
|
|
|
|
| 2019- February | 49.2 | 49.5 | 50.6 | 46.3 | 47.5 | 49.8 |
| March | 50.5 | 52.7 | 51.6 | 48.4 | 47.6 | 50.2 |
| April | 50.1 | 52.1 | 51.4 | 47.2 | 47.2 | 49.9 |
| May | 49.4 | 51.7 | 49.8 | 47.4 | 47.0 | 50.9 |
| June | 49.4 | 51.3 | 49.6 | 48.2 | 46.9 | 50.2 |
| July | 49.7 | 52.1 | 49.8 | 48.0 | 47.1 | 50.1 |
| August | 49.5 | 51.9 | 49.7 | 47.5 | 46.9 | 50.3 |
| September | 49.8 | 52.3 | 50.5 | 47.6 | 47.0 | 50.5 |
| October | 49.3 | 50.8 | 49.6 | 47.4 | 47.3 | 50.1 |
| November | 50.2 | 52.6 | 51.3 | 47.8 | 47.3 | 50.5 |
| December | 50.2 | 53.2 | 51.2 | 47.2 | 47.3 | 51.1 |
| 2020-January | 50.0 | 51.3 | 51.4 | 47.1 | 47.5 | 49.9 |
| February | 35.7 | 27.8 | 29.3 | 33.9 | 31.8 | 32.1 |
|
|
|
|
|
|
|
|
| Related Indicators of China's Manufacturing PMI (Seasonally Adjusted) | ||||||||
| Unit: % | ||||||||
|
| New Export Orders Index | Import Index | Purchase Quantity Index | Main Raw Material Purchase Price Index | Producer Price Index | Finished Goods Inventory Index | Open Orders Index | Production And Business Activities Expectation Index |
|
|
|
|
|
|
|
|
|
|
| 2019- February | 45.2 | 44.8 | 48.3 | 51.9 | 48.5 | 46.4 | 43.6 | 56.2 |
| March | 47.1 | 48.7 | 51.2 | 53.5 | 51.4 | 47.0 | 46.4 | 56.8 |
| April | 49.2 | 49.7 | 51.1 | 53.1 | 52.0 | 46.5 | 44.0 | 56.5 |
| May | 46.5 | 47.1 | 50.5 | 51.8 | 49.0 | 48.1 | 44.3 | 54.5 |
| June | 46.3 | 46.8 | 49.7 | 49.0 | 45.4 | 48.1 | 44.5 | 53.4 |
| July | 46.9 | 47.4 | 50.4 | 50.7 | 46.9 | 47.0 | 44.7 | 53.6 |
| August | 47.2 | 46.7 | 49.3 | 48.6 | 46.7 | 47.8 | 44.8 | 53.3 |
| September | 48.2 | 47.1 | 50.4 | 52.2 | 49.9 | 47.1 | 44.7 | 54.4 |
| October | 47.0 | 46.9 | 49.8 | 50.4 | 48.0 | 46.7 | 44.9 | 54.2 |
| November | 48.8 | 49.8 | 51.0 | 49.0 | 47.3 | 46.4 | 44.9 | 54.9 |
| December | 50.3 | 49.9 | 51.3 | 51.8 | 49.2 | 45.6 | 45.0 | 54.4 |
| 2020-January | 48.7 | 49.0 | 51.6 | 53.8 | 49.0 | 46.0 | 46.3 | 57.9 |
| February | 28.7 | 31.9 | 29.3 | 51.4 | 44.3 | 46.1 | 35.6 | 41.8 |
|
|
|
|
|
|
|
|
|
|
2. Non-manufacturing purchasing managers index
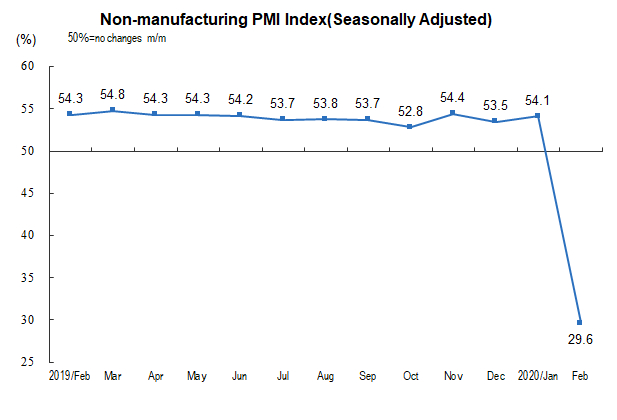
In February 2020, China’s non-manufacturing business activities index was 29.6 percent, down by 24.5 percentage points than the previous month, indicating that the overall of non-manufacturing industry had declined affected by the epidemic.
In terms of different industry, the service business activity index was 30.1%, down 23.0 percentage points from last month. By industry categories, only the business activity index of monetary and financial services and capital market services remained in the expansion range, and the total business volume continued to grow; that of telecommunication, radio, television, satellite transmission services and Internet software information technology services were in the contraction range, but significantly higher than the overall service industry. The construction business activity index was 26.6 percent, down 33.1 percentage points from last month.
The new orders index was 26.5 percent, down by 24.1 percentage points from the previous month, indicating that the market demands in non-manufacturing industry has decreased. In terms of different industry, the new order index of service industry was 27.0 percent, down by 23.0 percentage points over last month; that of construction industry was 23.8 percent, fell 30.0 percentage points from last month.
The input price index was 49.3 percent, 4.0 percentage points lower than that of last month, indicating that the overall input price used by non-manufacturing enterprises for business activities was decreasing. In terms of different industry, the service industry input price index was 48.4 percent, 4.4 percentage points lower than last month; the construction industry input price index was 54.0 percent, 2.1 percentage points lower than last month.
The sales price index was 43.9%, down by 6.6 percentage points from last month, which was below the threshold, indicating that the overall sales price of non-manufacturing industry changed from rising to falling. By industry, the sales price index of service industry was 42.7 percent, down by 7.5 percentage points from last month; the sales price index of construction industry was 50.9 percent, down by 1.3 percentage points from last month.
The employment index was 37.9 percent, down by 10.7 percentage points from the previous month. In terms of industry, the employment index of service industry was 38.9 percent, down by 8.5 percentage points from last month; that of construction industry was 32.3 percent, fell 23.0 percentage points from last month.
Business activities expectation index was 40.0 percent, lower 19.6 percentage points than last month, indicating that the confidence of non-manufacturing enterprises in the future market development had declined during the epidemic period. In terms of industry, the business activities expectation index in service industry was 39.7 percent, 19.0 percentage points lower than last month; that of construction industry was 41.8 percent, 22.6 percentage points lower than last month.
| Main Indices of China's Non-manufacturing PMI (Seasonally Adjusted) | ||||||
| Unit: % | ||||||
|
| Non-manufacturing PMI | New Orders Index | Input Price Index | Sales Price Index | Employment Index | Business Activities Expectation Index |
|
|
|
|
|
|
|
|
| 2019- February | 54.3 | 50.7 | 52.7 | 50.1 | 48.6 | 61.5 |
| March | 54.8 | 52.5 | 52.5 | 51.0 | 48.7 | 61.1 |
| April | 54.3 | 50.8 | 53.0 | 50.5 | 48.7 | 60.3 |
| May | 54.3 | 50.3 | 52.2 | 49.9 | 48.3 | 60.2 |
| June | 54.2 | 51.5 | 51.5 | 49.7 | 48.2 | 60.6 |
| July | 53.7 | 50.4 | 52.9 | 50.6 | 48.7 | 59.8 |
| August | 53.8 | 50.1 | 50.8 | 49.1 | 48.9 | 60.4 |
| September | 53.7 | 50.5 | 52.8 | 50.0 | 48.2 | 59.7 |
| October | 52.8 | 49.4 | 51.3 | 48.9 | 48.2 | 60.7 |
| November | 54.4 | 51.3 | 53.2 | 51.3 | 49.0 | 61.0 |
| December | 53.5 | 50.4 | 52.4 | 50.3 | 48.3 | 59.1 |
| 2020-January | 54.1 | 50.6 | 53.3 | 50.5 | 48.6 | 59.6 |
| February | 29.6 | 26.5 | 49.3 | 43.9 | 37.9 | 40.0 |
|
|
|
|
|
|
|
|
| Other Indices of China's Non-manufacturing PMI (Seasonally Adjusted) | ||||
| Unit: % | ||||
|
| Foreign New Orders Index | Unfilled Orders Index | Stock Index | Supplier Delivery Time Index |
|
|
|
|
|
|
| 2019- February | 51.6 | 44.9 | 47.1 | 51.4 |
| March | 49.9 | 45.0 | 47.1 | 51.5 |
| April | 49.2 | 44.2 | 46.3 | 51.5 |
| May | 47.9 | 44.4 | 46.6 | 51.7 |
| June | 48.5 | 44.4 | 46.0 | 51.4 |
| July | 48.4 | 44.4 | 45.5 | 52.0 |
| August | 50.3 | 44.1 | 47.0 | 52.1 |
| September | 47.3 | 43.9 | 46.4 | 51.9 |
| October | 48.1 | 44.0 | 46.7 | 51.8 |
| November | 48.8 | 44.6 | 47.4 | 52.1 |
| December | 47.8 | 44.5 | 47.2 | 52.2 |
| 2020-January | 48.4 | 43.6 | 47.2 | 52.1 |
| February | 26.8 | 35.2 | 39.3 | 28.3 |
|
|
|
|
|
|
3. Composite PMI Output Index
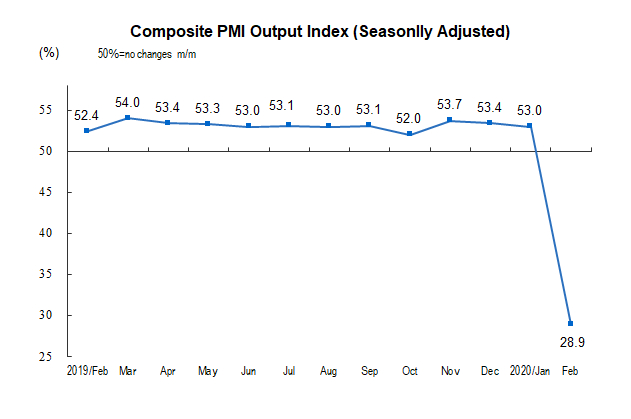
In February 2020, the comprehensive PMI output index was 28.9 percent, 24.1 percentage points lower than that of last month, indicating that the overall production and operation activities of Chinese enterprises had slowed down.
Annotations:
1. Explanatory Notes
Purchasing Managers Index (PMI) is an index summarized and compiled through the results of the monthly survey of enterprises purchasing managers. It covers every links of the enterprises, including purchasing, production, logistics, and so on. It is one of the leading indices which was commonly adopted by international society to monitor the macroeconomic trends, and played an important role in forecasting and monitoring. The Composite PMI Output Index, belonging to the PMI indicator system, is a composite index reflecting the changes in the output in current period of the entire industry (manufacturing and non-manufacturing industries). The threshold of PMI is usually using 50 percent as the cut-off point for economic performance. If PMI above 50 percent, it reflects the overall economy is expanding; if less than 50 percent, it reflects the overall economy is in recession.
2.Statistical Coverage
The survey involves 31 divisions of manufacturing industry in the “Industrial Classification for National Economic Activities” (GB/T4754-2017), and 3000 samples, as well as 37 divisions of non-manufacturing industry, and 4000 samples.
3. Survey Methods
PPS (Probability Proportional to Size) sampling method was adopted in purchasing managers’ survey. Using the divisions of the manufacturing or non-manufacturing industry as the selecting strata, the sample size of each division is proportional to its proportion of the value-added of the division to the total value-added of the manufacturing or non-manufacturing industry. Within the stratum, the samples are selected according to the probabilities proportional to their principal business revenues of the enterprises.
The survey was organized and conducted by staff members of survey offices, monthly through Online Reporting System of NBS by sending survey questionnaires to the purchasing managers of the selected enterprises.
4. Calculation Methods
(1) Calculation Methods of Sub-indices.
The indicator system of manufacturing purchasing managers’ survey covers 13 sub-indices such as production, new orders, export orders, existing orders, finished goods inventory, purchase, import, purchase price, producer price, raw materials inventory, employees, suppliers, delivery time, production and business activities expectation. Non-manufacturing purchasing managers survey involves 10 questions on production, new orders (business required), export, existing orders, finished goods inventory, intermediate input price, subscription price, employees, suppliers delivery time, and business activities expectation. The indicator system of non-manufacturing purchasing managers’ survey covers 10 sub-indices such as business activities, new orders, new export orders, existing orders, finished goods inventory, intermediate input price, subscription price, employees, suppliers delivery time, and business activities expectation. Sub-indices adopt diffusion index calculation method, i.e. percentage of positive answers in number of enterprises plus half of the percentage in the same answers. Due to the lack of synthesis of non-manufacturing integrated PMI index, the international society often used business activity index to reflect the overall changes in non-manufacturing economic development.
(2) Calculation Methods of Manufacturing PMI.
Manufacturing PMI was calculated according to five diffusion indices (group indices) and their weights. 5 group indices and their weights are determined in accordance with their leading impact on the economy. Specifically, new orders index weighted 30 percent; production index weighted 25 percent; employees index weighted 20 percent; supplier delivery time index weighted 15 percent; raw materials inventory index weighted 10 percent. Of which, the supplier delivery time index is a converse index, and contrary calculation is needed when combines it into PMI.
(3) Calculation Methods of Composite PMI Output Index.
Composite PMI Output Index was calculated by weighted summation of the manufacturing output index and non-manufacturing business activity index. Their weights are determined by the proportion manufacturing and non-manufacturing industries in GDP. This index will be released since February 2018.
5. Seasonal adjustment
The purchasing managers’ survey is a monthly survey, the data of the survey fluctuates very much for the influences of seasonal factors. The released PMI composite index and sub-indices are seasonally adjusted data.