Statistical Communiqué of the People's Republic of China on the 2019 National Economic and Social Development
Statistical Communiqué of the People's Republic of China on the 2019 National Economic and Social Development[1]
National Bureau of Statistics of China
February 28, 2020
In 2019, in the face of mounting risks and challenges both at home and abroad, under the strong leadership of the Central Committee of the Communist Party of China with Comrade Xi Jinping as the core and the guidance of Xi Jinping Thought on Socialism with Chinese Characteristics for a New Era, all regions and departments fully implemented the spirit of the 19th National Congress of the Communist Party of China and the second, third and fourth plenary sessions of the 19th Central Committee of the Communist Party of China, followed the decisions and arrangements made by the CPC Central Committee and the State Council, adhered to the general working guideline of making progress while maintaining stability and the new development philosophy, committed to the high-quality development, focused on the supply-side structural reform, deepened the reform and opened wider to the world, and unswervingly fought the “Three Critical Battles”. All regions and departments took coordinated steps to ensure steady economic growth, advance reform, make structural adjustment, improve living standards, guard against risks and ensure stability, and endeavored to maintain stability in areas of employment, financial sector, foreign trade, foreign investment, domestic investment and market expectation. As a result, the economy was generally stable, the development reached a new stage with steadily raised quality, people’s well-being was further enhanced, social undertakings were prospering, and the ecological environment was generally improved. The key indicators of the Thirteenth Five-Year Plan progressed as expected, and major breakthroughs were made in the completion of building a moderately prosperous society in all respects.
I. General Outlook
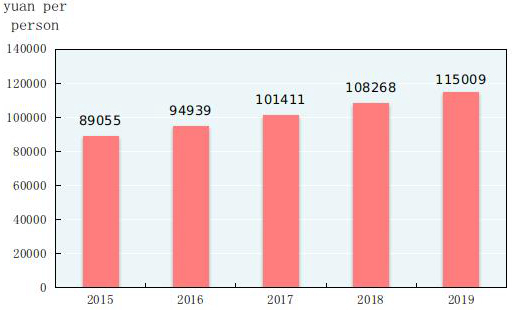
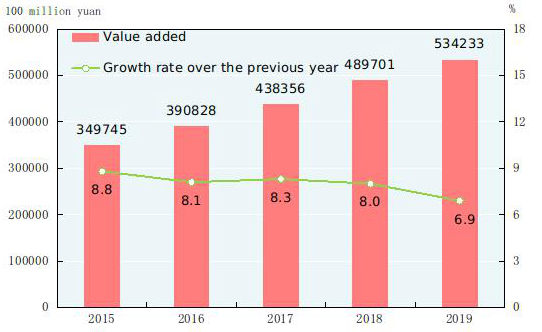
According to preliminary estimation, the gross domestic product (GDP)[2] in 2019 was 99,086.5 billion yuan, up by 6.1 percent over the previous year. Of this total, the value added of the primary industry was 7,046.7 billion yuan, up by 3.1 percent, that of the secondary industry was 38,616.5 billion yuan, up by 5.7 percent and that of the tertiary industry was 53,423.3 billion yuan, up by 6.9 percent. The value added of the primary industry accounted for 7.1 percent of the GDP; that of the secondary industry accounted for 39.0 percent; and that of the tertiary industry accounted for 53.9 percent. The contribution of the final consumption expenditure to GDP was 57.8 percent, that of the gross capital formation 31.2 percent and that of the net exports of goods and services 11.0 percent. The per capita GDP in 2019 was 70,892 yuan, up by 5.7 percent compared with the previous year. The gross national income[3] in 2019 was 98,845.8 billion yuan, up by 6.2 percent over the previous year. The national energy consumption per 10,000 yuan worth of GDP[4] went down by 2.6 percent over 2018, and the overall labor productivity[5] reached 115,009 yuan per person in 2019, up by 6.2 percent over the previous year.
Figure 1: Gross Domestic Product and Growth Rates
2015-2019
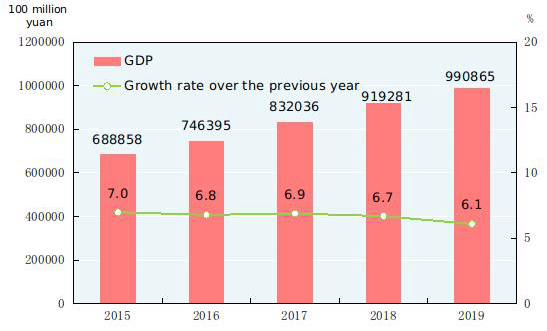
Figure 2: Shares of the Three Industries’ Value Added of GDP 2015-2019[6]
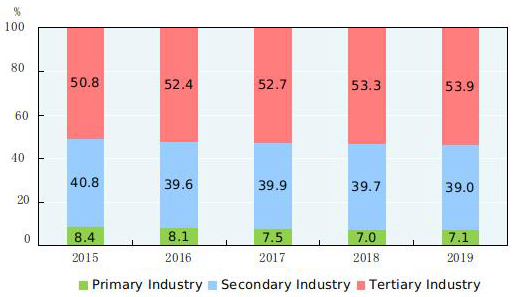
Figure 3: Changes of Energy Consumption per 10,000 Yuan Worth of GDP 2015-2019[7]
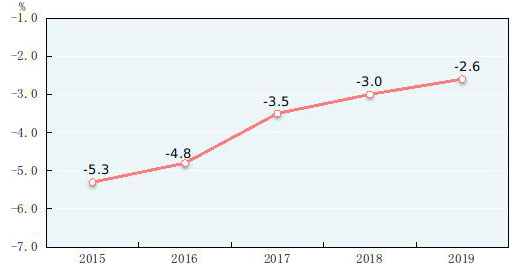
Figure 4: The Overall Labor Productivity 2015-2019[8]
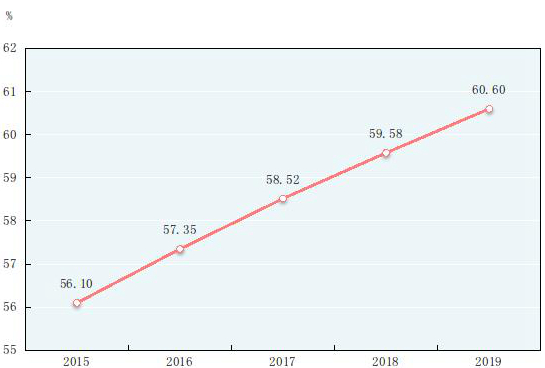
By the end of 2019, the total number of Chinese population at the mainland reached 1,400.05 million, an increase of 4.67 million over that at the end of 2018. Of this total, urban permanent residents numbered 848.43 million, accounting for 60.60 percent of the total population (the urbanization rate of permanent residents), 1.02 percentage points higher than that at the end of 2018. The urbanization rate of population with household registration was 44.38 percent, 1.01 percentage points higher than that at the end of 2018. The year 2019 saw 14.65 million births, a crude birth rate of 10.48 per thousand, and 9.98 million deaths, a crude death rate of 7.14 per thousand. The natural growth rate was 3.34 per thousand. The number of population who lived in places other than their household registration areas[9] reached 280 million, of which 236 million were floating population[10].
Table 1: Population and Its Composition by the End of 2019
| Item | Population at Year-end (10,000 persons) | Proportion (%) |
| National Total | 140005 | 100.0 |
| Of which: Urban | 84843 | 60.60 |
| Rural | 55162 | 39.40 |
| Of which: Male | 71527 | 51.1 |
| Female | 68478 | 48.9 |
| Of which: Aged 0-15 (under the age of 16)[11] | 24977 | 17.8 |
| Aged 16-59 (under the age of 60) | 89640 | 64.0 |
| Aged 60 and above | 25388 | 18.1 |
| Of which: Aged 65 and above | 17603 | 12.6 |
Figure 5: Urbanization Rates of Permanent Residents 2015-2019
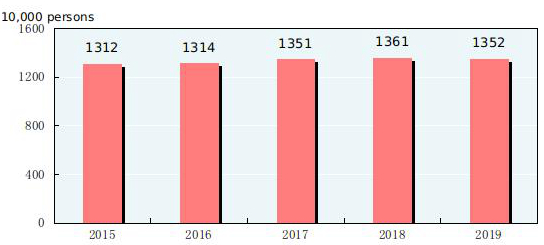
At the end of 2019, the number of employed people in China was 774.71 million, and that in urban areas was 442.47 million, accounting for 57.1 percent of the national employed people, 1.1 percentage points higher than the end of 2018. The newly increased employed people in urban areas numbered 13.52 million, 90 thousand less than the previous year. The surveyed urban unemployment rate was 5.2 percent at the year end, and the registered urban unemployment rate was 3.6 percent. The total number of migrant workers[12] in 2019 was 290.77 million, up by 0.8 percent over that of 2018. Specifically, the number of migrant workers who left their hometowns and worked in other places was 174.25 million, up by 0.9 percent, and those who worked in their own localities reached 116.52 million, up by 0.7 percent.
Figure 6:Newly Increased Employed People in Urban Areas 2015-2019
The consumer prices in 2019 went up by 2.9 percent over the previous year. The producer prices for industrial products went down by 0.3 percent and the purchasing prices for industrial producers down by 0.7 percent. The prices for investment in fixed assets increased by 2.6 percent. The producer prices for farm products[13] increased by 14.5 percent. In December, out of the 70 large-and-medium-sized cities, 68 cities experienced a year-on-year rise in sales prices of new commercial residential buildings and two cities experienced a decline.
Figure 7:Monthly Changes of Consumer Prices in 2019
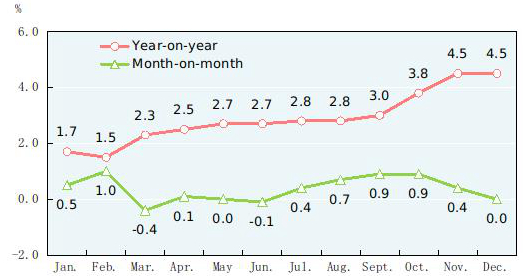
Table 2: Changes of Consumer Prices in 2019
Unit: %
Item | National Average | | |
| Urban | Rural | ||
| General level of consumer prices | 2.9 | 2.8 | 3.2 |
| Of which: Food, tobacco and liquor | 7.0 | 6.7 | 7.9 |
| Clothing | 1.6 | 1.7 | 1.2 |
| Residence[14] | 1.4 | 1.3 | 1.5 |
| Household facilities, articles and services | 0.9 | 0.9 | 0.8 |
| Transportation and telecommunication | -1.7 | -1.8 | -1.4 |
| Education, culture and recreation | 2.2 | 2.3 | 1.9 |
| Health care and medical services | 2.4 | 2.5 | 2.1 |
| Miscellaneous goods and services | 3.4 | 3.5 | 3.1 |
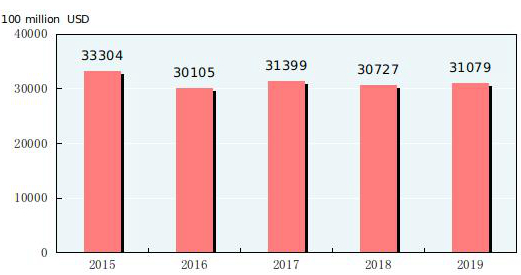
At the end of 2019, China’s foreign exchange reserves reached 3,107.9 billion US dollars, an increase of 35.2 billion US dollars compared with that at the end of 2018. The average exchange rate of the year was 6.8985 RMB to 1 USD dollar, depreciated by 4.1 percent over that of 2018.
Figure 8:Year-end China's Foreign Exchange Reserves 2015-2019
The supply-side structural reform was further pushed forward. The national industrial capacity utilization rate[15] in 2019 reached 76.6 percent, 0.1 percentage points higher than the previous year. Specifically, the capacity utilization rate for smelting and pressing of ferrous metals was 80.0 percent, 2.0 percentage points higher than the previous year and that for mining and washing of coal was 70.6 percent, the same as the previous year. The floor space of commercial buildings for sale at the end of 2019 was 498.21 million square meters, 25.93 million square meters less than that at the end of 2018. Of this total, the floor space of the commercial residential buildings for sale was 224.73 million square meters, 26.18 million square meters less. The asset-liability ratio of the industrial enterprises above the designated size at the end of 2019 was 56.6 percent, 0.2 percentage points[16] lower than that at the end of 2018. In 2019, the fixed assets investment (excluding rural households) in education and in ecological protection and treatment of environmental pollution went up by 17.7 percent and 37.2 percent respectively compared with 2018. The reform to streamline administration, delegate powers and improve regulation and services continued to deepen and the vitality of micro entities were enhanced. In 2019, there were 23.77 million market entities newly registered with 20 thousand enterprises newly registered per day on average. At the end of the year, the market entities totaled 120 million. In 2019, the taxes and fees cut reached 2.3 trillion yuan.
The new driving forces continued to grow. Among the industries above the designated size, the value added of the strategic emerging industries[17] grew by 8.4 percent over the previous year and the value added of the high technology manufacturing industry[18] was up by 8.8 percent, accounting for 14.4 percent of that of all industrial enterprises above the designated size. The value added for the manufacture of equipment[19] was up by 6.7 percent, accounting for 32.5 percent of that of all industrial enterprises above the designated size. Among the service enterprises above the designated size[20], the business revenue of the strategic emerging service industries[21] went up by 12.7 percent compared with the previous year. In 2019, the investment in high technology industries[22] increased by 17.3 percent over the previous year; the investment in industrial technological transformation[23] increased by 9.8 percent. In 2019, the production of service robots reached 3.46 million, up by 38.9 percent compared with the previous year. In 2019, the online retail sales[24] reached 10,632.4 billion yuan, an increase of 16.5 percent over the previous year on a comparable basis.
Regional coordinated development was pushed forward steadily. By regions[25], in 2019, the gross domestic product in the eastern areas was 51,116.1 billion yuan, an increase of 6.2 percent compared with the previous year; the central areas, 21,873.8 billion yuan, up by 7.3 percent; the western areas, 20,518.5 billion yuan, up by 6.7 percent; and the northeastern areas, 5,024.9 billion yuan, up by 4.5 percent. In 2019, the gross domestic product in Beijing-Tianjin-Hebei Region reached 8,458.0 billion yuan, up by 6.1 percent over the previous year; that in the Yangtze River Economic Belt, 45,780.5 billion yuan, up by 6.9 percent; and that in the Yangtze River Delta, 23,725.3 billion yuan, up by 6.4 percent.
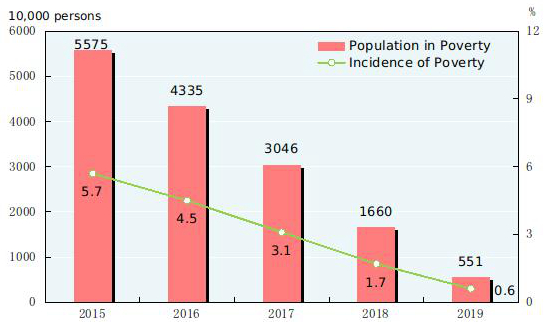
Significant achievement has been made in poverty alleviation. By the rural poverty line of annual per capita income of 2,300 yuan (at 2010 constant prices), the number of rural population living in poverty at the end of 2019 was 5.51 million, 11.09 million[26] less compared with that at the end of 2018, and the incidence of poverty[27] was 0.6 percent, 1.1 percentage points lower than that of the previous year. In 2019, the per capita disposable income of rural residents in impoverished areas[28] was 11,567 yuan, an increase of 11.5 percent over 2018, or a real increase of 8.0 percent after deducting price factors.
Figure 9: Year-end Rural Population in Poverty and Incidence of Poverty 2015-2019
II. Agriculture
In 2019, the sown area of grain was 116.06 million hectares, a drop of 0.97 million hectares compared with that in 2018. Of this total, the sown area of wheat was 23.73 million hectares, a decrease of 0.54 million hectares; the sown area of rice was 29.69 million hectares, a decrease of 0.50 million hectares; the sown area of corn was 41.28 million hectares, a decrease of 0.85 million hectares. The sown area of cotton was 3.34 million hectares, a decrease of 20 thousand hectares. The sown area of oil-bearing crops was 12.93 million hectares, up by 60 thousand hectares; the sown area of sugar crops was 1.62 million hectares, down by 10 thousand hectares.
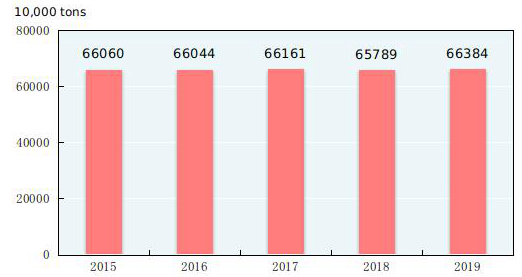
The total output of grain in 2019 was 663.84 million tons, an increase of 5.94 million tons over the previous year, or up by 0.9 percent. Of this total, the output of summer crops was 141.60 million tons, up by 2.0 percent, and that of the early rice was 26.27 million tons, down by 8.1 percent. The output of autumn grain was 495.97 million tons, up by 1.1 percent. The output of cereal was 613.68 million tons, up by 0.6 percent over 2018, among which the output of rice was 209.61 million tons, down by 1.2 percent; that of wheat was 133.59 million tons, up by 1.6 percent; and that of corn was 260.77 million tons, up by 1.4 percent.
Figure 10: Output of Grain 2015-2019
In 2019, the output of cotton was 5.89 million tons, a decrease of 3.5 percent over the previous year, that of oil-bearing crops was 34.95 million tons, up by 1.8 percent, that of sugar crops was 122.04 million tons, up by 2.2 percent, and that of tea was 2.80 million tons, up by 7.2 percent.
The total output of pork, beef, mutton and poultry in 2019 was 76.49 million tons, down by 10.2 percent over the previous year. Of this total, the output of pork was 42.55 million tons, down by 21.3 percent; that of beef was 6.67 million tons, up by 3.6 percent; that of mutton was 4.88 million tons, up by 2.6 percent; and that of poultry was 22.39 million tons, up by 12.3 percent. The total output of eggs was 33.09 million tons, up by 5.8 percent. The production of milk was 32.01 million tons, up by 4.1 percent. At the end of the year, 310.41 million pigs were registered in the total stocks, down by 27.5 percent, and 544.19 million pigs were slaughtered, down by 21.6 percent.
The total output of aquatic products in 2019 was 64.50 million tons, down by 0.1 percent over the previous year. Of this total, the output of cultured aquatic products was 50.50 million tons, up by 1.0 percent; and that of fished aquatic products was 14.00 million tons, down by 5.0 percent.
The total production of timber for 2019 reached 90.28 million cubic meters, up by 2.5 percent over the previous year.
In 2019, over 0.27 million hectares of farmland were newly equipped with irrigation systems and another 1.46 million hectares of farmland was newly equipped with water-saving irrigation systems.
III. Industry and Construction
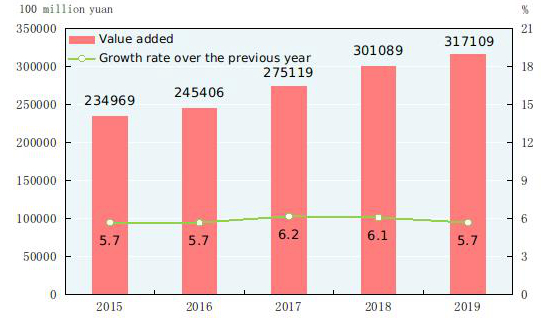
In 2019, the total value added of the industrial sector was 31,710.9 billion yuan, up by 5.7 percent over the previous year. The value added of industrial enterprises above the designated size increased by 5.7 percent. Of the industrial enterprises above the designated size, in terms of ownership, the value added of the state-holding enterprises grew by 4.8 percent, that of the share-holding enterprises up by 6.8 percent, that of the enterprises funded by foreign investors and investors from Hong Kong, Macao and Taiwan up by 2.0 percent and that of private enterprises up by 7.7 percent. In terms of sectors, the value added of the mining industry was up by 5.0 percent, that of manufacturing up by 6.0 percent and that of production and supply of electricity, heat power, gas and water up by 7.0 percent.
Figure 11: Value Added and Growth Rates of Industrial Enterprises 2015-2019[29]
In 2019, of the industrial enterprises above the designated size, the value added for processing of food from agricultural and sideline products was up by 1.9 percent over the previous year; for textile industry up by 1.3 percent; for manufacture of raw chemical materials and chemical products up by 4.7 percent; for manufacture of non-metallic mineral products up by 8.9 percent; for smelting and pressing of ferrous metals up by 9.9 percent; for manufacture of general purpose machinery up by 4.3 percent; for manufacture of special purpose machinery up by 6.9 percent; for manufacture of automobiles up by 1.8 percent; for manufacture of electrical machinery and apparatus up by 10.7 percent; for manufacture of computers, communication equipment and other electronic equipment up by 9.3 percent; for production and supply of electricity and heat power up by 6.5 percent.
Table 3: Output of Major Industrial Products and Growth Rates in 2019[30]
| Product | Unit | Output | Increase over 2018 (%) |
| Yarn | 10000 tons | 2892.1 | -6.1 |
| Cloth | 100 million meters | 575.6 | -17.6 |
| Chemical fiber | 10000 tons | 5952.8 | 9.9 |
| Refined sugar (final product) | 10000 tons | 1389.4 | 15.9 |
| Cigarettes | 100 million | 23642.5 | 1.1 |
| Color TV sets | 10000 | 18999.1 | -3.5 |
| Of which: LCD TV sets | 10000 | 18689.7 | -1.5 |
| Household refrigerators | 10000 | 7904.3 | 6.3 |
| Air conditioners | 10000 | 21866.2 | 4.3 |
| Primary energy output | 100 million tons of standard coal equivalent | 39.7 | 5.1 |
| Coal | 100 million tons | 38.5 | 4.0 |
| Crude petroleum oil | 10000 tons | 19101.4 | 0.9 |
| Natural gas | 100 million cubic meters | 1761.7 | 10.0 |
| Electricity | 100 million kilowatt-hours | 75034.3 | 4.7 |
| Of which: Thermal power[31] | 100 million kilowatt-hours | 52201.5 | 2.4 |
| Hydropower | 100 million kilowatt-hours | 13044.4 | 5.9 |
| Nuclear-power | 100 million kilowatt-hours | 3483.5 | 18.3 |
| Crude steel | 10000 tons | 99634.2 | 7.2 |
| Rolled steel[32] | 10000 tons | 120477.4 | 6.3 |
| Ten kinds of nonferrous metals | 10000 tons | 5866.0 | 2.2 |
| Of which: Refined copper (copper) | 10000 tons | 978.4 | 5.5 |
| Aluminum electrolyze | 10000 tons | 3504.4 | -2.2 |
| Cement | 100 million tons | 23.5 | 4.9 |
| Sulfuric acid (100%) | 10000 tons | 8935.7 | -1.3 |
| Caustic soda (100%) | 10000 tons | 3464.4 | -0.3 |
| Ethylene | 10000 tons | 2052.3 | 10.2 |
| Chemical fertilizers (100 percent equivalent) | 10000 tons | 5731.2 | 6.1 |
| Power generation equipment | 10000 kilowatts | 9274.1 | -14.9 |
| Motor vehicles | 10000 | 2552.8 | -8.3 |
| Of which: Basic passenger cars (cars) | 10000 | 1018.2 | -16.4 |
| Sport utility vehicles (SUVs) | 10000 | 876.0 | -3.6 |
| Large and medium tractors | 10000 | 27.8 | 5.9 |
| Integrated circuits | 100 million pieces | 2018.2 | 8.9 |
| Program-controlled switchboards | 10000 lines | 790.5 | -23.7 |
| Mobile telephones | 10000 | 170100.6 | -5.5 |
| Micro computer equipment | 10000 | 34163.2 | 8.2 |
| Industrial robots | 10000 sets | 17.7 | -3.1 |
By the end of 2019, the installed power generation capacity was 2,010.66 million kilowatts, up by 5.8 percent over that at the end of 2018, among which[33] the installed thermal power generation capacity was 1,190.55 million kilowatts, up by 4.1 percent; the installed hydropower generation capacity was 356.40 million kilowatts, up by 1.1 percent; the installed nuclear power generation capacity was 48.74 million kilowatts, up by 9.1 percent. The installed grid-connected wind power generation capacity was 210.05 million kilowatts, up by 14.0 percent and the installed grid-connected solar power generation capacity was 204.68 million kilowatts, up by 17.4 percent.
In 2019, the profits made by industrial enterprises above the designated size were 6,199.6 billion yuan, down by 3.3 percent[34] over the previous year. By ownership, the profits of state-holding enterprises were 1,635.6 billion yuan, down by 12.0 percent over the previous year; those of share-holding enterprises were 4,528.4 billion yuan, down by 2.9 percent; those of enterprises funded by foreign investors or investors from Hong Kong, Macao and Taiwan were 1,558.0 billion yuan, down by 3.6 percent; and those of private enterprises were 1,818.2 billion yuan, up by 2.2 percent. In terms of different sectors, the profits of mining were 527.5 billion yuan, up by 1.7 percent over the previous year; those of manufacturing were 5,190.4 billion yuan, down by 5.2 percent; and those of the production and supply of electricity, heat power, gas and water were 481.6 billion yuan, up by 15.4 percent. In 2019, the cost for per-hundred-yuan business revenue of the industrial enterprises above the designated size was 84.08 yuan, or 0.18 yuan more than that of 2018; the profit rate of the business revenue was 5.86 percent, down by 0.43 percentage points.
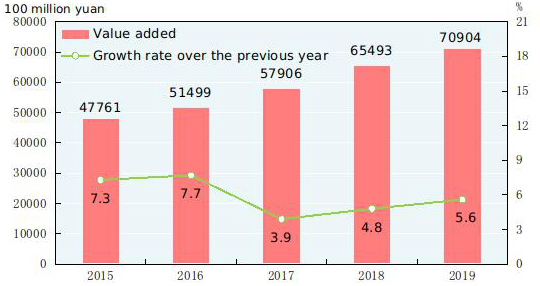
In 2019, the value added of construction enterprises in China was 7,090.4 billion yuan, up by 5.6 percent over the previous year. The profits made by construction enterprises qualified for general contracts and specialized contracts reached 838.1 billion yuan, up by 5.1 percent over the previous year, of which the profits made by state-holding enterprises were 258.5 billion yuan, up by 14.5 percent.
Figure 12: Value Added and Growth Rates of Construction Industry 2015-2019[35]
IV. Service Sector
In 2019, the value added of the wholesale and retail trades was 9,584.6 billion yuan, up by 5.7 percent over the previous year; that of transport, storage and post was 4,280.2 billion yuan, up by 7.1 percent; that of hotels and catering services was 1,804.0 billion yuan, up by 6.3 percent; that of financial intermediation was 7,707.7 billion yuan, up by 7.2 percent; that of real estate was 6,963.1 billion yuan, up by 3.0 percent; that of information transmission, software and information technology services was 3,269.0 billion yuan, up by 18.7 percent; and that of leasing and business services was 3,293.3 billion yuan, up by 8.7 percent. In 2019, the business revenue of service enterprises above the designated size grew by 9.4 percent over the previous year, and the operating profits grew by 5.4 percent.
Figure 13: Value Added and Growth Rates of Service Sector 2015-2019[36]
The total freight traffic in 2019 reached 47.1 billion tons in 2019. The freight flows were 19,929.0 billion ton-kilometers. The volume of freight handled by ports[37] throughout the year totaled 14.0 billion tons, up by 5.7 percent over the previous year, of which the freight for foreign trade was 4.3 billion tons, up by 4.7 percent. Container shipping of ports reached 261.07 million standard containers, up by 4.4 percent.
Table 4: Freight Traffic by All Means of Transportation and Growth Rates in 2019[38]
| Item | Unit | Volume | Increase over 2018(%) |
| Total freight traffic | 100 million tons | 470.6 | — |
| Railways | 100 million tons | 43.2 | 7.2 |
| Highways | 100 million tons | 343.5 | — |
| Waterways | 100 million tons | 74.7 | 6.3 |
| Civil aviation | 10 000 tons | 753.2 | 2.0 |
| Pipelines | 100 million tons | 9.1 | 1.8 |
| Freight flows | 100 million ton-kilometers | 199289.5 | — |
| Railways | 100 million ton-kilometers | 30074.7 | 4.4 |
| Highways | 100 million ton-kilometers | 59636.4 | — |
| Waterways | 100 million ton-kilometers | 103963.0 | 5.0 |
| Civil aviation | 100 million ton-kilometers | 263.2 | 0.3 |
| Pipelines | 100 million ton-kilometers | 5352.2 | 1.0 |
In 2019, the total passenger traffic[39] reached 17.6 billion person-times, down by 1.9 percent over 2018, and the passenger flows were 3,534.9 billion person-kilometers, up by 3.3 percent.
Table 5: Passenger Traffic by All Means of Transportation and Growth Rates in 2019
| Item | Unit | Volume | Increase over 2018 (%) |
| Total passenger traffic | 100 million person-times | 176.0 | -1.9 |
| Railways | 100 million person-times | 36.6 | 8.4 |
| Highways | 100 million person-times | 130.1 | -4.8 |
| Waterways | 100 million person-times | 2.7 | -2.6 |
| Civil aviation | 100 million person-times | 6.6 | 7.9 |
| Passenger flows | 100 million person-kilometers | 35349.1 | 3.3 |
| Railways | 100 million person-kilometers | 14706.6 | 4.0 |
| Highways | 100 million person-kilometers | 8857.1 | -4.6 |
| Waterways | 100 million person-kilometers | 80.2 | 0.8 |
| Civil aviation | 100 million person-kilometers | 11705.1 | 9.3 |
The total number of motor vehicles for civilian use reached 261.50 million (including 7.62 million tri-wheel motor vehicles and low-speed trucks) by the end of 2019, up by 21.22 million over that at the end of 2018, of which the privately-owned vehicles numbered 226.35 million, an increase of 19.05 million. The total number of cars for civilian use was 146.44 million, an increase of 11.93 million, of which the privately-owned cars numbered 137.01 million, an increase of 11.12 million.
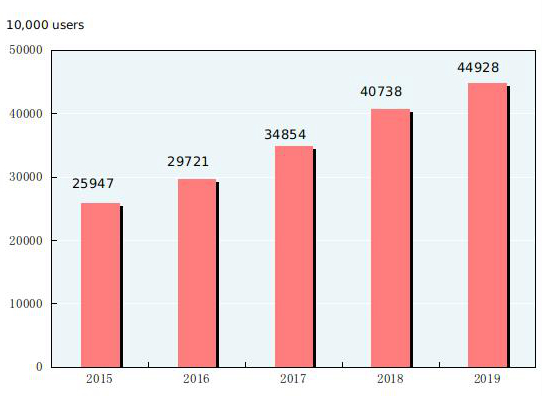
The turnover of post services[40] totaled 1,623.0 billion yuan, up by 31.5 percent over the previous year. In 2019, the number of mail delivery was 2.17 billion; that of parcel delivery was 20 million; and that of express delivery was 63.52 billion with a revenue reaching 749.8 billion yuan. The turnover of telecommunication services[41] totaled 10,678.9 billion yuan, up by 62.9 percent over the previous year. By the end of 2019, there were 1,792.38 million phone subscribers in China, 1,601.34 million of which were mobile phone subscribers. Mobile phone coverage rose to 114.4 sets per 100 persons. The number of fixed broadband internet users[42] reached 449.28 million, an increase of 41.90 million over the end of the previous year. Of this total, fixed fiber-optic broadband internet users[43] amounted to 417.40 million, an increase of 49.07 million. The mobile internet traffic in 2019 was 122.0 billion gigabytes, up by 71.6 percent over the previous year. Software revenue from software and information technology services industry[44] in 2019 was 7,176.8 billion yuan, up by 15.4 percent over 2018 on a comparable basis.
Figure 14: Express Delivery and Growth Rates 2015-2019
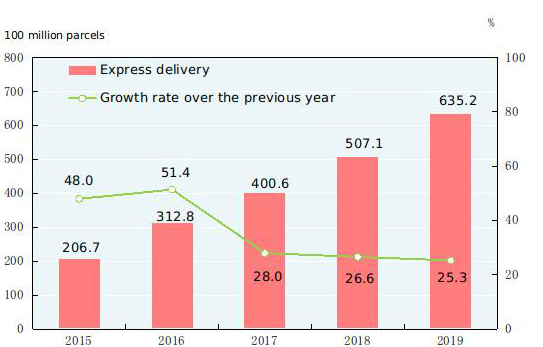
Figure 15: Year-end Number of Fixed Broadband Internet Users
2015-2019
V. Domestic Trade
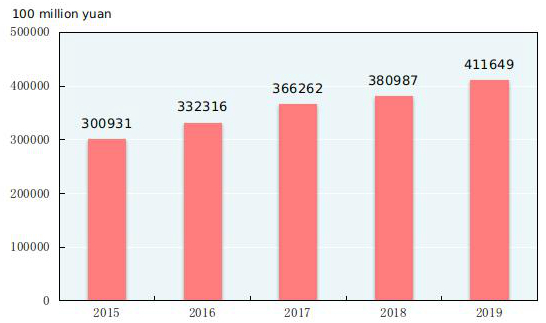
In 2019, the total retail sales of consumer goods reached 41,164.9 billion yuan, a growth of 8.0 percent over the previous year. An analysis on different areas showed that the retail sales of consumer goods in urban areas stood at 35,131.7 billion yuan, up by 7.9 percent, and that in rural areas reached 6,033.2 billion yuan, up by 9.0 percent. Grouped by consumption patterns, the retail sales of commodities was 36,492.8 billion yuan, up by 7.9 percent, and that of catering industry was 4,672.1 billion yuan, up by 9.4 percent.
Figure 16: Total Retail Sales of Consumer Goods 2015-2019
Of the total retail sales of commodities by enterprises above the designated size, the year-on-year growth of retail sales for grain, oil and food went up by 10.2 percent; beverage up by 10.4 percent; tobacco and liquor up by 7.4 percent; clothes, shoes, hats and textiles up by 2.9 percent; cosmetics up by 12.6 percent; gold, silver and jewelry up by 0.4 percent; daily necessities up by 13.9 percent; household appliances and audio-video equipment up by 5.6 percent; traditional Chinese and western medicines up by 9.0 percent; cultural and office appliances up by 3.3 percent; furniture up by 5.1 percent; telecommunication equipment up by 8.5 percent; building and decoration materials up by 2.8 percent; petroleum and petroleum products up by 1.2 percent; and motor vehicles down by 0.8 percent.
In 2019, the online retail sales of physical goods were 8,523.9 billion yuan, up by 19.5 percent over the previous year on a comparable basis, accounting for 20.7 percent of the total retail sales of consumer goods, or 2.3 percentage points higher than that of 2018.
VI. Investment in Fixed Assets
The total investment in fixed assets[45] of the country in 2019 was 56,087.4 billion yuan, up by 5.1 percent over the previous year. Of the total, the investment in fixed assets (excluding rural households) was 55,147.8 billion yuan, up by 5.4 percent. By regions[46], the investment in eastern areas was up by 4.1 percent over the previous year, central areas up by 9.5 percent, western areas up by 5.6 percent, and northeastern areas down by 3.0 percent.
In the investment in fixed assets (excluding rural households), the investment in the primary industry was 1,263.3 billion yuan, up by 0.6 percent over the previous year; that in the secondary industry was 16,307.0 billion yuan, up by 3.2 percent; and that in the tertiary industry was 37,577.5 billion yuan, up by 6.5 percent. The private investment in fixed assets[47] was 31,115.9 billion yuan, up by 4.7 percent. The investment in infrastructure[48] saw an increase of 3.8 percent. The investment in the six major high energy consuming industries grew by 4.7 percent.
Figure 17: Shares of Investment in Fixed Assets of the Three Industries (Excluding Rural Households) in 2019
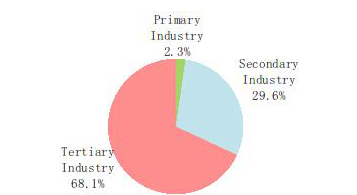
Table 6: Growth Rates of Investment in Fixed Assets (Excluding Rural Households) by Sectors in 2019
| Sector | Increase over 2018 (%) | Sector | Increase over 2018 (%) |
| Total | 5.4 | Financial Intermediation | 10.4 |
| Agriculture, Forestry, Animal Husbandry and Fishery | 0.7 | Real Estate[49] | 9.1 |
| Mining | 24.1 | Leasing and Business Services | 15.8 |
| Manufacturing | 3.1 | Scientific Research and Technical Services | 17.9 |
| Production and Supply of Electricity, Heat Power, Gas and Water | 4.5 | Water Conservancy, Environment and Public Facilities Management | 2.9 |
| Construction | -19.8 | Services to Households, Repair and Other Services | -9.1 |
| Wholesale and Retail Trades | -15.9 | Education | 17.7 |
| Transport, Storage and Post | 3.4 | Health and Social Service | 5.3 |
| Hotels and Catering Services | -1.2 | Culture, Sports and Entertainment | 13.9 |
| Information Transmission, Software and Information Technology Services | 8.6 | Public Management, Social Security and Social Organizations | -15.6 |
Table 7: Newly Increased Production and Operation Capacity through Fixed Assets Investment in 2019
| Item | Unit | Volume |
| Newly increased power transformer equipment with a capacity of over 220 kilovolts | 10000 kilovolt-amperes | 23042 |
| New railways put into operation | kilometer | 8489 |
| Of which, high-speed railways[50] | kilometer | 5474 |
| Extended or new double-track railways put into operation | kilometer | 6448 |
| Electrified railways put into operation | kilometer | 7919 |
| Length of New and rebuilt highways | kilometer | 327626 |
| Of which: Expressways | kilometer | 8313 |
| New throughput capacity of berths for over 10,000-tonnage ships | 10000 tons/year | 12022 |
| New civil transportation airports | - | 3 |
| New lines of optical-fiber cables | 10000 km | 434 |
In 2019, the investment in real estate development was 13,219.4 billion yuan, up by 9.9 percent over the previous year. Of this total, the investment in residential buildings reached 9,707.1 billion yuan, an increase of 13.9 percent, that in office buildings was 616.3 billion yuan, up by 2.8 percent, and that in buildings for commercial business was 1,322.6 billion yuan, down by 6.7 percent.
In 2019, 3.16 million housing units were started to be rebuilt in rundown urban areas nationwide. The number of housing units rebuilt in rundown areas was 2.54 million. In rural areas of China, among the poverty-stricken households that had their economic status registered at the local governments, 638 thousand[51] of them witnessed their dilapidated houses rebuilt or renovated in 2019.
Table 8: Main Indicators for Real Estate Development and Sales and Their Growth Rates in 2019
| Item | Unit | Volume | Increase over 2018 (%) |
| Value of Investment | 100 million RMB | 132194 | 9.9 |
| Of which: residential buildings | 100 million RMB | 97071 | 13.9 |
| Floor space of buildings under construction | 10,000 square meters | 893821 | 8.7 |
| Of which: residential buildings | 10,000 square meters | 627673 | 10.1 |
| Floor space of buildings newly started | 10,000 square meters | 227154 | 8.5 |
| Of which: residential buildings | 10,000 square meters | 167463 | 9.2 |
| Floor space of buildings completed | 10,000 square meters | 95942 | 2.6 |
| Of which: residential buildings | 10,000 square meters | 68011 | 3.0 |
| Floor space of commercial buildings sold | 10,000 square meters | 171558 | -0.1 |
| Of which: residential buildings | 10,000 square meters | 150144 | 1.5 |
| Funds for investment this year | 100 million RMB | 178609 | 7.6 |
| Of which: domestic loans | 100 million RMB | 25229 | 5.1 |
| individual mortgage | 100 million RMB | 27281 | 15.1 |
VII. Foreign Economic Relations
The total value of imports and exports of goods in 2019 reached 31,550.5 billion yuan, up by 3.4 percent over that of the previous year. Of this total, the value of goods exported was 17,234.2 billion yuan, up by 5.0 percent; the value of goods imported was 14,316.2 billion yuan, up by 1.6 percent. The surplus of trade in goods reached 2,918.0 billion yuan, up by 593.2 billion yuan over that of the previous year. The total value of imports and exports between China and countries along the Belt and Road[52] was 9,269.0 billion yuan, an increase of 10.8 percent over that of the previous year. Of the total, the value of goods exported was 5,258.5 billion yuan, an increase of 13.2 percent; that of goods imported was 4,010.5 billion yuan, an increase of 7.9 percent.
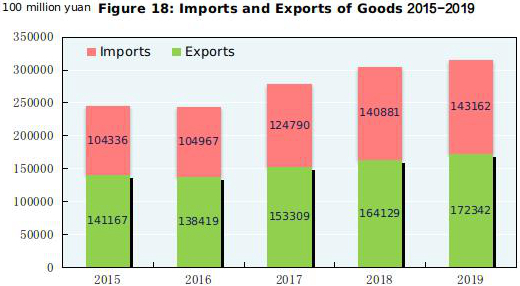
Table 9: Total Value of Import and Export of Goods and the Growth Rates in 2019
| Item | Value (100 million yuan) | Increase over 2018 (%) |
|
| Total value of import and export of goods | 315505 | 3.4 |
|
| Exports | 172342 | 5.0 |
|
| Of which: General trade | 99546 | 7.8 |
|
| Processing trade | 50729 | -3.7 |
|
| Of which: Mechanical and electronic products | 100631 | 4.4 |
|
| High & new technology products | 50427 | 2.1 |
|
| Imports | 143162 | 1.6 |
|
| Of which: General trade | 86599 | 3.1 |
|
| Processing trade | 28778 | -7.4 |
|
| Of which: Mechanical and electronic products | 62596 | -1.8 |
|
| High & new technology products | 43978 | -0.8 |
|
| Trade surplus | 29180 | — |
|
Table 10: Main Export Commodities in Volume and Value and the Growth Rates in 2019
| Item | Unit |
Volume
| Increase over 2018 (%) | Value (100 million yuan) | Increase over 2018 (%) |
| Rolled steel | 10000 tons | 6429 | -7.3 | 3699 | -7.1 |
| Textile yarns and textile articles | ---- | — | — | 8283 | 5.5 |
| Clothes and clothing accessories | ---- | — | — | 10447 | 0.3 |
| Footwear | 10000 tons | 451 | 0.6 | 3290 | 6.3 |
| Furniture and parts | ---- | — | — | 3730 | 5.3 |
| Luggage and similar containers | 10000 tons | 307 | -2.9 | 1878 | 5.1 |
| Toys | — | — | — | 2152 | 29.6 |
| Plastic articles | 10000 tons | 1424 | 8.5 | 3333 | 16.2 |
| Integrated circuits | 100 million pieces | 2187 | 0.7 | 7008 | 25.3 |
| Automatic data processing machines and components | 10000 sets | 148430 | 0.8 | 11415 | 0.5 |
| Handheld mobiles and car telephones | 10000 sets | 99433 | -11.1 | 8611 | -7.8 |
| Containers | 10000 units | 242 | -29.0 | 459 | -33.0 |
| Liquid crystal display panels | 10000 units | 150780 | -14.2 | 1475 | -3.4 |
| Motor vehicles | 10000 sets | 122 | 6.1 | 1049 | 8.0 |
Table 11: Main Import Commodities in Volume and Value and the Growth Rates in 2019
| Item | Unit | Volume | Increase over 2018 (%) | Value (100 million yuan) | Increase over 2018 (%) |
| Cereals and cereals flour | 10000 tons | 1785 | -12.8 | 358 | -7.0 |
| Soybean | 10000 tons | 8851 | 0.5 | 2437 | -2.6 |
| Edible vegetable oil | 10000 tons | 953 | 51.5 | 438 | 39.9 |
| Iron ore and concentrate | 10000 tons | 106895 | 0.5 | 6995 | 39.6 |
| Coal and lignite | 10000 tons | 29967 | 6.3 | 1605 | -1.1 |
| Crude oil | 10000 tons | 50572 | 9.5 | 16627 | 4.6 |
| Petroleum products refined | 10000 tons | 3056 | -8.7 | 1175 | -11.7 |
| Natural gas | 10000 tons | 9656 | 6.9 | 2875 | 12.8 |
| Plastics in primary forms | 10000 tons | 3691 | 12.4 | 3670 | -1.3 |
| Paper pulp | 10000 tons | 2720 | 9.7 | 1178 | -9.3 |
| Rolled steel | 10000 tons | 1230 | -6.5 | 973 | -10.2 |
| Unwrought copper and its alloys | 10000 tons | 498 | -6.0 | 2240 | -9.2 |
| Integrated circuits | 100 million pieces | 4451 | 6.6 | 21079 | 2.4 |
| Motor vehicles | 10000 sets | 105 | -7.6 | 3332 | 0.0 |
Table 12: Imports and Exports of Goods by Major Countries and Regions, the Growth Rates and Proportions in 2019
| Country or region | Exports (100 million yuan) | Increase over 2018 (%) | Proportion of the total (%) | Imports (100 million yuan) | Increase over 2018 (%) | Proportion of the total (%) |
| European Union | 29564 | 9.6 | 17.2 | 19063 | 5.5 | 13.3 |
| ASEAN | 24797 | 17.8 | 14.4 | 19456 | 9.8 | 13.6 |
| United States | 28865 | -8.7 | 16.7 | 8454 | -17.1 | 5.9 |
| Japan | 9875 | 1.7 | 5.7 | 11837 | -0.6 | 8.3 |
| Hong Kong, China | 19243 | -3.6 | 11.2 | 626 | 10.9 | 0.4 |
| Republic of Korea | 7648 | 6.6 | 4.4 | 11960 | -11.4 | 8.4 |
| Taiwan, China | 3799 | 18.3 | 2.2 | 11934 | 1.9 | 8.3 |
| Brazil | 2453 | 10.8 | 1.4 | 5501 | 7.4 | 3.8 |
| Russia | 3434 | 8.5 | 2.0 | 4208 | 7.5 | 2.9 |
| India | 5156 | 2.1 | 3.0 | 1239 | -0.2 | 0.9 |
| South Africa | 1141 | 6.4 | 0.7 | 1784 | -0.8 | 1.2 |
The total value of imports and exports of services[53] in 2019 was 5,415.3 billion yuan, up by 2.8 percent over that of the previous year. The export value of services was 1,956.4 billion yuan, up by 8.9 percent. The import value of services was 3,458.9 billion yuan, down by 0.4 percent. The trade deficit in imports and exports of services was 1,502.5 billion yuan.
The year 2019 witnessed the establishment of 40,888 enterprises (excluding banking, securities and insurance) with foreign direct investment, down by 32.5 percent over that of the previous year, and the foreign direct investment actually utilized totaled 941.5 billion yuan , up by 5.8 percent, or 138.1 billion US dollars, up by 2.4 percent. Specifically, there were 5,591 newly established enterprises receiving direct investment from countries along the Belt and Road, up by 24.8 percent; and foreign capital directly invested in China (including the investment in China via some free ports) reached 57.6 billion yuan, up by 36.0 percent, or 8.4 billion US dollars, up by 30.6 percent. In 2019, the foreign investment actually utilized by high technology industry reached 266.0 billion yuan, up by 25.6 percent, or 39.1 billion US dollars, up by 21.7 percent.
Table 13: Total Value of Foreign Direct Investment (Excluding Banking, Securities and Insurance) and the Growth Rates in 2019
| Sector | Enterprises | Increase over 2018 (%) | Actually Utilized Value (100 million yuan) | Increase over 2018 (%) | |
| Total |
| 40888 | -32.5 | 9415 | 5.8 |
| Of which: | Agriculture, Forestry, Animal Husbandry and Fishery | 495 | -33.2 | 38 | -27.9 |
| Manufacturing | 5396 | -12.3 | 2416 | -11.0 | |
| Production and Supply of Electricity, Heat Power, Gas and Water | 295 | 3.9 | 239 | -17.6 | |
| Transport, Storage and Post | 591 | -21.6 | 309 | -1.6 | |
| Information Transmission, Software and Information Technology | 4295 | -40.5 | 999 | 29.4 | |
| Wholesale and Retail Trades | 13837 | -39.5 | 614 | -4.5 | |
| Real Estate | 1050 | -0.3 | 1608 | 8.0 | |
| Leasing and Business Services | 5777 | -36.5 | 1499 | 20.6 | |
| Services to Households, Repair and Other Services | 361 | -25.6 | 37 | -0.4 | |
In 2019, the non-financial outbound direct investment reached 763.0 billion yuan, down by 4.3 percent over that of the previous year, or 110.6 billion US dollars, down by 8.2 percent. Of this total, that to countries along the Belt and Road reached 15.0 billion US dollars, down by 3.8 percent.
Table 14: Total Value of Non-financial Outbound Direct Investment and the Growth Rates in 2019
| Sector | Value (100 million US dollars) | Increase over 2018 (%) | |
| Total | 1106.0 | -8.2 | |
| Of Which:
| Agriculture, Forestry, Animal Husbandry and Fishery | 15.4 | -13.0 |
| Mining | 75.2 | -18.5 | |
| Manufacturing | 200.8 | 6.7 | |
| Production and Supply of Electricity, Heat Power, Gas and Water | 25.2 | -20.5 | |
| Construction | 85.1 | 15.6 | |
| Wholesale and Retail Trades | 125.7 | 18.6 | |
| Transport, Storage and Post | 55.5 | -4.3 | |
| Information Transmission, Software and Information Technology | 61.2 | -10.5 | |
| Real Estate | 48.2 | 22.0 | |
|
| Leasing and Business Services | 355.6 | -20.3 |
In 2019, the accomplished business revenue through contracted overseas engineering projects was 1,192.8 billion yuan, up by 6.6 percent over that of the previous year, or 172.9 billion US dollars, up by 2.3 percent. Specifically, the accomplished business revenue from countries along the Belt and Road was 98.0 billion US dollars, an increase of 9.7 percent, accounting for 56.7 percent of the accomplished business revenue through contracted overseas engineering projects. The number of labor forces sent abroad through overseas labor contracts was 490 thousand.
VIII. Finance and Financial Intermediation
The national general public budget revenue reached 19,038.2 billion yuan in 2019, up by 3.8 percent over that of the previous year, of which tax revenue amounted to 15,799.2 billion yuan, an increase of 158.9 billion yuan, up by 1.0 percent. The national general public budget expenditure reached 23,887.4 billion yuan, up by 8.1 percent over that of the previous year.
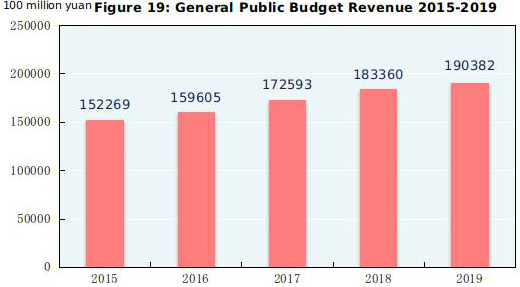
Note: Data for general public budget revenue from 2015 to 2018 as shown in the figure were final accounts and that of 2019 was the executive accounts.
By the end of 2019, money supply of broad sense (M2) was 198.6 trillion yuan, an increase of 8.7 percent over that by the end of the previous year. Money supply of narrow sense (M1) was 57.6 trillion yuan, up by 4.4 percent. Cash in circulation (M0) was 7.7 trillion yuan, up by 5.4 percent.
In 2019, the aggregate financing to the real economy (AFRE) (flow)[54] reached 25.6 trillion yuan, or 3.1 trillion yuan more than that in 2018 on a comparable basis. The AFRE (stock)[55] totaled 251.3 trillion yuan at the end of 2019, up by 10.7 percent over that at the end of 2018 on a comparable basis. Specifically, loans granted to the real economy in Renminbi stood at 151.6 trillion yuan, up by 12.5 percent. Savings deposit in Renminbi and foreign currencies in all items of financial institutions totaled 198.2 trillion yuan at the end of 2019, an increase of 15.7 trillion yuan compared with that at the beginning of the year. Of this total, the savings deposit in Renminbi stood at 192.9 trillion yuan, an increase of 15.4 trillion yuan. Loans in Renminbi and foreign currencies in all items of financial institutions reached 158.6 trillion yuan, an increase of 16.8 trillion yuan. Of this total, loans in Renminbi were 153.1 trillion yuan, an increase of 16.8 trillion yuan.
Table 15: Savings Deposit and Loans in RMB and Foreign Currencies in All Financial Institutions and Growth Rates at the End of 2019
| Item | Year-end figure (100 million yuan) | Increase over 2018 (%) |
| Savings deposit | 1981643 | 8.6 |
| Domestic households | 821296 | 13.4 |
| Deposits in RMB | 813017 | 13.5 |
| Domestic non-financial enterprises | 621147 | 5.4 |
| Loans | 1586021 | 11.9 |
| Domestic short-term loans | 472380 | 6.6 |
| Domestic medium and long-term loans | 971805 | 13.7 |
Loans in Renminbi from rural financial institutions (rural credit cooperatives, rural cooperation banks and rural commercial banks) totaled 19,068.8 billion yuan by the end of 2019, an increase of 2,086.6 billion yuan as compared with that at the beginning of the year. Loans in Renminbi for consumption use from all financial institutions totaled 43,966.9 billion yuan, an increase of 6,166.7 billion yuan. Of the total, short-term personal loans totaled 9,922.6 billion yuan, an increase of 1,451.9 billion yuan, and medium and long-term personal loans reached 34,044.3 billion yuan, an increase of 4,714.8 billion yuan.
Funds raised through A-shares issued on Shanghai and Shenzhen Stock Exchanges[56] amounted to 1,353.4 billion yuan in 2019, an increase of 207.6 billion yuan from the previous year. 201 A-shares were newly issued, raising 249.0 billion yuan worth of capital altogether, up by 111.2 billion yuan over that of the previous year. Of the total, 70 shares were from the science and technology innovation board, raising 82.4 billion yuan; refinancing of A-shares (including public newly issued, targeted placement, right issued, preferred stock and exchanged convertible bonds) raised 1,104.4 billion yuan, an increase of 96.4 billion yuan over that of the previous year. Various types of market entities financed 7,198.7 billion yuan through issuing bonds (including corporate bonds, convertible bonds, exchangeable bonds, financial bonds issued by policy banks, local government bonds and asset-backed securities) on Shanghai and Shenzhen Stock Exchanges, up by 1,510.9 billion yuan over that of the previous year. There were 8,953 companies listed on National Equities Exchange and Quotations[57] and funds raised by listed companies reached 26.5 billion yuan in 2019.
In 2019, 10.71 trillion yuan corporate debenture bonds[58] were issued, an increase of 2.92 trillion yuan over that of the previous year.
The premium of primary insurance received by the insurance companies[59] totaled 4,264.5 billion yuan in 2019, up by 12.2 percent over that of the previous year. Of this total, life insurance premium of primary insurance amounted to 2,275.4 billion yuan, health and casualty insurance premium of primary insurance 824.1 billion yuan, and property insurance premium of primary insurance 1,164.9 billion yuan. Insurance companies paid an indemnity worth of 1,289.4 billion yuan, of which, life insurance indemnity was 374.3 billion yuan, health and casualty insurance indemnity 264.9 billion yuan, and property insurance indemnity 650.2 billion yuan.
IX. Households Income and Consumption and Social Security
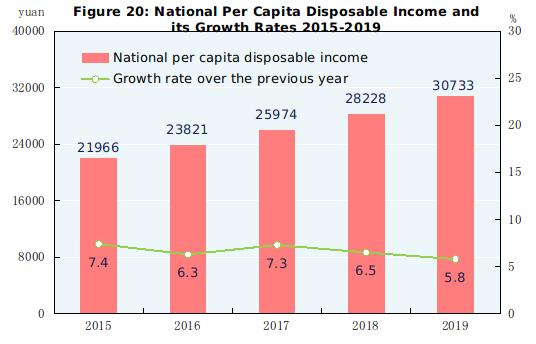
In 2019, the per capita disposable income nationwide was 30,733 yuan, an increase of 8.9 percent over that of the previous year or a real increase of 5.8 percent after deducting price factors. The median[60] of per capita disposable income nationwide was 26,523 yuan, up by 9.0 percent. In terms of usual residence, the per capita disposable income of urban households was 42,359 yuan, up by 7.9 percent over that of 2018, or a real growth of 5.0 percent after deducting price factors. The median of per capita disposable income of urban households was 39,244 yuan, up by 7.8 percent. The per capita disposable income of rural households was 16,021 yuan, up by 9.6 percent over that of the previous year, or 6.2 percent in real terms after deducting price factors. The median of per capita disposable income of rural households was 14,389 yuan, up by 10.1 percent. Grouped by income quintile[61], the per capita disposable income of low-income group reached 7,380 yuan, the lower-middle-income group 15,777 yuan, the middle-income group 25,035 yuan, the upper-middle-income group 39,230 yuan and the high-income group 76,401 yuan. The per capita monthly income of migrant workers was 3,962 yuan, increased by 6.5 percent over that of the previous year.
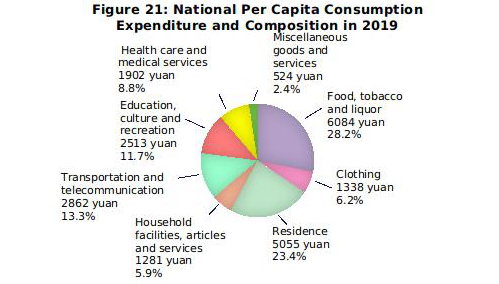
The national per capita consumption expenditure was 21,559 yuan, up by 8.6 percent over that of the previous year, or a real growth of 5.5 percent after deducting price factors. Specifically, the per capita consumption expenditure on services[62] totaled 9,886 yuan, up by 12.6 percent over that of the previous year, accounting for 45.9 percent of the per capita consumption expenditure. In terms of usual residence, the per capita consumption expenditure of urban households was 28,063 yuan, up by 7.5 percent, or 4.6 percent in real terms after deducting price factors. The per capita consumption expenditure of rural households was 13,328 yuan, up by 9.9 percent, or a real growth of 6.5 percent after deducting price factors. The national Engel’s Coefficient stood at 28.2 percent, 0.2 percentage point lower than that of the previous year, with that of urban and rural households standing at 27.6 percent and 30.0 percent respectively.
By the end of 2019, a total of 434.82 million people participated in basic endowment insurance program for urban workers, an increase of 15.81 million over that by the end of 2018. A total of 532.66 million people participated in basic endowment insurance program for urban and rural residents, an increase of 8.74 million. A total of 1,354.36 million people participated in basic medical insurance program, an increase of 9.78 million. Of this total, 329.26 million people participated in the program for workers, an increase of 12.45 million, and 1,025.10 million people participated in the program for urban and rural residents. Some 205.43 million people participated in unemployment insurance program, an increase of 8.99 million. The number of people receiving unemployment insurance payment stood at 2.28 million by the end of 2019. A total of 254.74 million people participated in work-related injury insurance, an increase of 16.00 million, of which 86.16 million were migrant workers, an increase of 5.30 million. A total of 214.32 million people participated in maternity insurance programs, an increase of 9.97 million. Minimum living allowances were granted to 8.61 million urban residents and 34.56 million rural residents, and 4.39 million rural residents living in extreme poverty[63] received relief and assistance and 9.18 million people received temporary assistance[64]. A total of 77.82 million people were financed to participate in basic medical insurance program and outpatient and inpatient assistance were granted to 61.80 million recipients. National subsidies and allowances were provided to 8.61 million veterans and other entitled people in 2019.
By the end of 2019, there were altogether 37 thousand social welfare institutions providing accommodation, of which 34 thousand were elderly caring organizations and 663 were children caring organizations. The social welfare institutions provided 7.901 million beds[65], of which 7.614 million were for the elderly and 97 thousand were for children. By the end of 2019, there were 26 thousand community service centers and 167 thousand community service stations.
X. Science & Technology and Education
Expenditures on research and experimental development activities (R&D) were worth 2,173.7 billion yuan in 2019, up by 10.5 percent over that of 2018, accounting for 2.19 percent of GDP. Of this total, 120.9 billion yuan was used for basic research programs. A total of 234 subject researches were arranged under the national science and technology major projects and 45,192 projects were financed by the National Natural Science Foundation. By the end of 2019, there were altogether 515 state key laboratories in operation, 133 national engineering research centers, 217 national engineering laboratories, and 1,540 state-level enterprise technology centers. The National Fund for Technology Transfer and Commercialization established 21 sub-funds, with the total size reaching 31.3 billion yuan. There were 1,177 state-level technology business incubators[66] and 1,888 national mass makerspaces[67]. There were 4,380 thousand patent applications from home and abroad, up by 1.3 percent over that of the previous year, and a total of 2,592 thousand were authorized, up by 5.9 percent. The number of PCT patent applications accepted[68] was 61 thousand. By the end of 2019, the number of patents in force was 9,722 thousand, of which 1,862 thousand were invention patents from home. The number of invention patents per 10,000 people was 13.3. Trademark application reached 7,837 thousand, up by 6.3 percent over that of the previous year; trademark registration totaled 6,406 thousand, up by 27.9 percent over that of the previous year. A total of 484 thousand technology transfer contracts were signed, representing 2,239.8 billion yuan in value, up by 26.6 percent over that of the previous year.
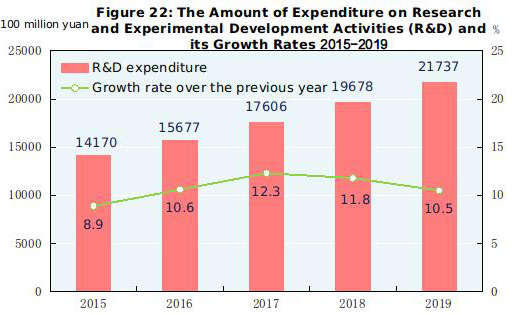
Table 16: Number of Patent Applications, Patents Authorized and Patents in Force in 2019
| Item | Patents (10,000) | Increase over 2018 (%) |
| Number of patent applications | 438.0 | 1.3 |
| Of which: domestic | 417.2 | 1.2 |
| Of which: for new inventions | 140.1 | -9.2 |
| Of which: domestic | 123.1 | -10.8 |
| Number of patents authorized | 259.2 | 5.9 |
| Of which: domestic | 245.8 | 6.0 |
| Of which: for new inventions | 45.3 | 4.8 |
| Of which: domestic | 35.4 | 4.3 |
| Number of patents in force at the end of the year | 972.2 | 16.0 |
| Of which: domestic | 869.2 | 17.5 |
| Of which: for new inventions | 267.1 | 12.9 |
| Of which: domestic | 186.2 | 16.3 |
The year 2019 saw 32 times of successful satellite launches. Carrier rocket the Long March-5 Y3 and Gaofen-7 satellite were successfully launched. The Long March carrier rocket series completed its 300 launches. Chang´e-4 probe made the first-ever soft landing and exploration on the far side of the moon. The solid-propellant carrier rocket was successfully launched at sea. The deployment of the core constellation of Beidou-3 global system was completed. Xuelong 2 made its maiden voyage to the Antarctic. The first home-built aircraft carrier was commissioned into active service.
By the end of 2019, there were altogether 835 national quality inspection centers. There were 596 agencies for product quality and management system and service certification, accumulatively 720,000 enterprises were certified. A total of 2,021 national standards were developed or revised in the year, including 1,448 new standards. The qualification rate of manufactured products[69] reached 93.86 percent.
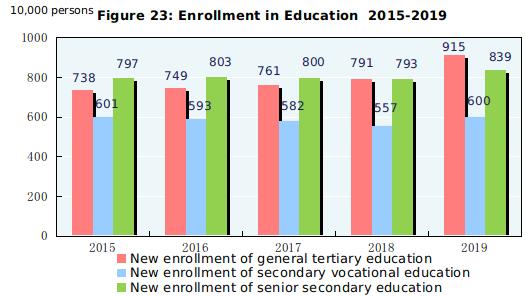
In 2019, the post-graduate education enrollment was 2.864 million students with 917 thousand new students and 640 thousand graduates. The general tertiary education enrollment was 30.315 million students with 9.149 million new students and 7.585 million graduates. Vocational secondary schools[70] had 15.765 million enrolled students, including 6.004 million new entrants, and 4.934 million graduates. Senior secondary schools had 24.143 million enrolled students, including 8.395 million new entrants, and 7.892 million graduates. Students enrolled in junior secondary schools totaled 48.271 million, including 16.388 million new entrants, and 14.541 million graduates. The country had a primary education enrollment of 105.612 million students, including 18.690 million new entrants, and 16.479 million graduates. There were 795 thousand students enrolled in special education schools, with 144 thousand new entrants and 98 thousand graduates. Kindergartens accommodated 47.139 million children. The number of students graduating from compulsory education reached 94.8 percent of the total enrollment, and the gross enrollment ratio for senior secondary education reached 89.5 percent.
XI. Culture and Tourism, Public Health and Sports
By the end of 2019, there were 2,072 art-performing groups and 3,410 museums in the culture and tourism system throughout China. A total of 3,189 public libraries received[71] 877.74 million people. There were 3,325 cultural centers. Subscribers to cable television programs numbered 212 million, in which 198 million subscribed to digital cable television programs. By the end of 2019, radio broadcasting and television broadcasting coverage rates were 99.1 percent and 99.4 percent respectively. A total of 10,646 episodes of 254 TV series and 94,659 minutes of TV cartoons were made in 2019. The country produced 850 feature movies and 187 popular science movies, documentaries, animation and special movies[72]. A total of 31.5 billion copies of newspapers and 2.2 billion copies of magazines were issued, and 10.2 billion copies of books were published. The average number of books possessed per person[73] was 7.29 copies. By the end of the year, there were 4,136 archives in China and 143.41 million files were made accessible to the public. The business revenue of enterprises above the designated size engaged in culture and related industries reached 8,662.4 billion yuan, up by 7.0 percent over that of the previous year on a comparable basis.
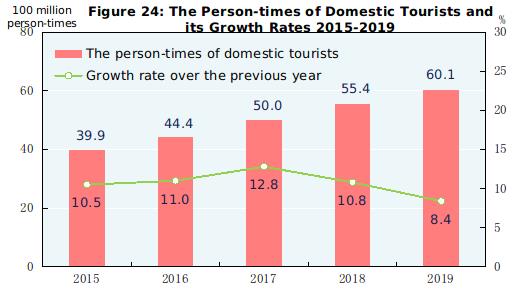
The year 2019 registered 6.01 billion domestic tourists, up by 8.4 percent over that of the previous year. The revenue from domestic tourism totaled 5,725.1 billion yuan, up by 11.7 percent. The number of inbound visitors to China totaled 145.31 million, an increase of 2.9 percent. Of this total, 31.88 million were foreigners, up by 4.4 percent; and 113.42 million were Chinese compatriots from Hong Kong, Macao and Taiwan, up by 2.5 percent. Of all the inbound tourists, overnight visitors counted 65.73 million, an increase of 4.5 percent. Earnings from international tourism topped 131.3 billion US dollars, up by 3.3 percent. The number of China’s outbound visitors totaled 169.21 million, up by 4.5 percent. Of this total, 162.11 million were on private visits, an increase of 4.6 percent; and 102.37 million visited Hong Kong, Macao and Taiwan, up by 3.2 percent.
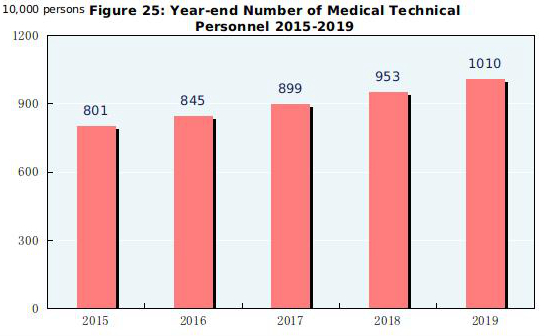
By the end of 2019, there were 1,014,000 medical and health institutions in China, including 34,000 hospitals. Of all the hospitals, 12,000 were public, and 22,000 were private. Of the 960,000 medical and health institutions at grass-root level, there were 36,000 town and township health centers, 35,000 community health service centers, 267,000 clinics and 621,000 village clinics. Of the 17,000 professional public health institutions, 3,456 were disease control and prevention centers and 3,106 were health monitoring institutions. By the end of 2019, there were 10.10 million medical technical personnel in China, including 3.82 million licensed doctors and licensed assistant doctors and 4.43 million registered nurses. The medical and health institutions in China possessed 8.92 million beds, of which, hospitals possessed 6.97 million and township health centers had 1.38 million. The total number of medical visits[74] and hospital discharges[75] in 2019 reached 8.52 billion and 270 million respectively.
There were altogether 3.162 million sports venues[76]. The sports venue area[77] totaled 2.59 billion square meters and the per capita sports venue area reached 1.86 square meters. In 2019, Chinese athletes won 128 world championships in 33 sports events and broke 16 world records. Chinese physically-challenged athletes won 350 world championships in 53 international sports competitions.
XII. Resources, Environment and Emergency Management
In 2019, the total supply of state-owned land for construction use[78] was 624 thousand hectares, a decrease of 3.6 percent over that of the previous year. Of this total, the supply for mining storage was 147 thousand hectares, up by 10.3 percent; that for real estate[79] was 142 thousand hectares, down by 1.4 percent; and that for infrastructure facilities was 335 thousand hectares, down by 9.5 percent.
The total stock of water resources in 2019 was 2,867.0 billion cubic meters. With a decrease of 0.4 percent over 2018, the total water consumption reached 599.1 billion cubic meters, of which water consumption for living purposes up by 1.9 percent, for industrial use down by 2.1 percent, for agricultural use down by 0.5 percent, and for ecological water supplement grew by 0.5 percent. Water consumption for every 10 thousand yuan worth of GDP produced[80] was 67 cubic meters, a decline of 6.1 percent over that of the previous year. Water consumption for every 10 thousand yuan worth of industrial value added was 42 cubic meters, down by 7.2 percent. Per capita water consumption was 429 cubic meters, down by 0.8 percent over that of the previous year.
In 2019, the total area of afforestation reached 7.07 million hectares, of which 3.65 million hectares were afforested by manpower, accounting for 51.6 percent of the total. Forest tending areas reached 7.73 million hectares. By the end of 2019, there were 474 national natural reserves. A total of 54 thousand square kilometers of land have been saved from soil erosion.
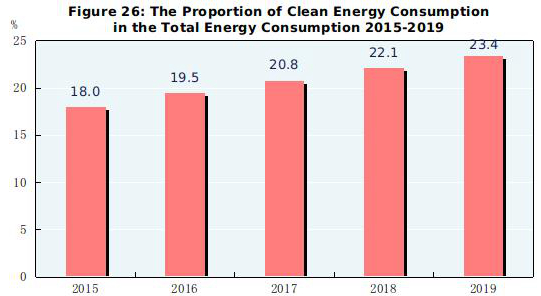
Preliminary estimation indicated that the total energy consumption[81] in 2019 amounted to 4.86 billion tons of standard coal equivalent, up by 3.3 percent over that of 2018. The consumption of coal increased by 1.0 percent; crude oil, up by 6.8 percent; natural gas, up by 8.6 percent; and electric power, up by 4.5 percent. The consumption of coal accounted for 57.7 percent of the total energy consumption, 1.5 percentage points lower than that of 2018, while clean energy consumption, such as natural gas, hydropower, nuclear power and wind power accounted for 23.4 percent, 1.3 percentage points higher. The comprehensive energy consumption per unit calcium carbide by key energy-intensive industrial enterprises went down by 2.1 percent, per unit synthetic ammonia down by 2.4 percent, per ton steel down by 1.3 percent and per unit electrolytic aluminium down by 2.2 percent. The standard coal consumption per kilowatt-hour of thermal power generation decreased by 0.3 percent. The carbon dioxide emission per 10,000 yuan worth of GDP was cut by 4.1 percent.
Monitoring of oceanic water quality at 1,257 offshore monitoring stations indicated that oceanic water met the national quality standard Grade I and II at 76.6 percent of the stations; water quality at 7.0 percent of the stations met Grade III standard; and water of Grade IV or inferior quality was found at 16.4 percent of the stations.
Of the monitored 337 cities at prefecture level and above, 46.6 percent reached the air standard and 53.4 percent failed. The annual average concentration of particulate matter (PM2.5) for cities that failed to meet the standard (cities failed to meet the standard of annual average PM2.5 concentration in 2015) stood at 40 micrograms per cubic meter, down by 2.4 percent over that of the previous year.
Of the 322 cities subject to noise monitoring program, 2.5 percent enjoyed fairly good environment, 66.8 percent had good environment, 28.9 percent had fair environment, 1.9 percent had poor environment in downtown areas.
The average temperature in 2019 was 10.34℃, up by 0.25℃ compared with that of the previous year. Typhoons hit China 5 times in 2019.
In 2019, natural disasters hit 19.26 million hectares of crops, of which 2.80 million hectares of crops were demolished. Flood, waterlogging and geological disasters caused a direct economic loss of 192.3 billion yuan. Droughts caused a direct economic loss of 45.7 billion yuan. Disasters caused by low temperature, frost and snow made a total direct economic loss of 2.8 billion yuan. Oceanic disasters caused a direct economic loss of 11.7 billion yuan. The country recorded 20 earthquakes with magnitude 5.0 and over, 13 of which caused disasters, causing a direct economic loss of 5.9 billion yuan. The year 2019 witnessed 2,345 forest fires, with 14 thousand hectares of forests damaged.
The death toll due to work accidents amounted to 29,519 people. Work accidents in industrial, mining and commercial companies caused 1.474 deaths out of every 100 thousand employees, down by 4.7 percent over that of 2018. The death toll for one million tons of coal produced in coalmines was 0.083 people, down by 10.8 percent. The road traffic death toll per 10 thousand vehicles was 1.80 people, down by 6.7 percent.
Data Sources:
In this Communiqué, data of urbanization rate of population with household registration, motor vehicles for civilian use and traffic accidents are from the Ministry of Public Security; data of newly increased employed people in urban areas, registered unemployment rate, social security and skilled workers schools are from the Ministry of Human Resources and Social Security; data of foreign exchange reserves and exchange rates are from the State Administration of Foreign Exchange; data of market entities, quality inspection, the formulation and revision of national standards and qualification rate of manufactured products are from the State Administration for Market Regulation; data of cutting taxes and fees are from the State Taxation Administration; data of output of aquatic products and area of farmland newly equipped with effective water-saving irrigation systems are from the Ministry of Agriculture and Rural Affairs; data of production of timber, area of afforestation, forest tending areas and national natural reserves are from the National Forestry and Grassland Administration; data of area of farmland newly equipped with irrigation system, water resources and land newly saved from soil erosion are from the Ministry of Water Resources; data of installed power generation capacity, newly increased power transformer equipment with a capacity of 220 kilovolts and above and electricity consumption are from the China Electricity Council; data of volume of freight handled by ports, container shipping of ports, highway transportation, waterway transportation, new and rebuilt highways and new throughput capacity of berths for over 10,000-tonnage ships are from the Ministry of Transport; data of railway transportation, new railways put into operation, new double-track railways put into operation and electrified railways put into operation are from China Railway; data of civil aviation and new civil transportation airports are from the Civil Aviation Administration of China; data of pipelines are from China National Petroleum Corporation, China Petrochemical Corporation and China National Offshore Oil Corporation; data of postal service are from State Post Bureau; data of telecommunication, software revenue, and new lines of optical-fiber cables are from the Ministry of Industry and Information Technology; data of housing units rebuilt or renovated in rundown urban areas and for poverty-stricken rural households with economic status registered at the local governments are from the Ministry of Housing and Urban-Rural Development; data of imports and exports of goods are from the General Administration of Customs; data of imports and exports of services, foreign direct investment, outbound direct investment, overseas contracted projects and overseas labor contracts are from the Ministry of Commerce; data of finance are from the Ministry of Finance; data of monetary finance and corporate debenture bonds are from the People’s Bank of China; data of funds raised through domestic exchange markets are from China Securities Regulatory Commission; data of the insurance sector are from China Banking and Insurance Regulatory Commission; data of medical insurance, maternity insurance, people financed to participate in basic medical insurance program, and outpatient and inpatient assistance recipients are from the National Healthcare and Security Administration; data of urban and rural minimum living allowances, relief and assistance granted to rural residents living in extreme poverty, temporary assistance and social services are from the Ministry of Civil Affairs; data of entitled people are from the Ministry of Veterans Affairs; data of national science and technology major projects, state key laboratories, National Fund for Technology Transfer and Commercialization, state-level technology business incubators, national mass makerspaces and technology transfer contracts are from the Ministry of Science and Technology; data of natural science foundation projects are from the National Natural Science Foundation; data of national engineering research centers, national engineering laboratories and enterprise technical centers are from the National Development and Reform Commission; data of patents and trademarks are from the National Intellectual Property Administration; data of satellite launches are from the State Administration of Science, Technology and Industry for National Defense; data of education are from the Ministry of Education; data of art-performing groups, museums, public libraries, cultural centers, books and tourism are from the Ministry of Culture and Tourism; data of television and radio programs are from the National Radio and Television Administration; data of movies are from the China Film Administration; data of newspapers and magazines are from the National Press and Publication Administration; data of files are from the State Archives Administration; data of outbound visitors are from the National Immigration Administration; data of medical care and health are from the National Health Commission; data of sports are from the General Administration of Sport; data of physically-challenged athletes are from the China Disabled Persons’ Federation; data of supply of state-owned land for construction use and direct economic loss caused by oceanic disasters are from the Ministry of Natural Resources; data of the carbon dioxide emission per 10,000 yuan worth of GDP and environment monitoring are from the Ministry of Ecology and Environment; data of average temperature and typhoons are from the China Meteorological Administration; data of areas of crops hit by natural disasters, direct economic loss caused by flood, waterlogging and geological disasters, direct economic loss caused by droughts, direct economic loss caused by low temperature, frost and snow, forest fires, areas of forests damaged and work safety are from the Ministry of Emergency Management; data of the number of earthquakes and direct economic loss caused by earthquakes are from the China Earthquake Administration; all the other data are from the National Bureau of Statistics.
Notes:
1. All figures in this Communiqué are preliminary statistics. Statistics in this Communiqué do not include Hong Kong SAR, Macao SAR and Taiwan Province. Due to the rounding-off reasons, the subentries may not add up to the aggregate totals.
2. Gross domestic product (GDP), value added of the three and related industries, regional GDP, per capita GDP and gross national income (GNI) as quoted in this Communiqué are calculated at current prices whereas their growth rates are at constant prices. Historical data of GDP, value added of the three and related industries and other related indicators were revised based on the results of the fourth national economic census.
3. Gross national income, also known as gross national product, refers to the total primary distribution of the income created by all the resident units of a country (or a region) during a certain period of time. It equals to gross domestic product plus the net primary distribution of income from abroad.
4. The national energy consumption per 10,000 yuan worth of GDP is calculated at constant prices of 2015. The historical data were revised based on the results of the fourth national economic census.
5. The overall labor productivity refers to the ratio between the GDP (at 2015 constant prices) and the total number of persons employed. The historical data were revised based on the results of the fourth national economic census.
6. See Note 2.
7. See Note 4.
8. See Note 5.
9. Population who live in places other than their household registration areas refers to those who reside in areas other than their household registration and have been away from there for over 6 months.
10. Floating population refers to the population who live in places other than their household registration excluding those with current residences different from the places of their household registration but still in the same city. Population who live in places other than their household registration but still in the same city refers to those whose current residences are different from the registered towns or streets in the same district or in different districts but still in the same municipality or prefecture-level city.
11. By the end of 2019, the population aged 0 to 14 (under the age of 15) was 234.92 million and that aged 15 to 59 (under the age of 60) was 911.25 million.
12. The number of migrant workers includes those who are employed outside their villages and towns for more than six months in the year and those who do non-agricultural work in their villages and towns for more than six months in the year.
13. The producer prices for farm products refer to the prices of farm products sold directly by producers.
14. The prices for residence include prices for rent, maintenance and management, water, electricity and fuel etc.
15. Capacity utilization rate refers to the ratio of the actual production to the production capacity (in terms of value). Actual production refers to the total industrial output value during the enterprise’s reporting period. Production capacity refers to the production which can be realized and sustained for a long term under the condition of the supply of labor force, materials, fuel and transportation guaranteed and the production equipment in proper operation.
16. The growth rates and rate changes of financial indicators of industrial enterprises above the designated size in 2019 are calculated on a comparable basis due to adjustments of data coverage in the statistical programmes, statistical law enforcement, removal of duplicated data, corporate reforms and divestiture and the fourth national economic census etc.
17. Industrial strategic emerging industries refer to the related industrial sectors of information technology of new generation, manufacture of high-end equipment, new materials, biotech, new energy vehicles, new energy, energy-saving and environmental protection and digital creative industries. The growth rate of the value-added of the industrial strategic emerging industries in 2019 is calculated on a comparable basis.
18. High technology manufacturing industry includes manufacture of medicine, manufacture of aerospace vehicle and equipment, manufacture of electronic and communication equipment, manufacture of computers and office equipment, manufacture of medical equipment, manufacture of measuring instrument and equipment and manufacture of optical and photographic equipment.
19. Manufacture of equipment includes manufacture of metal products, general purpose equipment, special purpose equipment, automobiles, railway, ship, aerospace and other transport equipment, electrical machinery and apparatus, computers, communication and other electric equipment and measuring instrument and machinery.
20. Service enterprises above the designated size, refer to entities of transport, storage and post, information transmission, software and information technology services, real estate (excluding real estate development and operation), leasing and business services, scientific research and technical services, water conservancy, environment and public facilities management and education, health and social work with annual business revenue of 10 million yuan and above or with 50 employees and above at the end of the year; legal entities of services to households, repair and other services and culture, sports and entertainment with annual business revenue of 5 million and above or with 50 employees and above at the end of the year.
21. Strategic emerging service industries refer to the related service sectors of information technology of new generation, manufacture of high-end equipment, new materials, biotech, new energy vehicles, new energy, energy-saving and environmental protection and digital creative industries, and service industries related to new technology and new entrepreneurship. The growth rate of the business revenue of the strategic emerging service industries in 2019 is calculated on a comparable basis.
22. Investment in high technology industries refers to investment in six high technology manufacturing industries, including the manufacture of medicine and manufacture of aerospace vehicle and equipment, and nine high technology service industries, including information service and e-commerce service.
23. Investment in industrial technological transformation refers to the investment in the improvement of the existing equipment, technologies and production services through new technologies, crafts, equipment and materials so as to achieve intensive development.
24. Online retail sales refer to the retail sales of goods and services realized through internet trading platforms (online platforms mainly in trading physical commodities, including self-built websites and third-party platforms).
25. The eastern areas include 10 provinces and municipalities: Beijing, Tianjin, Hebei, Shanghai, Jiangsu, Zhejiang, Fujian, Shandong, Guangdong and Hainan; the central areas cover 6 provinces: Shanxi, Anhui, Jiangxi, Henan, Hubei and Hunan; the western areas include 12 provinces, autonomous regions and municipalities: Inner Mongolia, Guangxi, Chongqing, Sichuan, Guizhou, Yunnan, Tibet, Shaanxi, Gansu, Qinghai, Ningxia and Xinjiang; the northeastern areas include 3 provinces: Liaoning, Jilin and Heilongjiang.
26. The number of people lifted out of poverty equals the population in poverty in the current year minus that in the previous year. It is also equivalent to the population out of poverty minus the population returning to poverty in the current year.
27. The incidence of poverty refers to the proportion of population in poverty to targeted population under survey.
28. Impoverished areas cover contiguous poverty-stricken areas and key counties under national poverty alleviation and development program beyond those areas. There were 832 counties altogether. Since 2017, Aksu prefecture in Xinjiang has also been covered in poverty monitoring.
29. See Note 2.
30. Output data of some products were revised in 2018 based on the results of the fourth national economic census; the growth rates of output in 2019 are calculated on a comparable basis.
31. Thermal power refers to electricity generated by coal, oil, gas, residual heat, pressure and gas, waste incineration and biomass.
32. The data include 252.00 million tons of steel which has been reprocessed among enterprises.
33. Some installed power generation capacity was not listed (e.g. geothermal).
34. See note 16.
35. See Note 2.
36. See Note 2.
37. In 2019, the statistical coverage of ports expanded from ports above the designated size to all ports; the growth rates of relevant indicators are calculated on a comparable basis.
38. The Ministry of Transport adjusted the coverage of the freight traffic and freight flow of the highways in 2019 based on the ad hoc survey so the data are incomparable with the previous year.
39. The total passenger traffic includes passenger traffic by railways, highways, waterways and civil aviation for commercial purpose, of which traffic by highways accounted for more than 70 percent. Over recent years, the revolution of people’s travel methods has brought about the fast growth of road trips, online car hailing and carpooling, which has caused a decline of the passenger traffic by highways, as well as the total passenger traffic.
40. The turnover of post services is calculated at constant prices of 2010.
41. The turnover of telecommunication services is calculated at constant prices of 2015.
42. Fixed broadband internet users refer to those who subscribed to the telecommunication enterprises and access the Internet through xDSL, FTTx+LAN, FTTH/0 and other broadband access ways as well as general dedicated lines at the end of the reporting period.
43. Fixed fiber-optic broadband internet users refer to those who subscribed to the telecommunication enterprises and access the Internet through FTTH or FTT0 at the end of the reporting period.
44. Software and information technology services industry includes software development, integrated circuit design, information system integration and internet of things technology services, operation maintenance services, information processing and storage support services, IT consulting services, digital content services and other IT services industry.
45. The figure of the investment in fixed assets in 2018 was revised according to the results of the fourth national economic census, statistical law enforcement and the statistical survey programmes. The growth rates in 2019 are calculated on a comparable basis.
46. See Note 25.
47. Private investment in fixed assets refers to investment in the construction or purchase of fixed assets by domestic collective, private and individual-owned enterprises or organizations or their holding enterprises (with absolute holding and relative holding enterprises).
48. Investment in infrastructure includes transportation, postal service, telecommunication, radio, TV and satellite transmission, internet and related services, water conservancy, environment and public facilities management.
49. The investment in real estate includes the investment in real estate development, construction of buildings for own use, property management, intermediary services and other real estate investment.
50. High-speed railways refer to railways with a maximum operating speed of 200 km/h and above and railways with a maximum operating speed less than 200 km/h but only for high speed trains.
51. The figure is the number of housing units of the poverty-stricken rural households with their economic status registered at the local governments that were started to be rebuilt or renovated by the end of 2019, financed by the central government budget.
52. The Belt and Road refers to the Silk Road Economic Belt and the 21st Century Maritime Silk Road.
53. The imports and exports of services are calculated according to the sixth edition of Balance of Payments and International Investment Position Manual (BPM6), and the growth rate is calculated on a comparable basis.
54. The AFRE (flow) refers to the total volume of financing provided by the financial system to the real economy within a certain period of time. Adjustment was made to the statistical coverage of AFRE in 2019.
55. The AFRE (stock) refers to the outstanding financing provided by the financial system to the real economy at the end of a period of time (a month, a quarter or a year).
56. Funds raised through Shanghai and Shenzhen Stock Exchanges are calculated by the money raised on the listing date, and the funds raised include the actual exchanged convertible bonds, which were 8.0 billion yuan in 2018 and 99.5 billion yuan in 2019.
57. National Equities Exchange and Quotations, also called “the New Over-the-Counter Market”, is a national securities exchange established upon approval by the State Council in 2012. Preferred stocks were excluded from funds raised by listed companies in National Equities Exchange and Quotations. Funds raised by shares are calculated by the disclosure date of the issurance report.
58. Corporate debenture bonds include debt financing instruments of non-financial businesses, enterprise bonds, corporate bonds and convertible bonds.
59. The premium of primary insurance received by the insurance companies refers to the premium income from primary insurance contracts confirmed by the insurance companies.
60. The median of per capita income refers to the per capita income of household lied in the middle of all surveyed households which are ranked from low to high (or high to low) based on per capita income level.
61. The income quintile refers to the five equal partitions of all surveyed households, who are ranked from low to high based on per capita income level. The top 20 percent with the highest income are classified as high-income group, and the other four levels are upper-middle-income group, middle-income group, lower-middle-income group and low-income group.
62. The consumption expenditure on services refers to the spending by surveyed households on non-commodity services for daily lives.
63. Rural residents living in extreme poverty refer to the aged, the disabled and the minor under 16 years of age in rural areas who have no ability to work, no sources of income and no statutory obligors to provide for them, bring them up or support them, or whose statutory obligors have no ability to fulfill their obligations.
64. Temporary assistance refers to emergent and transitional assistance the government provides to families or individuals who experience hardships because of emergencies, unexpected harm, major diseases or other unusual factors and are not covered by other forms of social assistance programs or still suffer hardships after receiving other social assistance programs.
65. The beds provided by social welfare institutions include beds provided by adoption agencies, aid agencies and community agencies.
66. The state-level technology business incubators are technology-based business startup service providers consistent with the Administrative Measures for Technology Business Incubators that provide physical space, shared facilities and professional services with the mission of advancing transformation of technological achievements, cultivating technological enterprises and fostering the entreprenuerial spirit. They should be approved and accredited by the Ministry of Science and Technology.
67. The national mass makerspaces are new service platform for entrepreneurship and innovation that are in comformity with the Guidelines on Developing Mass Makerspaces and are reviewed and registered by Torch High Technology Industry Development Center of the Ministry of Science and Technology in accordance with the Provisional Registration Regulations on National Mass Makerspaces.
68. The number of PCT patent applications accepted refers to the number of PCT patent application accepted by the State Intellectual Property Office which acts as the receiving office of PCT patent application. PCT is the abbreviation of Patent Cooperation Treaty, which is a treaty for international cooperation in the field of patents.
69. The qualification rate of manufactured products is the ratio of the samples that have passed the sampling quality test, the process of which follows certain methods, procedure and standard, to the total amount of the sampled products. The survey samples cover 29 sectors of the manufacturing industry.
70. Vocational secondary schools include regular specialized secondary schools, adult specialized secondary schools, vocational high schools and skilled workers schools.
71. The people received by the public libraries refer to the number of people who visit libraries and use library services in the year, including borrowing and reading books, consultation and attending readers’ programs.
72. Special movies refer to those using different display modes in terms of projection techniques, equipment and program as compared with the ordinary cinemas, such as IMAX movies, 3D movies, 4D movies, multidimensional movies and full dome movies.
73. The average number of books possessed per person refers to the average number of books published in the year that can be possessed per person in China.
74. The total number of medical visits refers to the number of people receiving medical services, including outpatient services, emergency treatment, home visits, appointment-based diagnosis and treatment, health check-up of a specific item, and health consultation and guidance (excluding health lectures).
75. The number of hospital discharges refers to the number of inpatients discharged from hospitals in the reporting period, including those who are discharged from hospitals or transferred to other medical institutions following doctors’ advice, discharged from hospitals without doctors’ permission, dead or other situations. The number of people who are recovered from family sickbeds is excluded.
76. Data on sports venues are from the results of the seventh natinaI census on sports venues. The sports venues belonging to armed forces and railway system are excluded in the census on sports venues. Data is as of the end of 2018.
77. The sports venue area refers to area used for physical training, sports competitions and physical fitness.
78. Total supply of state-owned land for construction use refers to the total amount of state-owned land for construction use with the land-use right transferred, allocated or leased to units or individuals through signed transaction contracts and allocation decisions by the municipal or county governments according to annual land supply plan and in line with relevant laws in the reporting period.
79. Land used for real estate refers to the sum of land used for commercial service and for residence.
80. The consumption of water for producing 10 thousand yuan worth of GDP and 10 thousand yuan worth of industrial value added are calculated at 2015 constant prices.
81. Historical data of the total energy consumption and related indicators were revised according to the results of the Fourth National Economic Census.
In case of any differences between English translation and the original Chinese text, the Chinese edition shall prevail.