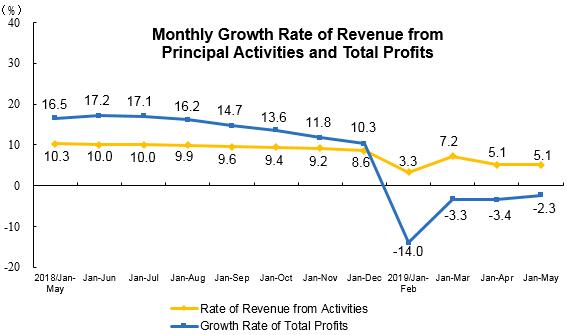
Industrial Profits Decreased 2.3 percent in the First Five Months of 2019, and the pace of decline has narrowed
In the first five months of 2019, the profits made by industrial enterprises above the designated size achieved 2,379.02 billion yuan, a year-on-year decrease of 2.3 percent (calculated on comparable basis, taking into account factors such as the standard adjustment according to the statistical system, the enhancement of statistical law enforcement, the elimination of repeating data, and the enterprise reform and divestiture, entities inventory checking of the fourth economic census, see Annotations IV for details), and the pace of decline narrowed 1.1 percentage points than that in the first four months.
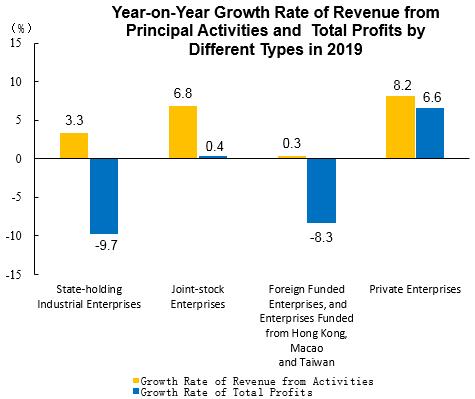
In the first five months, among the industrial enterprises above the designated size, the profits of state-holding industrial enterprises gained 734.23 billion yuan, a decrease of 9.7 percent year-on-year; that of joint-stock enterprises stood at 1,699.31 billion yuan, up by 0.4 percent; that of foreign funded enterprises, and enterprises funded from Hong Kong, Macao and Taiwan achieved 577.58 billion yuan, decreased by 8.3 percent; and that of private enterprises gained 607.27 billion yuan, an increase of 6.6 percent.
In the first five months, the profits of mining and quarrying reached 231.12 billion yuan, an increase of 4.7 percent year-on-year; that of manufacturing was 1,951.94 billion yuan, a decrease of 4.1 percent; that of production and distribution of electricity, heat, gas and water reached 195.96 billion yuan, up by 9.6 percent.
In the first five months, within 41 branches of industrial divisions, the industrial profits of 26 industrial divisions increased year-on-year, and that of 15 decreased. In view of the profit growth of major industries, that of extraction of petroleum and natural gas increased by 24.0 percent year on year, that of manufacture of special-purpose machinery up by 17.7 percent, that of manufacture of electrical machinery and equipment increased by 15.9 percent, that of production and supply of electric power and heat power up by 13.7 percent, that of manufacture of non-metallic mineral products increased by 12.9 percent, that of manufacture of general-purpose machinery up by 7.4 percent, that of manufacture of textile up by 3.2 percent, that of manufacture and processing of non-ferrous metals increased by 2.6 percent, that of processing of petroleum, coal and other fuels decreased by 51.3 percent, that of manufacture of motor vehicles decreased by 27.2 percent, that of manufacture and processing of ferrous metals decreased by 22.4 percent, that of manufacture of chemical raw material and chemical products decreased by 13.6 percent, that of manufacture of computer, communication equipment and other electronic equipment decreased by 13.0 percent, that of the profits of mining and washing of coal decreased by 9.4 percent, that of processing of food from agricultural products decreased by 3.7 percent,
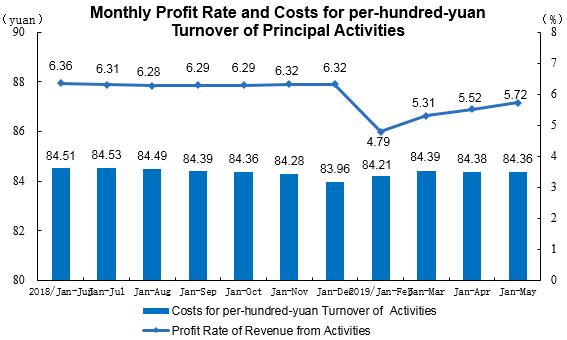
In the first five months, the revenue from activities of industrial enterprises above the designated size reached 41.61 trillion yuan, increased by 5.1 percent year-on-year. The costs of activities were 35.10 trillion yuan, up by 5.4 percent. The profit rate of revenue from activities was 5.72 percent, a decrease of 0.43 percentage point year-on-year.
By the end of May, the total assets of industrial enterprises above the designated size was 113.35 trillion yuan, increased by 6.3 percent year-on-year; the total liabilities reached 64.39 trillion yuan, increased by 5.3 percent; the total owners' equity was 48.96 trillion yuan, increased by 7.7 percent. The asset-liability ratio was 56.8 percent, a decrease of 0.6 percentage point year-on-year.
By the end of May, the total volume of Notes receivable and Accounts Receivable for industrial enterprises above designated hit 16.30 trillion yuan, went up by 4.5 percent year-on-year. The total value of finished products for industrial enterprises accounted for 4,194.49 billion yuan, increased by 4.1 percent.
In the first five months, the costs for per-hundred-yuan stood at 84.36 yuan, an increase of 0.21 yuan year-on-year; the expenses for per-hundred-yuan stood at 8.64 yuan, an increase of 0.21 yuan year-on-year.
By the end of May, the revenue activities brought by per-hundred-yuan assets above the designated size was 89.5 yuan, a decrease of 1.1 yuan year-on-year; the revenue from activities per capita was 1,328 thousand yuan, an increase of 111 thousand yuan year-on-year; the turnover days of finished goods were 17.5 days, 0.1 day decrease than that in the previous year; the days of Notes receivable and Accounts Receivable hit an average of 54.9 days, an increase of 1.4 days year-on-year.
In May, the profits made by industrial enterprises above the designated size achieved 565.56 billion yuan, an year-on-year increase of 1.1 percent, while that in April was 3.7 percent decrease year on year.
|
above the Designated Size in the First Five Months of 2019
| ||||||
| Table I | ||||||
| Indicators | Operating Income | Operating Costs | Total Profits | |||
| Jan-Apr (100 million yuan) | Increase rate Y/Y (%) | Jan-Apr (100 million yuan) | Increase rate Y/Y (%) | Jan-Apr (100 million yuan) | Increase rate Y/Y (%) | |
|
|
|
|
|
|
|
|
| Total | 416103.9 | 5.1 | 351034.7 | 5.4 | 23790.2 | -2.3 |
| Of which: Mining and Quarrying | 17939.2 | 6.1 | 12887.2 | 7.3 | 2311.2 | 4.7 |
| Manufacturing | 367622.0 | 4.9 | 311291.9 | 5.2 | 19519.4 | -4.1 |
| Production and Distribution of Electricity, Heat, Gas and Water | 30542.6 | 7.4 | 26855.7 | 6.3 | 1959.6 | 9.6 |
| Of which: State-holding Enterprises | 114112.7 | 3.3 | 92716.6 | 4.0 | 7342.3 | -9.7 |
| Joint-Stock Enterprises | 298785.8 | 6.8 | 251207.4 | 7.1 | 16993.1 | 0.4 |
| Enterprises with Funds From Hong Kong, Macao and Taiwan, and Foreign Funded Enterprises | 94630.1 | 0.3 | 79939.9 | 0.7 | 5775.8 | -8.3 |
| Of which: Private Enterprises | 126642.3 | 8.2 | 110194.0 | 8.0 | 6072.7 | 6.6 |
|
|
|
|
|
|
|
|
Note : 1.Due to the overlap of economic type grouping, the total is not equal to the total of sub-items.
2.Due to the rounding-off reasons, the subentries may not add up to the aggregate totals, no adjustment.
| Quality Performance Indicators of Industrial Enterprises above the Designated Size in the First Five Months of 2019
|
| ||||||||
| Table II | |||||||||
| Indicators | Profit Rate of Revenue | Costs for per-hundred-yuan |
Expenses for per-hundred-yuan | Revenue from Brought by per Hundred yuan Assets | Per captal Income | Asset-Liability Ratio | Turnover Days of Finished Goods | Average Payback Period of Notes & Accounts Receivable | |
| Jan-May (%) | Jan-May (yuan) | Jan-May (yuan) | By the end of May (yuan) | By the end of May (10 thousand yuan/ person) | By the end of May (%) | By the end of May (days) | By the end of May (days) | ||
|
|
|
|
|
|
|
|
| ||
| Total | 5.72 | 84.36 | 8.64 | 89.5 | 132.8 | 56.8 | 17.5 | 54.9 | |
| Of which: Mining and Quarrying | 12.88 | 71.84 | 11.37 | 44.7 | 90.7 | 59.5 | 13.1 | 45.4 | |
| Manufacturing | 5.31 | 84.68 | 8.70 | 105.0 | 131.3 | 55.9 | 19.2 | 57.0 | |
| Production and Distribution of Electricity, Heat, Gas and Water | 6.42 | 87.93 | 6.27 | 41.1 | 225.3 | 59.6 | 0.5 | 34.7 | |
| Of which: State-holding Enterprises | 6.43 | 81.25 | 7.86 | 61.6 | 202.8 | 58.3 | 14.7 | 50.1 | |
| Joint-Stock Enterprises | 5.69 | 84.08 | 8.78 | 87.3 | 132.4 | 58.2 | 18.0 | 52.4 | |
| Enterprises with Funds From Hong Kong, Macao and Taiwan, and Foreign Funded Enterprises | 6.10 | 84.48 | 8.96 | 104.3 | 128.1 | 53.1 | 18.4 | 69.5 | |
| Of which: Private Enterprises | 4.80 | 87.01 | 7.94 | 132.3 | 112.1 | 58.1 | 16.8 | 45.1 | |
|
|
|
|
|
|
|
|
|
| |
|
|
|
|
|
|
|
|
|
|
|
| Key Financial Indicators of Industrial Enterprises above the Designated Size in the First Five Months of 2019 (Group by Industries)
| ||||||
| Table III | ||||||
| Indicators | Operating Income | Operating Costs | Total Profits | |||
| Jan- May (100 million yuan) | Increase rate Y/Y (%) | Jan- May (100 million yuan) | Increase rate Y/Y (%) | Jan- May (100 million yuan) | Increase rate Y/Y (%) | |
|
|
|
|
|
|
|
|
| Total | 416103.9 | 5.1 | 351034.7 | 5.4 | 23790.2 | -2.3 |
| Mining and Washing of Coal | 9518.4 | 4.4 | 6813.6 | 8.3 | 1110.6 | -9.4 |
| Extraction of Petroleum and Natural Gas | 3348.8 | 6.2 | 1945.2 | 1.3 | 841.4 | 24.0 |
| Mining of Ferrous Metal Ores | 1352.7 | 11.1 | 1085.7 | 6.4 | 81.6 | 229.0 |
| Mining of Non-Ferrous Metal Ores | 1311.3 | -0.6 | 1018.4 | 2.2 | 127.2 | -26.3 |
| Mining And Processing of Nonmetal Ores | 1296.9 | 6.0 | 1011.2 | 4.8 | 104.5 | 16.0 |
| Mining Support Service Activities | 1099.9 | 25.7 | 1004.0 | 23.7 | 45.6 | 221.1 |
| Mining of Other Ores N.E.C | 11.2 | 12.0 | 9.0 | 16.9 | 0.4 | -33.3 |
| Processing of Food From Agricultural Products | 18660.4 | 5.3 | 16936.3 | 5.8 | 631.7 | -3.7 |
| Manufacture of Foods | 7457.1 | 5.8 | 5830.4 | 6.0 | 646.7 | 17.3 |
| Manufacture of Wines, Beverage and Refined Tea | 6259.8 | 5.8 | 4198.9 | 3.6 | 936.5 | 17.9 |
| Manufacture of Cigarettes And Tobacco | 5229.7 | 10.8 | 1745.2 | 6.7 | 605.2 | 23.9 |
| Manufacture of Textile | 10062.2 | 3.1 | 8991.9 | 2.7 | 391.1 | 3.2 |
| Manufacture of Textile Wearing Apparel And Ornament | 6214.0 | 2.5 | 5287.1 | 2.3 | 307.9 | -1.3 |
| Manufacture of Leather, Fur, Feather Aad Its Products | 4647.5 | 3.0 | 4028.5 | 2.5 | 252.5 | 7.0 |
| Processing of Timbers, Manufacture of Wood, Bamboo, Rattan, Palm, and Straw Products | 3512.1 | 4.6 | 3117.6 | 4.7 | 148.0 | -1.5 |
| Manufacture of Furniture | 2705.1 | 3.7 | 2255.5 | 2.5 | 155.5 | 13.5 |
| Manufacture of Paper and Paper Products | 5410.1 | -1.2 | 4722.8 | 0.2 | 221.5 | -30.3 |
| Printing, Reproduction of Recording Media | 2475.2 | 2.5 | 2077.8 | 1.9 | 145.0 | 5.7 |
| Manufacture of Articles for Culture, Education, Artwork, Sport and Entertainment Activity | 5329.0 | 7.1 | 4647.9 | 6.1 | 259.2 | 28.3 |
| Petroleum, coal and other Fuel Manufacturing | 19241.6 | 4.3 | 16011.6 | 8.2 | 526.0 | -51.3 |
| Manufacture of Chemical Raw Material and Chemical Products | 27739.9 | 0.9 | 23373.5 | 2.0 | 1770.5 | -13.6 |
| Manufacture of Medicines | 10012.1 | 9.5 | 5718.0 | 6.9 | 1278.9 | 10.9 |
| Manufacture of Chemical Fibres | 3502.4 | 8.5 | 3219.5 | 9.9 | 107.2 | -16.6 |
| Manufacture of Rubber and Plastics Products | 9946.9 | 2.5 | 8534.7 | 1.8 | 484.0 | 11.5 |
| Manufacture of Non-Metallic Mineral Products | 20232.4 | 13.4 | 16762.7 | 13.7 | 1655.2 | 12.9 |
| Manufacture and Processing of Ferrous Metals | 28330.6 | 9.1 | 25971.8 | 11.8 | 1159.9 | -22.4 |
| Manufacture and Processing of Non-Ferrous Metals | 21997.1 | 6.5 | 20759.1 | 6.9 | 476.1 | 2.6 |
| Manufacture of Fabricated Metal Products | 13737.7 | 7.0 | 12032.5 | 6.3 | 576.2 | 18.6 |
| Manufacture of General-Purpose Machinery | 15398.2 | 5.3 | 12785.3 | 4.9 | 938.9 | 7.4 |
| Manufacture of Special-Purpose Machinery | 12059.4 | 8.8 | 9728.7 | 7.5 | 806.3 | 17.7 |
| Manufacture of Motor Vehicles | 31942.8 | -6.2 | 27074.0 | -5.1 | 1881.6 | -27.2 |
| Manufacture of Railway Locomotives, Building of Ships and Boats, Manufacture of Air and Spacecrafts and Other Transportation Equipments | 4213.5 | 7.9 | 3581.0 | 6.7 | 220.2 | 42.9 |
| Manufacture of Electrical Machinery and Equipment | 25166.7 | 6.0 | 21331.7 | 5.3 | 1284.8 | 15.9 |
| Manufacture of Computer, Communication Equipment and Other Electronic Equipment | 40624.6 | 6.4 | 35988.6 | 6.5 | 1305.7 | -13.0 |
| Manufacture of Measuring Instrument and Meter | 2816.1 | 7.1 | 2189.7 | 6.9 | 206.1 | (注2) |
| Other Manufacturing | 648.8 | 3.2 | 548.6 | 2.1 | 36.1 | 8.7 |
| Waste Recycling and Recovery | 1602.5 | 10.6 | 1469.2 | 10.9 | 76.9 | 8.8 |
| Repair of Fabricated Metal Products, Machinery and Equipment | 446.6 | 8.7 | 371.8 | 6.3 | 28.0 | 12.4 |
| Production and Supply of Electric Power and Heat Power | 25736.2 | 5.8 | 22790.1 | 4.3 | 1643.5 | 13.7 |
| Production and Distribution of Gas | 3731.2 | 19.5 | 3282.4 | 22.3 | 221.1 | -13.7 |
| Production and Distribution of Water | 1075.2 | 8.2 | 783.2 | 7.8 | 95.0 | 10.2 |
|
|
|
|
|
|
|
|
Note : 1. Mining and Support Service Activities had a loss of 0.27 billion yuan in the same period of last year.
2. Due to the rounding-off reasons, the subentries may not add up to the aggregate totals, no adjustment.
Annotations:
I. Explanatory Notes:
1. Total Profits: refer to the surplus of various revenue deducting various costs in the production process of enterprises, reflecting the total profit and loss in the report period.
2. Operating income: refers to the total amount of revenue of enterprises recognized by the principal business and other business operations.
4. Operating costs: refers to the total costs of enterprises incurred by the principal business and other business operations.
4. Total Assets: refers to the resources which are gotten from past transactions or events, owned or controlled by enterprises, and expected to bring economic benefits to the enterprises.
5. Total Liabilities: refers to the current obligation generated from past transactions or events, and expected an outflow of economic benefits from the enterprises.
6. Total Owners' Equity: refers to the residual interests after deducting liabilities, which belongs to the enterprises owners.
9. Notes receivable and Accounts Receivable: refers to the enterprise's rights due to the sale of goods, services, and other business activities, as well as commercial drafts received, including bank acceptance bills and commercial acceptance bills.
In June 2018, the Ministry of Finance issued the Notice on Amending the 2018 Annual Financial Statements of General Enterprises (Accounting [2018] No. 15), and revised the financial statement format of general enterprises. The enterprise balance sheet is no longer listed the item of “Accounts Receivable”, and the items of “receivable notes and accounts receivable” are listed instead. In line with the corporate financial statements, from 2019, stop to release the monthly “accounts receivable” data, and the “receivable notes and accounts receivable” data will be released. Relevant indicators are adjusted accordingly.
10. Finished Goods: refers to manufactured products which are ready for sale by the end of report period.
11. Profit Rate of Revenue from Principal Activities = total profits / revenue from principal activities × 100%, unit: %.
12. Costs for per-hundred-yuan Turnover of Principal Activities = the costs of revenue from principal activities / the revenue from principal activities ×100, unit: yuan.
13. Expenses for per-hundred-yuan Turnover of Principal Activities = (selling expenses + administrative expenses + financial expenses) / the revenue from principal activities ×100, unit: yuan.
14. Revenue from Activities Brought by per Hundred yuan Assets = the revenue from activities / average assets / the cumulative number of months × 12 × 100, unit: yuan.
15. Revenue from Activities per Capita = revenue from activities / average number of employment / the cumulative number of months × 12, unit: 10 thousand yuan/ person.
16. Asset-Liability Ratio = total liabilities / total assets × 100%, unit: %.
17. Turnover Days of Finished Goods = 360 × average finished goods / revenue from activities × the cumulative number of months / 12, unit: days.
18. Days Sales Outstanding (the number of days on average a company takes to collect its accounts receivable) = 360 ×average accounts receivable / revenue from activities ×the cumulative number of months / 12, unit: days.
19. In the columns of increase rate year-on-year of the three tables above, the “note” refers to negative total profits in the same period last year, which means loss; the positive value refers to a year-on-year increase of profits; the negative value which is greater than or equal to -100% refers to a year-on-year decrease of profits; the value less than -100% indicates turning gain in the same period last year into loss in current period; and the value of 0 indicates that the profits remain at the same level year-on-year.
II. In order to fully reflect the income scale of industrial enterprises, from 2019, replace “principle revenue from activities” with “revenue from activities”. Relevant indicators are adjusted accordingly.
III. The collective enterprise data released in the past refers to the enterprise whose registration type is “collective”. With the establishment of the modern enterprise system, the proportion of enterprises registered as “collective” is declining (in 2018, the revenue from activities of collective enterprises accounts for the full industrial enterprises above designated size is only 0.18%), so from 2019, the date of the collective enterprise release will be cancel.
IV. The growth rates of the total profits and revenue from activities of industrial enterprises above designated size are calculated on a comparable basis. There are incomparable factors between the data in the reporting period and the same indicator data published in the previous year, which cannot be directly compared to calculate the growth rate. The main reasons are: (1) According to the statistical system, the survay coverage of industrial enterprises above designated size is adjusted regularly every year. Each year, some companies will be included in the survey after having reached designated size, and some will exit the survey due to their smaller size, and there are also influence of new built and starting enterprises, bankruptcies, and companies that have been suspended or sold. (2) By strengthening the statistical law enforcement, the enterprises found in the statistical law enforcement inspection that do not meet the industrial statistics requirements above designated size have been cleared, and relevant bases have been revised in accordance with regulations. (3) Strengthen data quality management and eliminate the cross-regional and cross-industry repeated calculation. According to the latest investigation of the organizational structure carried out by the National Bureau of Statistics, since the fourth quarter of last year, the cross-regional and cross-industry repeated calculation of enterprise groups (companies) has been eliminated. (4) After the implementation of the “reform of replacing business tax with value-added tax” policy, the service industry enterprises turned to pay value-added tax of which the tax rate was lower. The industrial enterprises have gradually divested their internal non-industrial production and operation activities, and turned to the service industry, which had diminished the financial data of industrial enterprises.
V. Statistical Coverage
Industrial enterprises above the designated size, which refer to industrial enterprises with revenue from principal activities over 20 million yuan.
VI. Data Collection
The Financial Report of Enterprises Above the Designated Size conducts complete survey by month (the data on January are not required to report).
VII. Industrial Classification Standard
The Industrial Classification for National Economic Activities (GB/T4754-2017) was implemented, please refer to http://www.stats.gov.cn/tjsj/tjbz/hyflbz.