Statistical Communiqué of the People's Republic of China on the 2016 National Economic and Social Development
STATISTICAL COMMUNIQUÉ OF
THE PEOPLE'S REPUBLIC OF CHINA
ON THE 2016 NATIONAL
ECONOMIC AND SOCIAL DEVELOPMENT[1]
National Bureau of Statistics of China
February 28, 2017
In 2016, faced with the complicated domestic and international environment and the heavy tasks to maintain the development, reform and stability, under the leadership of the Central Committee of the Communist Party of China with General Secretary Xi Jinping as the core, people from all regions and departments followed the guiding principles of the 18th National Congress of the Communist Party of China and the third, forth, fifth and sixth plenary sessions of the 18th Central Committee of Communist Party of China, implemented the decisions and arrangements made by the CPC Central Committee and the State Council, carried forward the overall plan for promoting all-round economic, political, cultural, social and ecological progress as well as the “Four Pronged Comprehensive Strategy” in a coordinated way, adhered to the general work guideline of making progress while maintaining stability, followed the new vision of development, insisted on supply-side structural reform as the mainline, appropriately expanded the aggregate demand, staunchly advanced reforms, properly responded to risks and challenges, and shaped good social expectations. As a result, the national economy has achieved steady and sound development, getting off to a good start during the 13th Five-Year Plan period.
I. General Outlook
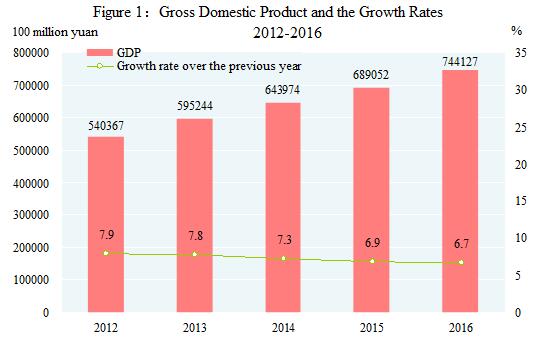
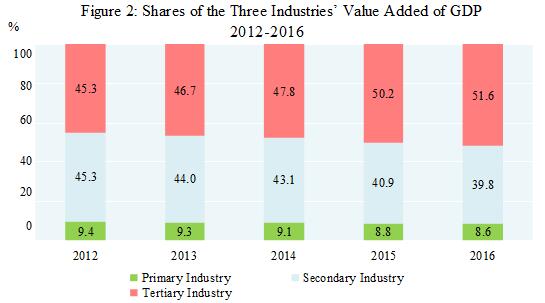
According to preliminary accounting, the gross domestic product (GDP)[2] in 2016 was 74,412.7 billion yuan, up by 6.7 percent over the previous year. Of this total, the value added of the primary industry was 6,367.1 billion yuan, up by 3.3 percent, that of the secondary industry was 29,623.6 billion yuan, up by 6.1 percent and that of the tertiary industry was 38,422.1 billion yuan, up by 7.8 percent. The value added of the primary industry accounted for 8.6 percent of the GDP; that of the secondary industry accounted for 39.8 percent; and that of the tertiary industry accounted for 51.6 percent, 1.4 percentage points higher than that in the previous year. The per capita GDP in 2016 was 53,980 yuan, up by 6.1 percent compared with the previous year. The gross national income[3] in 2016 was 74,235.2 billion yuan, up by 6.9 percent over the previous year.
By the end of 2016, the total number of Chinese population at the mainland reached 1,382.71 million, an increase of 8.09 million over that at the end of 2015. Of this total, urban permanent residents numbered 792.98 million, accounting for 57.35 percent of the total population (the urbanization rate of permanent residents), and 1.25 percentage points higher than the previous year. The urbanization rate of population with household registration was 41.2 percent, 1.3 percentage points higher than that at the end of 2015. The year 2016 saw 17.86 million births, a crude birth rate of 12.95 per thousand, and 9.77 million deaths, or a crude death rate of 7.09 per thousand. The natural growth rate was 5.86 per thousand. The number of population who live in places other than their household registration area[4] reached 292 million, of which 245 million were floating population[5].
Table 1: Population and Its Composition by the End of 2016
|
Item |
Population (Year-end figure) (10,000 persons) |
Proportion (%) |
|
National Total |
138271 |
100.0 |
|
Of which: Urban |
79298 |
57.35 |
|
Rural |
58973 |
42.65 |
|
Of which: Male |
70815 |
51.2 |
|
Female |
67456 |
48.8 |
|
Of which: Aged 0-15 (under the age of 16)[6] |
24438 |
17.7 |
|
Aged 16-59 (under the age of 60) |
90747 |
65.6 |
|
Aged 60 and above |
23086 |
16.7 |
|
Of which: Aged 65 and above |
15003 |
10.8 |
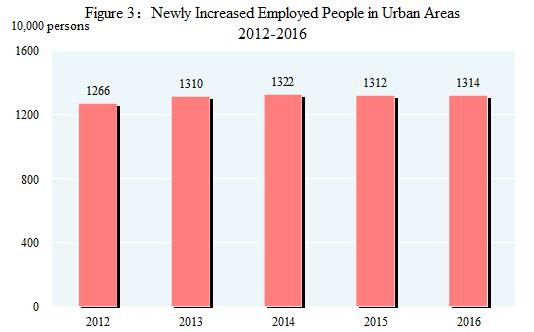
At the end of 2016, the number of employed people in China was 776.03 million, and that in urban areas was 414.28 million. The newly increased employed people in urban areas numbered 13.14 million. The registered urban unemployment rate was 4.02 percent at the year end. The total number of migrant workers[7] in 2016 was 281.71 million, up by 1.5 percent over that of 2015. Of which, the number of migrant workers who left their hometowns and worked in other places was 169.34 million, increased by 0.3 percent, and those who worked in their own localities reached112.37 million, up by 3.4 percent.
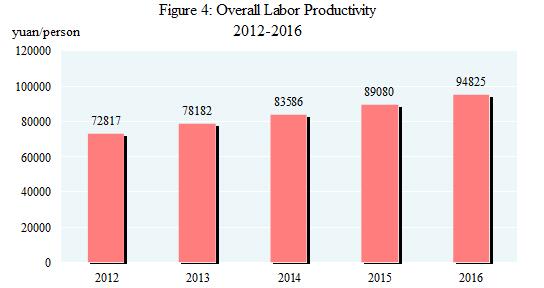
The overall labor productivity[8] was 94,825 yuan per person in 2016, an increase of 6.4 percent compared with that in 2015.
The consumer prices in 2016 went up by 2.0 percent over the previous year. The producer prices went down by 1.4 percent and the purchasing prices for manufactured goods went down by 2.0 percent. The prices for investment in fixed assets dropped by 0.6 percent. The producer prices for farm products[9] went up by 3.4 percent.
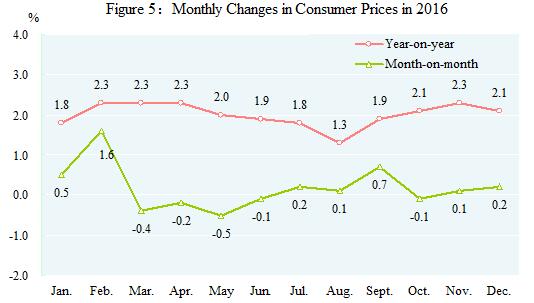
Table 2: Changes of Consumer Prices in 2016
Unit: %
Item |
National Average |
|
|
Urban |
Rural |
||
|
General level of consumer prices |
2.0 |
2.1 |
1.9 |
|
Of which: Food, tobacco and liquor |
3.8 |
3.7 |
4.0 |
|
Clothing |
1.4 |
1.5 |
1.3 |
|
Residence[10] |
1.6 |
1.9 |
0.6 |
|
Household facilities, articles and services |
0.5 |
0.5 |
0.2 |
|
Transportation and telecommunication |
-1.3 |
-1.4 |
-1.1 |
|
Education, culture and recreation |
1.6 |
1.5 |
1.9 |
|
Health care and medical services |
3.8 |
4.4 |
2.5 |
|
Miscellaneous goods and services |
2.8 |
2.9 |
2.2 |
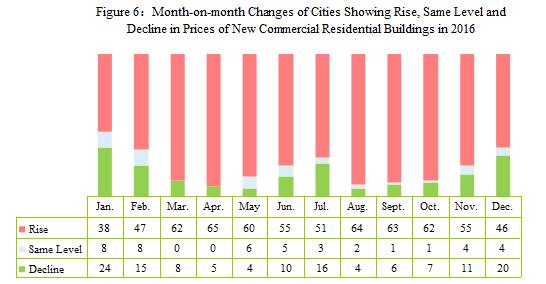
In December, out of the 70 large-and-medium-sized cities, 65 cities showed a year-on-year rise in sales prices of new commercial residential buildings, and 5 cities experienced a decline. 46 cities showed a month-on-month rise which was 19 less than the highest record in 2016; 4 cities remained unchanged, and 20 cities experienced a decline.
The general public budget revenue reached 15,955.2 billion yuan in 2016, an increase of 682.8 billion yuan or up by 4.5 percent over that of the same coverage[11] in the previous year. Of this total, the taxes collected in the whole year reached 13,035.4 billion yuan, an increase of 543.2 billion yuan or up by 4.3 percent.
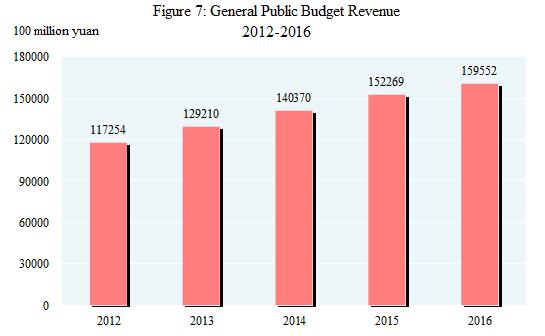
Note: Data for general public budget revenue from 2012 to 2015 as shown in the figure were final accounts, and that of 2016 was executive accounts.
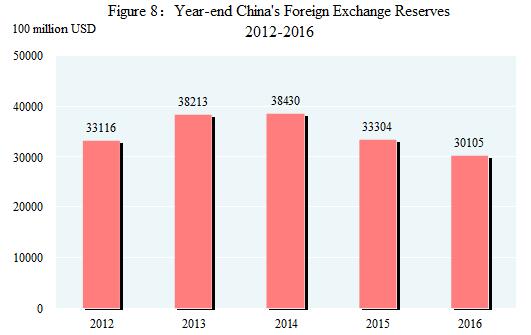
At the end of 2016, China’s foreign exchange reserves reached 3,010.5 billion US dollars, a decrease of 319.8 billion US dollars as compared with that at the end of 2015. The average exchange rate of the year was 6.6423 RMB to 1 USD, depreciated by 6.2 percent over that of 2015.
II. Agriculture
In 2016, the sown area of grain was 113.03 million hectares, a drop of 310 thousand hectares compared with that in 2015. Of this total, the sown area of wheat was 24.19 million hectares, an increase of 50 thousand hectares; the sown area of rice was 30.16 million hectares, a decrease of 50 thousand hectares; the sown area of corn was 36.76 million hectares, a decrease of 1.36 million hectares. The sown area of cotton was 3.38 million hectares, a decrease of 420 thousand hectares; the sown area of oil-bearing crops was 14.12 million hectares, an increase of 80 thousand hectares; the sown area of sugar crops was 1.68 million hectares, a decrease of 60 thousand hectares.
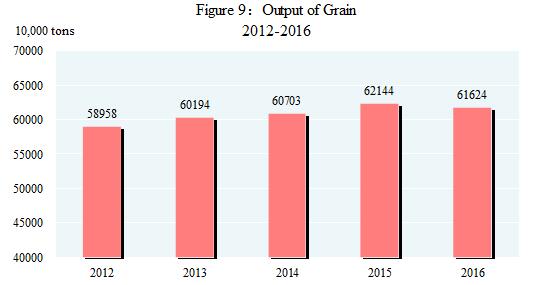
The total output of grain in 2016 was 616.24 million tons, a decrease of 5.20 million tons or down by 0.8 percent over the previous year. Of this total, the output of summer crops was 139.20 million tons, down by 1.2 percent, and that of the early rice was 32.78 million tons, down by 2.7 percent over the previous year. The output of autumn grain was 444.26 million tons, down by 0.6 percent. The output of cereal was 565.17 million tons, a decrease of 1.2 percent, among which the output of rice was 206.93 million tons, down by 0.6 percent; that of wheat was 128.85 million tons, down by 1.0 percent; and that of corn was 219.55 million tons, down by 2.3 percent.
In 2016, the output of cotton was 5.34 million tons, a decrease of 4.6 percent over the previous year, that of oil-bearing crops was 36.13 million tons, an increase of 2.2 percent and that of sugar crops was 122.99 million tons, a decrease of 1.6 percent, and that of tea was 2.41 million tons, up by 7.4 percent.
The total output of meat for the year reached 85.40 million tons, down by 1.0 percent over the previous year. Of this total, the output of pork was 52.99 million tons, down by 3.4 percent; that of beef was 7.17 million tons, increased by 2.4 percent; and that of mutton was 4.59 million tons, an increase of 4.2 percent, and that of poultry was 18.88 million tons, an increase of 3.4 percent. The total output of eggs was 30.95 million tons, up by 3.2 percent. The production of milk was 36.02 million tons, down by 4.1 percent. At the end of the year, 435.04 million pigs were registered in the total stocks, down by 3.6 percent, and 685.02 million pigs were slaughtered, down by 3.3 percent.
The total output of aquatic products in 2016 was 69.00 million tons, up by 3.0 percent over the previous year. Of this total, the output of cultured aquatic products was 51.56 million tons, up by 4.4 percent; and that of fished aquatic products was 17.44 million tons, down by 1.0 percent over the previous year.
The total production of timber for the year 2016 reached 66.83 million cubic meters, a decrease of 7.0 percent compared with the previous year.
Over 1.18 million hectares of farmland were newly equipped with effective irrigation systems and another 2.11 million hectares of farmland was newly equipped with water-saving irrigation systems.
III. Industry and Construction
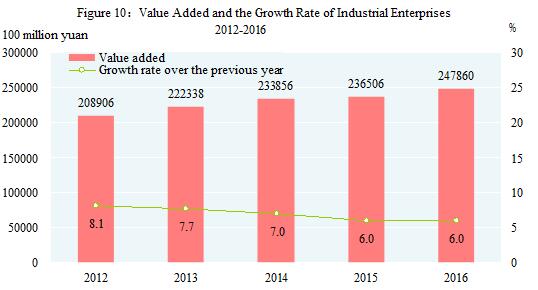
In 2016, the total value added of the industrial sector was 24,786.0 billion yuan, up by 6.0 percent over the previous year. The value added of industrial enterprises above the designated size increased by 6.0 percent. Of the industrial enterprises above the designated size, in terms of ownership, the value added of the state-holding enterprises grew by 2.0 percent, that of the collective enterprises down by 1.3 percent, that of the share-holding enterprises up by 6.9 percent, that of the enterprises by foreign investors and investors from Hong Kong, Macao and Taiwan up by 4.5 percent and that of private enterprises up by 7.5 percent. In terms of sectors, the value added of the mining industry dropped by 1.0 percent, that of manufacturing up by 6.8 percent and that of the production and supply of electricity, heat power, gas and water rose by 5.5 percent.
In 2016, of the industrial enterprises above the designated size, the value added for processing of food from agricultural and sideline products was up by 6.1 percent over the previous year; for textile industry up by 5.5 percent; for manufacture of raw chemical materials and chemical products up by 7.7 percent; for manufacture of non-metallic mineral products up by 6.5 percent, for smelting and pressing of non-ferrous metals down by 1.7 percent; for manufacture of general machinery up by 5.9 percent; for manufacture of special purpose machinery up by 6.7 percent; for manufacture of automobiles up by 15.5 percent; for manufacture of electrical machinery and equipment up by 8.5 percent; for manufacture of computers, communication equipment and other electronic equipment up by 10.0 percent; for production and supply of electricity and heat power up by 4.8 percent. The value added of strategic emerging industries [12] increased by 10.5 percent. The value added of the high technology manufacturing industry[13] was up by 10.8 percent over the previous year, accounting for 12.4 percent of that of industrial enterprises above the designated size. The value added for manufacture of equipment[14] was up by 9.5 percent, accounting for 32.9 percent of that of industrial enterprises above the designated size. The growth of the value added for the six major high energy consuming industries[15] was 5.2 percent, accounting for 28.1 percent of the value added of industrial enterprises above the designated size.
Table 3: Output of Major Industrial Products and Their Growth Rates in 2016
|
Product |
Unit |
Output |
Increase over 2015 (%) |
|
Yarn |
10000 tons |
3732.6 |
5.5 |
|
Cloth |
100 million meters |
906.8 |
1.6 |
|
Chemical fiber |
10000 tons |
4943.7 |
2.3 |
|
Refined sugar (final product) |
10000 tons |
1443.3 |
-2.1 |
|
Cigarettes |
100 million |
23825.8 |
-8.0 |
|
Color TV sets |
10000 |
15769.6 |
8.9 |
|
Of which: LCD TV sets |
10000 |
15713.6 |
9.2 |
|
Of which: Smart TV sets |
10000 |
9310.1 |
11.1 |
|
Home refrigerators |
10000 |
8481.6 |
6.1 |
|
Air conditioners |
10000 |
14342.4 |
1.0 |
|
Primary energy output |
100 million tons of standard coal equivalent |
34.6 |
-4.2 |
|
Coal |
100 million tons |
34.1 |
-9.0 |
|
Crude petroleum oil |
10000 tons |
19968.5 |
-6.9 |
|
Natural gas |
100 million cubic meters |
1368.7 |
1.7 |
|
Electricity |
100 million kilowatt-hours |
61424.9 |
5.6 |
|
Of which: Thermal power[16] |
100 million kilowatt-hours |
44370.7 |
3.6 |
|
Hydropower |
100 million kilowatt-hours |
11933.7 |
5.6 |
|
Nuclear-power |
100 million kilowatt-hours |
2132.9 |
24.9 |
|
Crude steel |
10000 tons |
80836.6 |
0.6 |
|
Rolled steel[17] |
10000 tons |
113801.2 |
1.3 |
|
Ten kinds of nonferrous metals |
10000 tons |
5310.3 |
3.0 |
|
Of which: Refined copper (copper) |
10000 tons |
843.6 |
6.0 |
|
Aluminum electrolyze |
10000 tons |
3187.3 |
1.5 |
|
Cement |
100 million tons |
24.1 |
2.3 |
|
Sulfuric acid (100%) |
10000 tons |
8889.1 |
-1.0 |
|
Caustic soda (100%) |
10000 tons |
3283.9 |
8.7 |
|
Ethylene |
10000 tons |
1781.1 |
3.9 |
|
Chemical fertilizers (100 percent equivalent) |
10000 tons |
7128.6 |
-4.1 |
|
Power generation equipment |
10000 kilowatts |
13218.4 |
6.3 |
|
Motor vehicles |
10000 |
2811.9 |
14.8 |
|
Of which: Basic passenger cars (cars) |
10000 |
1211.1 |
4.1 |
|
Sport utility vehicles (SUVs) |
10000 |
914.4 |
51.8 |
|
Of which: New energy cars |
10000 |
45.9 |
40.0 |
|
Large and medium tractors |
10000 |
63.0 |
-8.5 |
|
Integrated circuits |
100 million pieces |
1318.0 |
21.2 |
|
Program-controlled switchboards |
10000 lines |
1457.7 |
-22.5 |
|
Mobile telephones |
10000 |
205819.3 |
13.6 |
|
Of which: Smart phones |
10000 |
153764.1 |
9.9 |
|
Micro computer equipment |
10000 |
29008.5 |
-7.7 |
|
Industrial robots |
sets |
72426.0 |
30.4 |
By the end of 2016, the installed power generation capacity was 1,645.75 million kilowatts, up by 8.2 percent over that at the end of 2015, among which[18] the installed thermal power generation capacity was 1,053.88 million kilowatts, up by 5.3 percent; the installed hydropower generation capacity was 332.11 million kilowatts, up by 3.9 percent; the installed nuclear power generation capacity was 33.64 million kilowatts, up by 23.8 percent. The installed grid-connected wind power generation capacity was 148.64 million kilowatts, up by 13.2 percent and the installed grid-connected solar power generation capacity was 77.42 million kilowatts, an increase of 81.6 percent.
The profits made by the industrial enterprises above the designated size in 2016 were 6,880.3 billion yuan, an increase of 8.5 percent over the previous year. By ownership, the profits of state-holding enterprises were 1,175.1 billion yuan, up by 6.7 percent; those of collective enterprises were 47.7 billion yuan, down by 4.2 percent; those of share-holding enterprises 4,719.7 billion yuan, up by 8.3 percent; those of the enterprises by foreign investors and investors from Hong Kong, Macao and Taiwan 1,735.2 billion yuan, up by 12.1 percent; and those of private enterprises were 2,432.5 billion yuan, a rise of 4.8 percent. In terms of different sectors, the profit of mining was 182.5 billion yuan, down by 27.5 percent compared with the previous year; those of manufacturing 6,239.8 billion yuan, up by 12.3 percent; those of the production and supply of electricity, heat power, gas and water 458.0 billion yuan, down by 14.3 percent. In 2016, the cost for per-hundred-yuan turnover of principal activities was 85.52 yuan, 0.1 yuan less than that of the previous year. At the end of 2016, the asset-liability ratio of the industrial enterprises above the designated size was 55.8 percent, 0.4 percentage point less than that at the end of 2015.
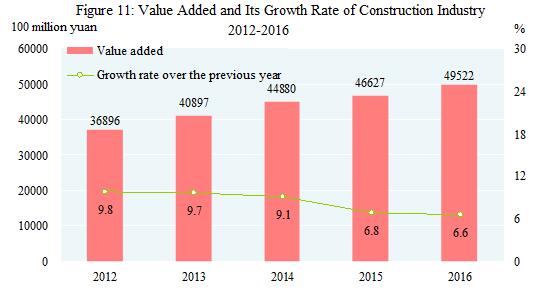
In 2016, the value added of construction enterprises in China was 4,952.2 billion yuan, up by 6.6 percent over the previous year. The profits made by construction enterprises qualified for general contracts and specialized contracts reached 674.5 billion yuan, up by 4.6 percent, of which the profits made by state-holding enterprises were 187.9 billion yuan, up by 6.8 percent.
IV. Investment in Fixed Assets
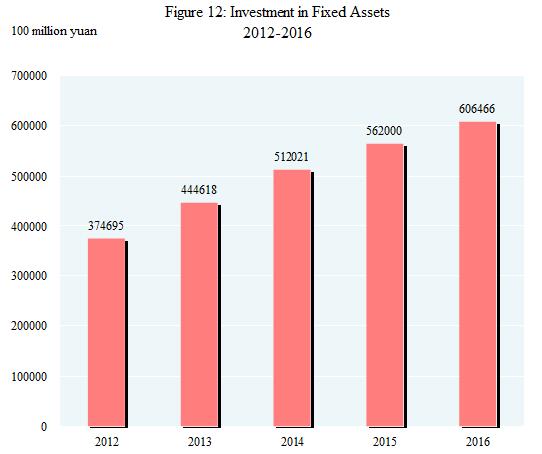
The total investment in fixed assets of the country in 2016 was 60,646.6 billion yuan, up by 7.9 percent over the previous year. The real growth was 8.6 percent after deducting the price factors. Of the total investment, the investment in fixed assets (excluding rural households) was 59,650.1 billion yuan, up by 8.1 percent. By regions[19], the investment in eastern areas was 24,966.5 billion yuan, up by 9.1 percent over the previous year, in central areas 15,676.2 billion yuan, a growth of 12.0 percent, in western areas 15,405.4 billion yuan, a growth of 12.2 percent, and in northeastern areas 3,064.2 billion yuan, down by 23.5 percent.
In the investment in fixed assets (excluding rural households), the investment in the primary industry was 1,883.8 billion yuan, up by 21.1 percent; that in the secondary industry was 23,182.6 billion yuan, up by 3.5 percent; and that in the tertiary industry was 34,583.7 billion yuan, up by 10.9 percent. The investment in infrastructure[20] was 11,887.8 billion yuan, up by 17.4 percent, accounting for 19.9 percent of the investment in fixed assets (excluding rural households). The private investment[21]in fixed assets was 36,521.9 billion yuan, an increase of 3.2 percent, accounting for 61.2 percent of the total investment in fixed assets (excluding rural households). The investment in high technology industries[22] was 3,774.7 billion yuan, up by 15.8 percent, accounting for 6.3 percent of the total investment in fixed assets (excluding rural households). The investment in the six major high energy consuming industries was 6,637.6 billion yuan, up by 3.1 percent, accounting for 11.1 percent of the investment in fixed assets (excluding rural households). The investment in agriculture, forestry, animal husbandry and fishery, water conservancy, environmental protection and other weak areas grew rapidly.
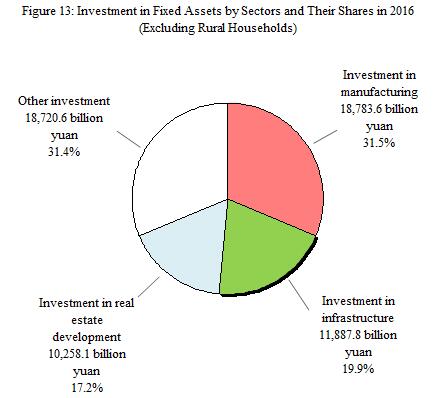
Table 4: Fixed Assets Investment (Excluding Rural Households) and Its Growth Rate by Sectors in 2016
|
Sector |
Investment (100 million yuan) |
Increase over 2015 (%) |
|
Total |
596501 |
8.1 |
|
Agriculture, Forestry, Animal Husbandry and Fishery |
22774 |
19.5 |
|
Mining |
10320 |
-20.4 |
|
Manufacturing |
187836 |
4.2 |
|
Production and Supply of Electricity, Heat, Gas and Water |
29736 |
11.3 |
|
Construction |
4577 |
-6.5 |
|
Wholesale and Retail Trades |
17939 |
-4.0 |
|
Transport, Storage and Post |
53628 |
9.5 |
|
Hotels and Catering Services |
5947 |
-8.6 |
|
Information Transmission, Software and Information Technology |
6319 |
14.5 |
|
Financial Intermediation |
1310 |
-4.2 |
|
Real Estate[23] |
135284 |
6.8 |
|
Leasing and Business Services |
12316 |
30.5 |
|
Scientific Research and Technical Services |
5568 |
17.2 |
|
Management of Water Conservancy, Environment and Public Facilities |
68647 |
23.3 |
|
Services to Households, Repair and Other Services |
2677 |
1.8 |
|
Education |
9324 |
20.7 |
|
Health and Social Service |
6282 |
21.4 |
|
Culture, Sports and Entertainment |
7830 |
16.4 |
|
Public Management, Social Security and Social Organization |
8188 |
4.3 |
Table 5: Newly Increased Production and Operation Capacity through Fixed Assets Investment in 2016
|
Item |
Unit |
Volume |
|
Newly increased power transformer equipment with a capacity of over 220 kilovolts |
10000 kilovolt-amperes |
24336 |
|
New railways put into operation |
kilometer |
3281 |
|
Of which, high-speed railways[24] |
kilometer |
1903 |
|
Extended or new double-track railways put into operation |
kilometer |
3612 |
|
Electrified railways put into operation |
kilometer |
5899 |
|
Length of New and rebuilt highways |
kilometer |
324898 |
|
Of which: Expressways |
kilometer |
6745 |
|
New cargo-handling capacity of berths for over 10,000-tonnage ships |
10000 tons |
32436 |
|
New civil transportation airports |
- |
8 |
|
New lines of optical-fiber cables |
10000 km |
554 |
In 2016, the investment in real estate development was 10,258.1 billion yuan, up by 6.9 percent. Of this total, the investment in residential buildings reached 6,870.4 billion yuan, an increase of 6.4 percent, that in office buildings was 653.3 billion yuan, up by 5.2 percent, and that in buildings for commercial business was 1,583.8 billion yuan, up by 8.4 percent. At the end of 2016, the floor space of commercial buildings for sale was 695.39 million square meters, 23.14 million square meters less than that at the end of 2015; the floor space of the commercial residential buildings for sale was 402.57 million square meters, 49.91 million square meters less than that at the end of 2015.
In 2016, 6.06 million housing units were started to be rebuilt in rundown urban areas nationwide. The number of housing units rebuilt in rundown areas and public rental housing built was 6.58 million. In rural areas of China, among the poverty-stricken households that had their economic status registered at the local governments, 1.58[25] million of them had witnessed their dilapidate houses rebuilt and renovated in 2016.
Table 6: Main Indicators for Real Estate Development and Sales and Its Growth Rate in 2016
|
Item |
Unit |
Volume |
Increase over 2015 (%) |
|
Value of Investment |
100 million RMB |
102581 |
6.9 |
|
Of which: residential buildings |
100 million RMB |
68704 |
6.4 |
|
Of which: 90 square meters and below |
100 million RMB |
24772 |
0.5 |
|
Floor space of buildings under construction |
10,000 square meters |
758975 |
3.2 |
|
Of which: residential buildings |
10,000 square meters |
521310 |
1.9 |
|
Floor space of buildings newly started |
10,000 square meters |
166928 |
8.1 |
|
Of which: residential buildings |
10,000 square meters |
115911 |
8.7 |
|
Floor space of buildings completed |
10,000 square meters |
106128 |
6.1 |
|
Of which: residential buildings |
10,000 square meters |
77185 |
4.6 |
|
Sales of commercialized buildings |
10,000 square meters |
157349 |
22.5 |
|
Of which: residential buildings |
10,000 square meters |
137540 |
22.4 |
|
Funds for investment this year |
100 million RMB |
144214 |
15.2 |
|
Of which: domestic loans |
100 million RMB |
21512 |
6.4 |
|
100 million RMB |
24403 |
46.5 |
V. Domestic Trade
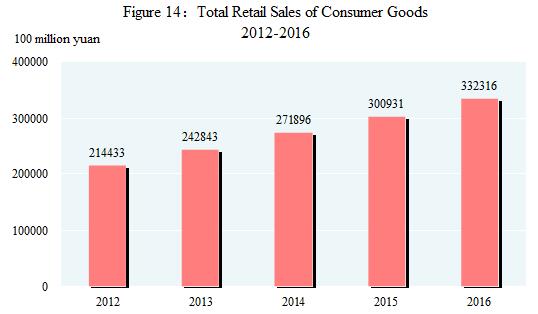
In 2016, the total retail sales of consumer goods reached 33,231.6 billion yuan, a growth of 10.4 percent over the previous year, or a real growth of 9.6 percent after deducting price factors. An analysis on different areas showed that the retail sales of consumer goods in urban areas stood at 28,581.4 billion yuan, up by 10.4 percent, and that in rural areas reached 4,650.3 billion yuan, up by 10.9 percent. Grouped by consumption patterns, the retail sales of commodities was 29,651.8 billion yuan, up by 10.4 percent, and that of catering industry was 3,579.9 billion yuan, up by 10.8 percent.
Of the total retail sales of commodities by enterprises above the designated size, the year-on-year growth of sales for grain, oil, food, beverage, tobacco and liquor was up by 10.5 percent, for clothes, shoes, hats and textiles up by 7.0 percent, for cosmetics up by 8.3 percent, for gold, silver and jewelry the same as that of the previous year, for daily necessities up by 11.4 percent, for household appliances and audio-video equipments up by 8.7 percent, for traditional Chinese and western medicines up by 12.0 percent, for cultural and office appliances up by 11.2 percent, for furniture up by 12.7 percent, for telecommunication equipments up by 11.9 percent, for building and decoration materials up by 14.0 percent and for motor vehicles up by 10.1 percent. The retail sales of petroleum and petroleum products went up by 1.2 percent,
The online retail sales[26] were 5,155.6 billion yuan in 2016, an increase of 26.2 percent compared with the previous year. The online retail sales of commodities were 4,194.4 billion yuan, an increase of 25.6 percent, accounting for 12.6 percent of the total retail sales of consumer goods. Among online retail sales of commodities, the sales of food increased by 28.5 percent, clothing by 18.1 percent and daily necessities by 28.8 percent.
VI. Foreign Economic Relations[27]
The total value of imports and exports of goods in 2016 reached 24,338.6 billion yuan, down by 0.9 percent over the previous year. Of this total, the value of goods exported was 13,845.5 billion yuan, down by 1.9 percent, and the value of goods imported was 10,493.2 billion yuan, up by 0.6 percent. The balance of imports and exports (exports minus imports) was 3,352.3 billion yuan, a drop of 330.8 billion yuan over the previous year. The total value of goods imported and exported to countries along the Belt and Road[28] was 6,251.7 billion yuan, an increase of 0.5 percent over the previous year. Of the total, the value of goods exported was 3,831.9 billion yuan, an increase of 0.5 percent; that of the import was 2,419.8 billion yuan, an increase of 0.4 percent.

Table 7: Total Value of Import and Export of Goods and the Growth Rates
in 2016
|
Item |
Value (100 million yuan) |
Increase over 2015 (%) |
|
Total value of import and export of goods |
243386 |
-0.9 |
|
Exports |
138455 |
-1.9 |
|
Of which: General trade |
74601 |
-1.1 |
|
Processing trade |
47237 |
-4.6 |
|
Of which: Mechanical and electronic products |
79820 |
-1.9 |
|
High & new technology products |
39876 |
-2.1 |
|
Imports |
104932 |
0.6 |
|
Of which: General trade |
59398 |
3.7 |
|
Processing trade |
26223 |
-5.5 |
|
Of which: Mechanical and electronic products |
50985 |
1.9 |
|
High & new technology products |
34618 |
1.8 |
|
Trade surplus (exports minus imports) |
33523 |
— |
Table 8: Main Export Commodities in Volume and Value and the Growth Rates in 2016
|
Item |
Unit |
Volume
|
Increase over 2015(%) |
Value (100 million USD) |
Increase over 2015 (%) |
|
Coal (including lignite) |
10000 tons |
879 |
64.6 |
46 |
48.0 |
|
Rolled steel |
10000 tons |
10849 |
-3.5 |
3587 |
-7.8 |
|
Textile yarns and textile articles |
---- |
— |
— |
6925 |
1.9 |
|
Clothes and clothing accessories |
---- |
— |
— |
10413 |
-3.7 |
|
Footwear |
10000 tons |
422 |
-5.6 |
3113 |
-6.2 |
|
Furniture and parts |
---- |
— |
— |
3151 |
-3.8 |
|
Automatic data processing machines and components |
10000 sets |
159257 |
-7.1 |
9068 |
-4.1 |
|
Handheld mobiles and car telephones |
10000 sets |
127192 |
-5.3 |
7643 |
-0.9 |
|
Containers |
10000 units |
199 |
-26.7 |
279 |
-41.2 |
|
Liquid crystal display panels |
10000 units |
190569 |
-16.9 |
1700 |
-11.6 |
|
Motor vehicles |
10000 sets |
79 |
9.4 |
709 |
1.8 |
Table 9: Main Import Commodities in Volume and Value and the Growth Rates in 2016
|
Item |
Unit |
Volume |
Increase over 2015 (%) |
Value (100 million yuan) |
Increase over 2015 (%) |
|
Cereals and cereals flour |
10000 tons |
2199 |
-32.8 |
375 |
-35.5 |
|
Soybean |
10000 tons |
8391 |
2.7 |
2247 |
4.1 |
|
Edible vegetable oil |
10000 tons |
553 |
-18.3 |
276 |
-11.5 |
|
Iron ore and concentrate |
10000 tons |
102412 |
7.5 |
3809 |
7.0 |
|
Aluminum oxide |
10000 tons |
303 |
-35.0 |
58 |
-43.1 |
|
Coal (including lignite) |
10000 tons |
25551 |
25.2 |
938 |
25.1 |
|
Crude oil |
10000 tons |
38101 |
13.6 |
7698 |
-7.5 |
|
Petroleum products refined |
10000 tons |
2784 |
-6.5 |
735 |
-16.6 |
|
Plastics in primary forms |
10000 tons |
2570 |
-1.5 |
2731 |
-2.2 |
|
Paper pulp |
10000 tons |
2106 |
6.2 |
808 |
2.1 |
|
Rolled steel |
10000 tons |
1321 |
3.4 |
869 |
-2.3 |
|
Unwrought copper and its alloys |
10000 tons |
495 |
2.9 |
1741 |
-3.3 |
|
Moto vehicles |
10000 sets |
107 |
-2.4 |
2942 |
6.1 |
Table 10: Imports and Exports of Goods by Major Countries and Regions and the Growth Rates in 2016
|
Country or region |
Exports (100 million yuan) |
Increase over 2015 (%) |
Proportion of the total (%) |
Imports (100 million yuan) |
Increase over 2015 (%) |
Proportion of the total (%) |
|
European Union |
22369 |
1.3 |
16.2 |
13747 |
5.9 |
13.1 |
|
United States |
25415 |
0.0 |
18.4 |
8887 |
-3.2 |
8.5 |
|
ASEAN |
16894 |
-1.9 |
12.2 |
12978 |
7.4 |
12.4 |
|
Hong Kong, China |
19009 |
-7.6 |
13.7 |
1107 |
39.2 |
1.1 |
|
Japan |
8529 |
1.3 |
6.2 |
9626 |
8.4 |
9.2 |
|
Republic of Korea |
6185 |
-1.7 |
4.5 |
10496 |
-3.2 |
10.0 |
|
Taiwan, China |
2665 |
-4.3 |
1.9 |
9203 |
3.4 |
8.8 |
|
India |
3850 |
6.6 |
2.8 |
777 |
-6.4 |
0.7 |
|
Russia |
2466 |
14.2 |
1.8 |
2128 |
3.1 |
2.0 |
The total value of imports and exports of services[29] in 2016 was 5,348.4 billion yuan, up by 14.2 percent. The export value of services was 1,819.3 billion yuan, up by 2.3 percent. The import value of services was 3,529.1 billion yuan, up by 21.5 percent. The deficit of exports minus imports of services was 1,709.7 billion yuan.
The year 2016 witnessed the establishment of 27,900 enterprises (excluding banking, securities and insurance) with foreign direct investment, up by 5.0 percent over the previous year; and the foreign capital actually utilized was 813.2 billion yuan (126.0 billion US dollars), up by 4.1 percent. Among the enterprises, 2,905 of them were directly invested by investors from countries along the Belt and Road, up by 34.1 percent; and the foreign capital directly invested in China was 45.8 billion yuan (7.1 billion US dollars).
Table 11: Total Value of Foreign Direct Investment (Excluding Banking, Securities and Insurance) and the Growth Rates in 2016
|
Sector |
Enterprises |
Increase over 2015 (%) |
Actually Utilized Value (100 million yuan) |
Increase over 2015 (%) |
|
Total |
27900 |
5.0 |
8132.2 |
4.1 |
|
Of which: Agriculture, Forestry, Animal Husbandry and Fishery |
558 |
-8.4 |
123.2 |
30.0 |
|
Manufacturing |
4013 |
-11.0 |
2303.0 |
-6.1 |
|
Production and Supply of Electricity, Gas and Water |
311 |
18.0 |
139.8 |
0.3 |
|
Transport, Storage and Post |
425 |
-5.4 |
329.2 |
26.7 |
|
Information Transmission, Software and Information Technology |
1463 |
11.6 |
540.4 |
128.0 |
|
Wholesales and Retail Trades |
9399 |
2.7 |
1011.1 |
36.0 |
|
Real Estate |
378 |
-2.3 |
1264.4 |
-29.4 |
|
Leasing and Business Services |
4631 |
3.7 |
1045.9 |
67.8 |
|
Services to Households and Other Services |
245 |
13.0 |
33.0 |
-25.8 |
In 2016, the overseas direct investment (excluding banking, securities and insurance) by Chinese investors was 1,129.9 billion yuan, or 170.1 billion US dollars, up by 44.1 percent over the previous year. Among the investment, Chinese investors directly invested 14.5 billion US dollars in countries along the Belt and Road.
Table 12: Total Value of Overseas Direct Investment (Excluding Banking, Securities and Insurance) and the Growth Rates in 2016
|
Sector |
Overseas Direct Investment (100 million US dollars) |
Increase over 2015 (%) |
|
|
Total |
1701.1 |
44.1 |
|
|
Of which:
|
Agriculture, Forestry, Animal Husbandry and Fishery |
29.7 |
45.0 |
|
Mining |
86.7 |
-20.1 |
|
|
Manufacturing |
310.6 |
116.7 |
|
|
Production and Supply of Electricity, Gas and Water |
25.3 |
-9.2 |
|
|
Construction |
53.1 |
18.0 |
|
|
Wholesale and Retail Trades |
275.6 |
72.0 |
|
|
Transport, Storage and Post Service |
36.2 |
17.1 |
|
|
Information Transmission, Software and Information Technology |
203.6 |
252.2 |
|
|
Real Estate |
106.4 |
17.4 |
|
|
Leasing and Business Services |
422.7 |
1.4 |
|
In 2016, the accomplished business revenue through contracted overseas engineering projects was 1,058.9 billion yuan, or 159.4 billion US dollars, up by 3.5 percent. Among which, the accomplished business revenue from countries along the Belt and Road was 76.0 billion US dollars, an increase of 9.7 percent, accounting for 47.7 percent of the accomplished business revenue through contracted overseas engineering projects. The number of labor forces sent abroad through overseas labor contracts was 490 thousand, down by 6.8 percent.
VII. Transportation[30], Post, Telecommunications and Tourism
The total freight traffic reached 44.0 billion tons, up by 5.7 percent over the previous year, and the freight flows were 18,529.5 billion ton-kilometers, up by 4.0 percent. The volume of freight handled by ports above the designated size throughout the year totaled 11.83 billion tons, up 3.2 percent over the previous year, of which freight for foreign trade was 3.76 billion tons, up 4.1 percent. Container shipping of ports above the designated size reached 217.98 million standard containers, up by 3.6 percent.
Table 13: Freight Traffic by All Means of Transportation and Growth Rates in 2016
|
Item |
Unit |
Volume |
Increase over 2015(%) |
|
Total freight traffic |
100 million tons |
440.4 |
5.7 |
|
Railways |
100 million tons |
33.3 |
-0.8 |
|
Highways |
100 million tons |
336.3 |
6.8 |
|
Waterways |
100 million tons |
63.6 |
3.7 |
|
Civil aviation |
10 000 tons |
666.9 |
6.0 |
|
Pipelines |
100 million tons |
7.0 |
5.3 |
|
Freight flows |
100 million ton-kilometers |
185294.9 |
4.0 |
|
Railways |
100 million ton-kilometers |
23792.3 |
0.2 |
|
Highways |
100 million ton-kilometers |
61211.0 |
5.6 |
|
Waterways |
100 million ton-kilometers |
95399.9 |
4.0 |
|
Civil aviation |
100 million ton-kilometers |
221.1 |
6.3 |
|
Pipelines |
100 million ton-kilometers |
4670.6 |
5.7 |
In 2016, the total passenger traffic reached 19.2 billion persons, down by 1.2 percent over 2015, and the passenger flows were 3,130.6 billion person-kilometers, grew by 4.1 percent.
Table 14: Passenger Traffic by All Means of Transportation and Growth Rates in 2016
|
Item |
Unit |
Volume |
Increase over 2015 (%) |
|
Total passenger traffic |
100 million persons |
192.0 |
-1.2 |
|
Railways |
100 million persons |
28.1 |
11.0 |
|
Highways |
100 million persons |
156.3 |
-3.5 |
|
Waterways |
100 million persons |
2.7 |
0.1 |
|
Civil aviation |
100 million persons |
4.9 |
11.8 |
|
Passenger flows |
100 million person-kilometers |
31305.7 |
4.1 |
|
Railways |
100 million person-kilometers |
12579.3 |
5.2 |
|
Highways |
100 million person-kilometers |
10294.8 |
-4.2 |
|
Waterways |
100 million person-kilometers |
72.0 |
-1.4 |
|
Civil aviation |
100 million person-kilometers |
8359.5 |
14.8 |
The total number of motor vehicles for civilian use reached 194.40 million (including 8.81 million tri-wheel motor vehicles and low-speed trucks) by the end of 2016, up 12.8 percent, of which privately-owned vehicles numbered 165.59 million, up 15.0 percent. The total number of cars for civilian use stood at 108.76 million, up 14.4 percent, of which privately-owned cars numbered 101.52 million, up by 15.5 percent.
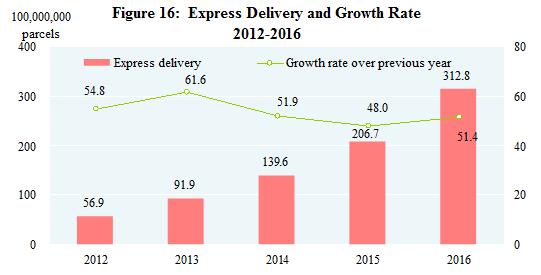
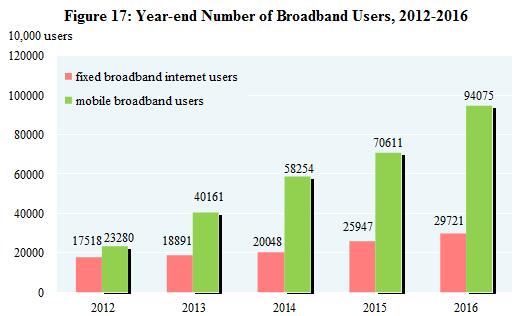
The turnover of post and telecommunication services[31] totaled 4,334.4 billion yuan, up 52.7 percent over the previous year. Of this total, post services amounted to 739.7 billion yuan, up 45.7 percent, and telecommunication services 3,594.8 billion yuan, up 54.2 percent. In post services, the number of mail delivery reached 3.62 billion, parcel delivery 30 million and express delivery 31.28 billion. The revenue from express delivery reached 397.4 billion yuan. In telecommunication services, the newly increased capacity of mobile phone switchboard[32] was 73.18 million lines with the total capacity reaching 2,183.84 million lines. By the end of 2016, there were 1,528.56 million phone subscribers in China, of which 1,321.93 million were mobile phone users. Mobile phone coverage rose to 96.2 sets per 100 persons. The number of fixed broadband internet users[33] reached 297.21 million, increased by 37.74 million over the previous year. Of this total, fixed fiber-optic broadband internet users[34] amounted to 227.66 million, an increase of 79.41 million. The number of the mobile broadband users[35] was 940.75 million, an increase of 234.64 million. Mobile internet traffic was 9.36 billion G, up 123.7 percent over the previous year. The number of internet users was 731 million, grew by 42.99 million. Of the total, 695 million were mobile internet surfers[36], an increase of 75.50 million. The coverage of Internet was 53.2 percent nationwide and 33.1 percent in rural areas. Software revenue of software and IT services industry[37] totaled 4,851.1 billion yuan, up 14.9 percent.
The year 2016 registered 4.4 billion domestic tourists, up 11.2 percent over the previous year. The revenue from domestic tourism totaled 3,939.0 billion yuan, up 15.2 percent. The number of inbound visitors to China totaled 138.44 million, an increase of 3.5 percent. Of this total, 28.13 million were foreigners, up 8.3 percent; and 110.31 million were Chinese compatriots from Hong Kong, Macao and Taiwan, up by 2.3 percent. Of all the inbound tourists, overnight visitors counted 59.27 million, an increase of 4.2 percent. Earnings from international tourism topped 120.0 billion US dollars, up 5.6 percent. The number of China’s outbound visitors totaled 135.13 million, up 5.7 percent. Of this total, 128.50 million were on private visits, a year-on-year rise of 5.6 percent; and 83.95 million visited Hong Kong, Macao and Taiwan, down by 2.2 percent.
VIII. Financial Intermediation
By the end of 2016, money supply of broad sense (M2) was 155.0 trillion yuan, reflecting an increase of 11.3 percent. Money supply of narrow sense (M1) was 48.7 trillion yuan, up 21.4 percent. Cash in circulation (M0) was 6.8 trillion yuan, up 8.1 percent.
In 2016, the increment of social financing[38] reached 17.8 trillion yuan, increased by 2.4 trillion yuan over 2015. Savings deposit in Renminbi and foreign currencies in all items of financial institutions totaled 155.5 trillion yuan at the end of 2016, an increase of 15.7 trillion yuan compared with that at the beginning of the year. Of this total, the savings deposit in Renminbi stood at 150.6 trillion yuan, an increase of 14.9 trillion yuan. Loans in Renminbi and foreign currencies in all items of financial institutions reached 112.1 trillion yuan, an increase of 12.7 trillion yuan. Of this total, loans in Renminbi were 106.6 trillion yuan, an increase of 12.6 trillion yuan.
Table 15: Savings Deposit and Loans in RMB and Foreign Currencies in All Financial Institutions and Growth Rates at the End of 2016
|
Item |
Year-end figure (100 million yuan) |
Increase over 2015 (%) |
|
Savings deposit |
1555247 |
11.3 |
|
Domestic households |
606522 |
9.9 |
|
Deposits in RMB |
597751 |
9.5 |
|
Domestic non-financial enterprises |
530895 |
16.6 |
|
Loans |
1120552 |
12.8 |
|
Domestic short-term loans |
380020 |
3.6 |
|
Domestic medium and long-term loans |
635052 |
17.8 |
Loans in Renminbi from rural financial institutions (rural credit cooperatives, rural cooperation banks and rural commercial banks) totaled 13,421.9 billion yuan by the end of 2016, an increase of 1,389.5 billion yuan as compared with the beginning of the year. The loans in Renminbi for consumption use by domestic households from all financial institutions totaled 25,047.2 billion yuan, an increase of 6,099.8 billion yuan. Of the total, short-term loans totaled 4,931.3 billion yuan, an increase of 834.7 billion yuan, and medium and long-term loans reached 20,115.9 billion yuan, an increase of 5,265.1 billion yuan.
Funds raised in 2016 by enterprises through issuing stocks and share rights on stock market amounted to 2,334.2 billion yuan, an increase of 508.8 billion yuan from the previous year. Of this total, 248 A-shares were issued, raising 163.4 billion yuan worth of capital altogether. The refinancing of A-shares (including public newly issued, targeted placement[39], right issued, and preferred stock) raised 1,338.7 billion yuan worth of capital, an increase of 461.8 billion yuan from 2015. The listed companies financed 832.1 billion yuan through issuing corporate bonds and convertible bonds on Shanghai and Shenzhen Stock Exchanges, increased by 41.4 billion yuan. In 2016, 5,034 companies were newly listed on National Equities Exchange and Quotations[40], raising 139.1 billion yuan, up by 14.4 percent.
In 2016, 8.22 trillion yuan corporate debenture bonds[41] were issued, an increase of 1.50 trillion yuan over the previous year.
The premium[42] received by the insurance companies totaled 3,095.9 billion yuan in 2016, up 27.5 percent over the previous year. Of this total, life insurance premium amounted to 1,744.2 billion yuan, health and casualty insurance premium 479.2 billion yuan, and property insurance premium 872.5 billion yuan. Insurance companies paid an indemnity worth of 1,051.3 billion yuan, of which, life insurance indemnity was 460.3 billion yuan, health and casualty insurance indemnity 118.4 billion yuan, and property insurance indemnity 472.6 billion yuan.
IX. Living Conditions and Social Security
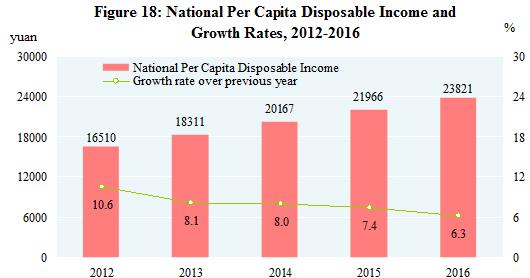
In 2016, the national per capita disposable income[43] was 23,821 yuan, an increase of 8.4 percent or a real increase of 6.3 percent after deducting price factors. The median[44] of national per capita disposable income was 20,883 yuan, up 8.3 percent. In terms of permanent residence, the per capita disposable income of urban households was 33,616 yuan, up by 7.8 percent, or a real growth of 5.6 percent after deducting price factors. The median of per capita disposable income of urban households was 31,554 yuan, up by 8.3 percent. The per capita disposable income of rural households was 12,363 yuan, up by 8.2 percent, or 6.2 percent in real terms. The median of per capita disposable income of rural households was 11,149 yuan, up by 8.3 percent. Grouped by income quintile[45], the per capita disposable income of low-income group reached 5,529 yuan, the lower-middle- income group 12,899 yuan, the middle-income group 20,924 yuan, the upper-middle-income group 31,990 yuan and the high-income group 59,259 yuan. The per capita disposable income of rural households in impoverished areas[46] was 8,452 yuan, up by 10.4 percent, or 8.4 percent in real terms. The per capita monthly income of migrant workers was 3,275 yuan, increased by 6.6 percent.
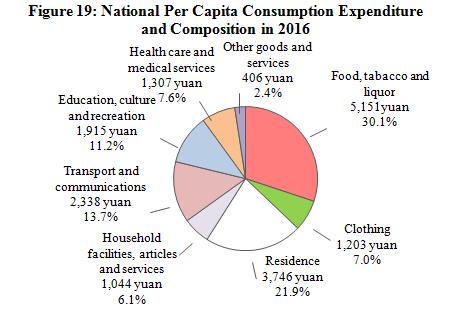
The national per capita consumption expenditure was 17,111 yuan, up by 8.9 percent, or a real growth of 6.8 percent after deducting price factors. In terms of permanent residence, the per capita consumption expenditure of urban households was 23,079 yuan, up by 7.9 percent, or 5.7 percent in real terms. The per capita consumption expenditure of rural households was 10,130 yuan, up by 9.8 percent, or a real growth of 7.8 percent after deducting price factors. The Engel’s Coefficient was 30.1 percent, down by 0.5 percentage point over the previous year, with that of urban and rural households standing at 29.3 percent and 32.2 percent respectively.
By the end of 2016, a total of 378.62 million people participated in urban basic pension program for staff and workers, a year-on-year increase of 25.01 million. A total of 508.47 million people participated in basic pension insurance program for urban and rural residents, an increase of 3.75 million. A total of 748.39 million people participated in basic health insurance program, an increase of 82.57 million. Of this total, 295.24 million people participated in basic health insurance program for staff and workers, a year-on-year increase of 6.31 million, and 453.15 million people participated in programs for residents, an increase of 76.26 million. Some 180.89 million people participated in unemployment insurance programs, an increase of 7.63 million. The number of people receiving unemployment insurance payment stood at 2.30 million. A total of 218.87 million people participated in work accident insurance, an increase of 4.55 million. Of this total, 75.10 million were migrant workers, an increase of 0.21 million. A total of 184.43 million people participated in maternity insurance programs, an increase of 6.72 million. Minimum living allowances were granted to 14.799 million urban residents and 45.765 million rural residents, and 4.969 million rural residents living in extreme poverty[47] received relief and assistance. A total of 56.206 million people were financed to participate in basic medical insurance system and medical assistance was granted to 30.998 million cases. National subsidies and allowances were provided to 8.772 million entitled people. According to the rural poverty line of annual per capita income of 2,300 yuan (at 2010 constant prices), the population in poverty in rural areas numbered 43.35 million in 2016, or 12.40 million less[48] than that in 2015.
X. Education, Science & Technology and Culture & Sports
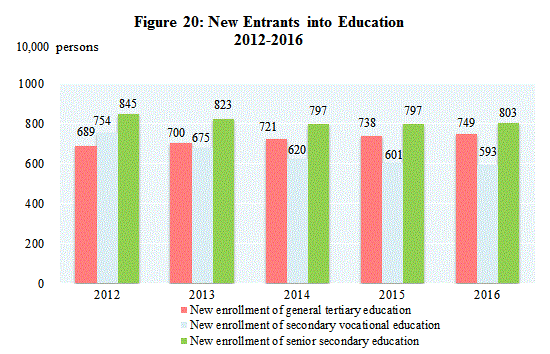
In 2016, the post-graduate education enrollment was 1.981 million students with 667 thousand new students and 564 thousand graduates. The general tertiary education enrollment was 26.958 million students with 7.486 million new students and 7.042 million graduates. Vocational secondary schools[49] had 15.991 million enrolled students, including 5.933 million new entrants, and 5.337 million graduates. Senior secondary schools had 23.666 million enrolled students, including 8.029 million new entrants, and 7.924 million graduates. Students enrolled in junior secondary schools totaled 43.294 million, including 14.872 million new entrants, and 14.239 million graduates. The country had a primary education enrollment of 99.130 million students, including 17.525 million new entrants, and 15.074 million graduates. There were 492 thousand students enrolled in special education schools, with 92 thousand new entrants and 59 thousand graduates. Kindergartens accommodated 44.139 million children. The number of students graduating from compulsory education reached 93.4 percent of the total enrollment and the gross enrollment rate in senior high schools reached 87.5 percent.
Expenditures on research and development activities (R&D) was worth 1,550.0 billion yuan in 2016, up 9.4 percent over 2015, accounting for 2.08 percent of GDP. Of this total, 79.8 billion yuan was appropriated for fundamental research programs. 1,163 science and technology projects and 42 priority projects were arranged under the national key research and development program. A total number of 224 subjects were arranged under the national science and technology major project and 41,184 projects were financed by the National Natural Science Foundation. By the end of 2016, there were altogether 488 state key laboratories, 131 national engineering research centers, 194 national engineering laboratories, and 1,276 national enterprise technical centers. The National fund for Technology Transfer and Commercialization established 9 sub-funds, with the total size reached 17.35 billion yuan. 3,465 thousand patent applications were accepted from home and abroad, and a total of 1,754 thousand patents were authorized. Till the end of year 2016, the number of patents in force was 6.285 million, of which 1,103 thousand were invention patents from home. The number of invention patents per 10,000 people was 8.0. A total of 320 thousand technology transfer contracts were signed, representing 1,140.7 billion yuan in value, up 16.0 percent over the previous year.
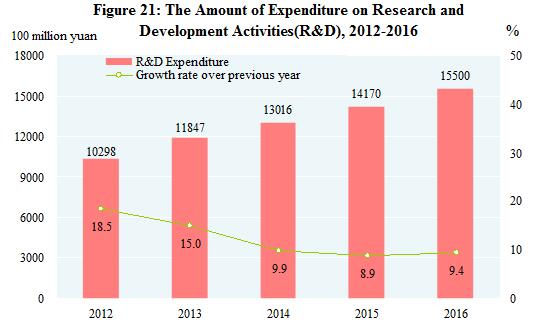
Table16: Number of Patents Application Accepted, Patents Authorized and Patents in Force in 2016
|
Item |
Patents(10,000) |
Increase over 2015(%) |
|
Number of patent applications accepted |
346.5 |
23.8 |
|
Of which: domestic |
328.1 |
25.4 |
|
Of which: for new inventions |
133.9 |
21.5 |
|
Of which: domestic |
119.3 |
24.7 |
|
Number of patents authorized |
175.4 |
2.1 |
|
Of which: domestic |
161.2 |
2.1 |
|
Of which: for new inventions |
40.4 |
12.5 |
|
Of which: domestic |
29.5 |
15.0 |
|
Number of patents in force at the end of the year |
628.5 |
14.7 |
|
Of which: domestic |
540.6 |
15.7 |
|
Of which: for new inventions |
177.2 |
20.4 |
|
Of which: domestic |
110.3 |
26.6 |
The year 2016 saw 22 times of satellite launches. New models of carrier rockets, Long March-5 and Long March-7, succeeded in their first trip. Tiangong-2 space laboratory and Shenzhou-11 manned spacecraft were successfully launched and the astronauts returned to the Earth safely after staying in the orbit for 30 days. The new generation geostationary meteorological satellite Fengyun-4, the synthetic aperture radar satellite Gaofen-3 and three Beidou navigation satellites were successfully launched.
By the end of 2016, there were altogether 34,487 laboratories for product inspection, including 681 national inspection centers. There were 312 agencies for product quality and management system certification, which accumulatively certified products in 152,525 enterprises. There were 3,933 authorized measurement institutions in the year, enforcing compulsory inspection on 78.78 million measurement instruments. A total of 1,763 national standards were developed or revised in the year, including 1,255 new standards.
At the end of 2016, there were 2,046 art-performing groups and 3,060 museums in the cultural system throughout China. A total of 3,172 public libraries received[50] 647.81 million people. There were 3,338 culture centers. Subscribers to cable television programs and digital cable television programs numbered 223 million and 197 million respectively. Radio broadcasting and television broadcasting coverage rates were 98.4 percent and 98.9 percent respectively. A total of 14,768 episodes of 330 TV series and 119,895 minutes of TV cartoons were made in 2016. The country produced 772 feature movies and 172 science, educational, documentary, cartoon and special movies[51]. A total of 39.4 billion copies of newspapers and 2.7 billion copies of magazines were issued, and 8.6 billion copies of books were published. The average number of books possessed per person[52] was 6.27 copies. By the end of the year, there were 4,193 archives in China and 133.88 million documents were made accessible to the public.
In 2016, Chinese athletes won 107 world championships on 23 sports events and broke 9 world records. In Rio Olympic Games, China won 70 medals with 26 gold ones, ranking the third on the gold medal tally and the second on the overall medal standings. Chinese physically-challenged athletes won 237 world championships in 17 international sports competitions. In Rio Paralympics, China’s athletes won 107 gold medals, topping again both the gold medal tally and the overall medal standings.
XI. Public Health and Social Services
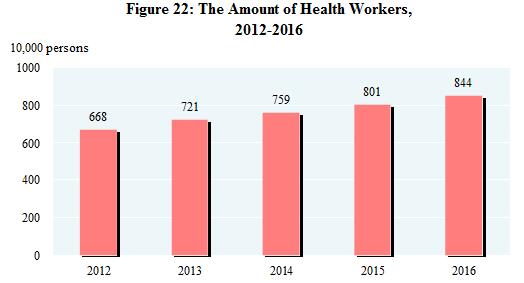
By the end of 2016, there were 993,000 medical and health institutions in China, including 29,000 hospitals. Of all the hospitals, 13,000 were public, and 16,000 were private. Of the 931,000 medical and health institutions at grass-root level, there were 37,000 township health centers, 35,000 community health service centers, 217,000 clinics and 642,000 village clinics. Of the 29,000 professional public health institutions, 3,484 were epidemic disease prevention centers and 3,138 were health monitoring institutions. There were 8.44 million health workers in China, including 3.17 million practicing doctors and assistant practicing doctors and 3.50 million registered nurses. The medical and health institutions in China possessed 7.47 million beds, of which, hospitals possessed 5.75 million and township health centers had 1.23 million. The total number of medical visits[53] and hospital discharges[54] in 2016 reached 7.80 billion and 220 million respectively.
By the end of 2016, there were altogether 31 thousand social welfare institutions providing accommodation, of which 28 thousand were elder-caring organizations and 713 were children caring organizations. The social welfare institutions provided 7.166 million beds[55], of which 6.800 million were for the elderly and 100 thousand were for children. There were 24 thousand community service centers and 130 thousand community service stations.
XII. Resources, Environment and Work Safety
In 2016, the total supply of state-owned land for construction use[56] was 520 thousand hectares, a decrease of 2.9 percent over the previous year. Of this total, the supply for mining storage was 120 thousand hectares, down by 3.2 percent; that for real estate[57] was 110 thousand hectares, down by 10.3 percent; and that for infrastructure facilities was 290 thousand hectares, up by 0.2 percent.
The total stock of water resources in 2016 was 3,015.0 billion cubic meters. The annual average precipitation was 730 millimeters. At the end of 2016, the 614 large reservoirs covered by monitoring program in China stored 340.9 billion cubic meters of water, decreased slightly over that at the end of last year. With an increase of 0.8 percent over 2015, the total water consumption reached 615.0 billion cubic meters, of which water consumption for living purposes rose by 2.7 percent, for industrial use decreased by 0.4 percent, for agricultural use up by 0.7 percent, and for ecological water supplement grew by 1.9 percent. Water consumption for every 10 thousand yuan worth of GDP produced[58] was 84 cubic meters, a decline of 5.6 percent over the previous year. Water consumption for every 10 thousand yuan worth of industrial value added was 53 cubic meters, down by 6.0 percent. Per capita water consumption was 446 cubic meters, up by 0.2 percent.
In 2016, a total of 6.79 million hectares of forests were planted, of which 3.81 million hectares were afforested by manpower, accounting for 56.1 percent of the total. Forest tending areas reached 8.37 million hectares. By the end of 2016, there were 2,750 natural reserves including 446 national ones. A total of 54 thousand square kilometers of eroded land was put under treatment programs, and 16 thousand square kilometers of land was closed for nurture and protection in areas suffering water and soil erosion.
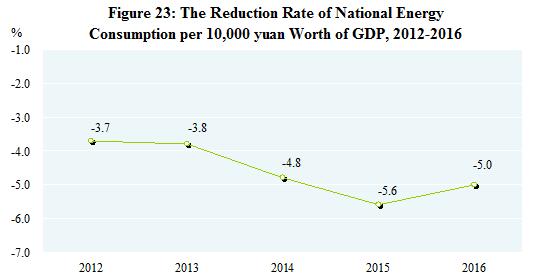
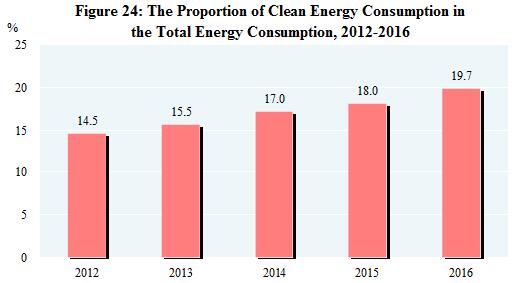
Preliminary estimation indicated that the total energy consumption in 2016 amounted to 4.36 billion tons of standard coal equivalent, up 1.4 percent over 2015. The consumption of coal declined by 4.7 percent; crude oil, up 5.5 percent; natural gas, up 8.0 percent; and electric power, up 5.0 percent. The consumption of coal accounted for 62.0 percent of the total energy consumption, down 2.0 percentage points over 2015, while clean energy consumption, such as hydropower, wind power, nuclear power and natural gas, accounted for 19.7 percent, up 1.7 percentage points. The national energy consumption per 10,000 yuan worth of GDP went down by 5.0 percent. The comprehensive energy consumption per ton crude copper of industrial enterprises went down by 9.45 percent, that of per ton steel declined by 0.08 percent, per unit caustic soda, down by 2.08 percent, and per ton cement, down by 1.81 percent. The standard coal consumption per kilowatt-hour of thermal power generation was decreased by 0.97 percent.
Monitoring of oceanic water quality at 417 offshore monitoring stations indicated that oceanic water met the national quality standard Grade I and II in 73.4 percent of the stations; water quality at 10.3 percent of the stations met Grade III standard; and water of Grade IV or inferior quality was found at 16.3 percent of the stations.
Of the 338 cities monitored, 24.9 percent reached the air standard and 75.1 percent failed. The annual average concentration of particulate matter (PM2.5) for cities at prefectural-level and above that failed to meet the standard stood at 52 micrograms per cubic meter, down by 8.8 percent over the previous year.
Of the 322 cities subject to noise monitoring program, 5.0 percent enjoyed fairly good environment, 68.3 percent had good environment, 26.1 percent had fair environment and 0.6 percent had poor environment in downtown areas.
The average temperature in 2016 was 10.49℃, down by 0.13℃ compared with that of the previous year. Typhoon hit China 8 times in 2016.
At the end of 2016, the daily treatment capacity of city sewage reached 148.23 million cubic meters, up 5.6 percent over that at the end of 2015. City sewage treatment rate was 92.4 percent, up 0.5 percentage point. 95.0 percent of municipal solid waste was treated without causing pollution, up 0.9 percentage point. The floor space with central heating systems in urban area amounted to 7.07 billion square meters, up 5.2 percent. The green area totaled 1.971 million hectares in urban built-up area, increased by 3.3 percent. Greenery coverage reached 36.44 percent of built-up area, up 0.08 percentage point. Per capita green area of parks reached 13.45 square meters, an increase of 0.10 square meter.
In 2016, natural disasters hit 26.22 million hectares of crops, of which 2.90 million hectares of crops were demolished. Flood, waterlog and geological disasters caused a direct economic loss of 313.4 billion yuan. Drought caused a direct economic loss of 41.8 billion yuan. Disasters from low temperature, frost and snow made a total direct economic loss of 17.9 billion yuan. Oceanic disasters caused a direct economic loss of 5.0 billion yuan. The country recorded 18 earthquakes with magnitude 5 and over, 16 of which caused disasters, causing a direct economic loss of 6.7 billion yuan. The year 2016 witnessed 2,034 forest fires, with 6 thousand hectares of forests damaged.
The death toll due to work accidents[59] amounted to 43,062 people. The death toll from work accidents for every 100 million yuan worth of GDP was 0.058 people, decreased by 10.8 percent over 2015 on a comparable basis. Work accidents in industrial, mining and commercial enterprises caused 1.702 deaths out of every 100 thousand employees, down by 2.3 percent over 2015 on a comparable basis. The road traffic death toll per 10 thousand vehicles was 2.1 persons, the same level as that of the previous year. The death toll for one million tons of coal produced in coalmines was 0.156 person, down 3.7 percent.
Notes:
[1] All figures in this Communiqué are preliminary statistics. Statistics in this Communiqué do not include Hong Kong SAR, Macao SAR and Taiwan Province. Due to the rounding-off reasons, the subentries may not add up to the aggregate totals.
[2] Gross domestic product (GDP), value added and per capita GDP as quoted in this Communiqué are calculated at current prices whereas their growth rates are at constant prices.
[3] Gross national income, also known as Gross National Product, refers to the final result of the primary distribution of the income created by all the resident units of a country (or a region) during a certain period of time. It equals to Gross Domestic Product plus the net factor income from abroad.
[4] Population who live in places other than their household registration refers to those who reside in areas other than their household registration and have been away from there for over 6 months.
[5] Floating population refers to the population who live in places other than their household registration excluding those with current residence different from the place of their household registration but still in the same city. Population who live in places other than their household registration but still in the same city refer to those whose current residences are different from the registered towns or streets in the same district or in different districts but still in the same municipality or prefecture-level city.
[6] By the end of 2016, the population aged 0 to 14 (under the age of 15) was 230.08 million and that aged 15 to 59 (under the age of 60) was 921.77 million.
[7] The number of migrant workers includes those who are employed outside their villages and towns for more than six months in the year and those who do non-agricultural work in their villages and towns for more than six months in the year.
[8] The overall labor productivity refers to the ratio between the GPD (at 2015 constant price) and the total number of persons employed.
[9] The producer prices for farm products refer to the prices of farm products sold directly by producers.
[10] The prices for residence include prices for rent, maintenance and management, water, electricity and fuel etc.
[11] To facilitate the coordinated use of financial funds, starting from 2016, 5 items under the government budget funds including government housing fund were reallocated under general public budget. The funds transferred from budget of operation of state-owned capital to general public budget shall be listed under financial funds transferred from other items instead of general public budget revenue. The effect of the reallocation and change of items has been taken into consideration while calculating the year-on-year changes both in volume and in growth rate.
[12] Strategic emerging industries consist of energy-saving and environmental protection, information and technology of new generation, biotech, manufacture of high-end equipment, new energy, new materials, and manufacture of new energy cars.
[13] High technology manufacturing industry includes manufacture of medicine, manufacture of aerospace vehicle and equipment, manufacture of electronic and communication equipment, manufacture of computers and office equipment, manufacture of medical equipment, manufacture of measuring instrument and equipment and manufacture of optical and photographic equipment.
[14] Manufacture of equipment includes manufacture of metal products, general purpose equipment, special purpose equipment, automobiles, railway, ship, aerospace and other transport equipment, electrical machinery and apparatus, computers, communication and other electric equipment and measuring instrument and machinery.
[15] The six major high energy consuming industries consist of processing of petroleum, coking and processing of nuclear fuel, manufacture of raw chemical materials and chemical products, manufacture of non-metallic mineral products, smelting and pressing of ferrous metals, smelting and pressing of non-ferrous metals and production and supply of electricity and heat power.
[16] Thermal Power refers to electricity generated by coal, oil, gas, residual heat, pressure and gas, waste incineration and biomass.
[17] The data include 354.43 million tons of steel which has been reprocessed among enterprises.
[18] A few installed power generation capacity was not listed (e.g. geothermal).
[19] The national total of fixed assets investment is larger than the aggregate sum by adding up the subtotals of fixed assets investment in the eastern areas, central areas, western areas and northeastern areas due to the fact that some of the trans-regional investments are not covered by regional figures. The eastern areas include 10 provinces and municipalities: Beijing, Tianjin, Hebei, Shanghai, Jiangsu, Zhejiang, Fujian, Shandong, Guangdong and Hainan; the central areas cover 6 provinces: Shanxi, Anhui, Jiangxi, Henan, Hubei and Hunan; the western areas include 12 provinces, autonomous regions and municipality: Inner Mongolia, Guangxi, Chongqing, Sichuan, Guizhou, Yunnan, Tibet, Shaanxi, Gansu, Qinghai, Ningxia and Xinjiang; the northeastern areas include 3 provinces: Liaoning, Jilin and Heilongjiang.
[20] Investment in infrastructure refers to the investment in the construction or purchase of fundamental, public-serving projects and facilities for the social production and people’s life, including transportation, postal service, telecommunication, radio, TV and satellite transmission, internet and related services, management of water conservancy, environment and public facilities.
[21] Private investment in fixed assets refers to investment in the construction or purchase of fixed assets by domestic collective, private and individual-owned enterprises or organizations or their holding enterprises (with absolute holding and relative holding enterprises).
[22] Investment in high technology industries refers to investment in six high technology manufacturing industries, including the manufacture of medicine and manufacture of aerospace vehicle and equipment, and nine high technology service industries, including information service and e-commerce service.
[23] The investment in real estate includes the investment made in real estate development, construction of buildings for own use, property management, intermediary services and other real estate development.
[24] High-speed railways refer to railways with a highest operating speed of 200 km/h or above.
[25] Data source is the number of dilapidated houses reported by all provinces (autonomous regions and municipalities) by the end of December, 2016. The number of dilapidated houses here refers to the number of dilapidated houses started to be rebuilt and renovated, which belonged to poor rural households that had their economic status registered at local governments.
[26] Online retail sales refer to the retail sales of goods and services realized through internet trading platforms (including self-built websites and third-party platforms). The sales of services of online retail and a few other goods for production operation and resale are not covered by the total retail sales of consumer goods.
![]() [27] Trade of goods and services, and foreign investment absorbed are calculated in RMB term. Overseas investment and contracted overseas engineering projects are still in US dollar term due to technical reasons.
[27] Trade of goods and services, and foreign investment absorbed are calculated in RMB term. Overseas investment and contracted overseas engineering projects are still in US dollar term due to technical reasons.
[28] The Belt and Road refer to the Silk Road Economic Belt and the 21st –century Maritime Silk Road.
[29] The imports and exports of services are calculated according to the sixth edition of Balance of Payments and International Investment Position Manual (BPM6) and do not cover government services, and the growth rate is calculated on a comparable basis.
[30] Accounting method and statistical coverage of passenger traffic, freight traffic, passenger flow and freight flow of highways in 2015 have been changed. The growth rate was calculated on a comparable basis.
[31] The turnover of post and telecommunication services is calculated at constant prices of 2010.
[32] The capacity of mobile phone switchboard refers to the number of maximum concurrent users calculated by mobile phone switchboard according to selected calling models and switchboard processing capacity.
[33] Fixed broadband internet users refer to those who make registration in the telecommunication enterprises and access the internet through xDSL, FTTx+LAN, FTTH/0 and other broadband access ways as well as dedicated lines at the end of the reporting period.
[34] Fixed fiber-optic broadband internet users refer to those who make registration in the telecommunication enterprises and access the internet through FTTH or FTT0 at the end of the reporting period.
[35] Mobile broadband users refer to those who have records in the billing system and use 3G or 4G network resources at the end of the reporting period.
[36] The number of mobile Internet surfer refers to the number of Chinese residents aged 6 and above who connected to and surfed on the Internet via mobile phones in the past six months.
[37] Software and IT services industry includes software development, information system integration, IT consulting service, data processing and storage, integrated circuit design and other IT services industry.
[38] The increment of social financing refers to the total funds raised by real economy from the financial system over a period of time.
[39] Targeted placement excludes assets subscription.
[40] National Equities Exchange and Quotations, also called “the New Over-the-Counter Market”, is a national securities exchange established upon approval by the State Council in 2012.
[41] Corporate debenture bonds include debt financing instruments of non-financial businesses, enterprise bonds, corporate bonds and convertible bonds.
[42] The original premium income received by the insurance companies refers to the premium income from original insurance contracts confirmed by the insurance companies.
[43] The reason why the growth rate of national income outpaces that in urban and rural areas is that, in urbanization process, some higher income population in rural areas move to cities and fall into lower income group in urban areas. Their migration lowers the income of urban and rural households. However, the effect of income growth, whether in rural or urban areas, is reflected in the national income growth.
[44] The median of per capita income refers to the per capita income of household lied in the middle of all surveyed households which are ranked from low to high (or high to low) based on per capita income level.
[45] The income quintile refers to the five equal partitions of all surveyed households, who are ranked from low to high based on per capita income level. The top 20 percent with the highest income are classified as high-income group, and the other four levels are upper-middle-income group, middle-income group, lower-middle-income group and low-income group.
[46] Impoverished areas cover contiguous poverty-stricken areas and key counties under national poverty alleviation and development program beyond those areas. There are totally 832 counties, of which, 592 belong to the latter group.
[47] Rural residents living in extreme poverty refer to the aged, the disabled and the minor under 16 years of age in rural areas who have no ability to work, no sources of income and no statutory obligors to provide for them, bring them up or support them, or whose statutory obligors have no ability to fulfill their obligations.
[48] The number of reduced people in poverty equals the population in poverty in the current year minus that in the previous year. It is also equivalent to the population out of poverty minus that return to poverty in the current year.
[49] Vocational secondary schools include regular specialized secondary schools, adult specialized secondary schools, vocational high schools and skilled workers schools.
[50] The people received by the public libraries refer to the number of people who visit libraries and use library services in the year, including borrowing and reading books, consultation and attending readers’ programs.
[51] Special movies refers to those using different display modes in terms of projection techniques, equipment and program as compared with the ordinary cinemas, such as IMAX movies, 3D movies, 4D movies, multidimensional movies and full dome movies.
[52] The average number of books possessed per person refers to the average number of books published in the year that can be possessed per person in China.
[53] The total number of medical visits refers to the number of people receiving medical services, including outpatient services, emergency treatment, home visits, appointment-based treatment, health check-up of a specific item, and health counseling and guidance (excluding health lectures).
[54] The number of hospital discharges refers to the number of inpatients released from hospitals in the reporting period, including those who are discharged from hospitals or transferred to other medical institutions following doctors’ advice, discharged from hospitals without doctors’ permission, dead or other situations. The number of people who are recovered from family sickbeds is excluded.
[55] The beds provided by social welfare institutions include those provided by adoption agencies, aid agencies, community agencies, serviceman recreation habitation and military supply stations etc.
[56] Total supply of state-owned land for construction use refers to the supply of state-owned land for construction use with the land-used right sold, allocated or leased to units or individuals by the municipal or county governments according to annual land supply plan and in line with relevant laws in the reporting period.
[57] Land used for real estate refers to the sum of land used for commercial service and for residence.
[58] The consumption of water and energy for producing 10 thousand yuan worth of GDP and water consumption for every 10 thousand yuan worth of industrial value added are calculated at 2015 constant prices.
[59] The State Administration of Work Safety reformed on work accidents statistics in 2016. As non-production accidents were excluded, the statistical coverage was changed. The year-on-year data was calculated on a comparable basis.
Data Sources:
In this Communiqué, data of urbanization rate of population with household registration, motor vehicles for civilian use and the road traffic death toll are from the Ministry of Public Security; data of newly increased employed people, unemployment rate through unemployment registration and social security and skilled workers schools are from the Ministry of Human Resources and Social Security; financial data are from the Ministry of Finance; data of foreign exchange reserves, exchange rate,monetary finance and corporate credit bonds are from People’s Bank of China; data of output of aquatic products are from the Ministry of Agriculture; data of production of timber, forestry and forest fires are from the State Forestry Administration; data of areas with effective irrigation system and water resources are from the Ministry of Water Resources; data of newly increased power generating capacity and newly increased power transformer equipment with a capacity of over 220 kilovolts are from China Electricity Council; data of new railways put into operation, double-track railways put into operation, electrified railways put into cooperation and railway transportation are from China Railway; data of new and rebuilt highways, new cargo-handling capacity of berths for over 10000-tonnage ships, highway transportation, waterway transportation and volume of freight handled by ports are from the Ministry of Transport; data of new civil transportation airports and civil aviation are from the General Administration of Civil Aviation; data of new lines of optical-fiber cables, new capacity of phone switchboards, the number of phone users, mobile internet traffic, internet users, the coverage of internet and software revenue are from the Ministry of Industry and Information Technology; data of the internet coverage of rural areas are from China Internet Network Information Center; data of housing units rebuilt in rundown areas, dilapidated houses belonged to poor rural households that had their economic status registered at local governments, treatment of city sewage, treatment of solid waste, area with central heating systems and greenery coverage are from the Ministry of Housing and Urban-Rural Development; data of imports and exports of goods are from the General Administration of Customs; data of imports and exports of services, foreign direct investment, overseas direct investment, overseas contracted projects and overseas labor contracts are from the Ministry of Commerce; data of pipelines are from China National Petroleum Corporation, China Petrochemical Corporation and China National Offshore Oil Corporation; data of post services are from the State Post Bureau; data of tourism are from the National Tourism Administration and the Ministry of Public Security; data of listed companies are from the China Securities Regulatory Commission; data of insurances are from China Insurance Regulatory Commission; data of urban and rural minimum living allowances, relief and assistance granted to rural residents living in extreme poverty, social services, areas of crops hit by natural disasters, direct economic loss caused by flood, waterlog and geological disaster, direct economic loss caused by drought, direct economic loss caused by low temperature, frost and snow are from the Ministry of Civil Affairs; data of education are from the Ministry of Education; data of national key research and development programs, national science and technology major projects, state key laboratories, national fund for technology transfer and commercialization and technology transfer contracts are from the Ministry of Science and Technology; data of natural science foundation projects are from the National Natural Science Foundation, data of national engineering research centers and enterprise technical centers are from the National Development and Reform Commission; data of patents are from the State Intellectual Property Office; data of satellite launch are from the State Administration of Science, Technology and Industry for National Defense; data of quality inspection, development and revision of national standards are from the General Administration of Quality Supervision, Inspection and Quarantine; data of art-performing groups, museums, public libraries and culture centers are from the Ministry of Culture; data of radio, television, movies, newspapers, magazines and books are from the State Administration of Press, Publication, Radio, Film and Television; data of documents are from the State Archives Administration; data of sports are from the General Administration of Sport; data of physically-challenged athletes are from the China Disabled Persons’ Federation; data of health are from the National Health and Family Planning Commission; data of supply of state-owned land for construction use are from the Ministry of Land and Resources; data of natural reserves and environment monitoring are from the Ministry of Environmental Protection; data of average temperature and typhoon are from the China Meteorological Administration; data of direct economic loss caused by oceanic disasters are from the State Oceanic Administration; data of the number of earthquakes and direct economic loss caused by earthquakes are from the China Earthquake Administration; data of work safety are from the State Administration of Work Safety; all the other data are from the National Bureau of Statistics.
In case of any differences between English translation and the original Chinese text, the Chinese edition shall prevail.