Industrial Profits Increased from January to March
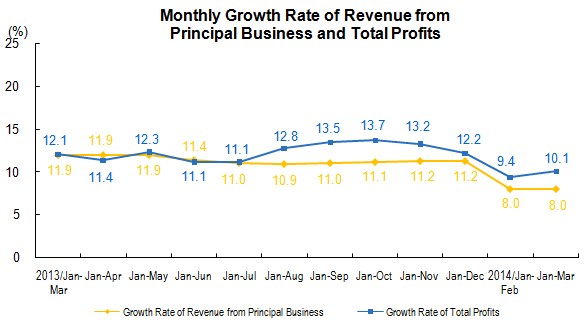
From January to March, the industrial profits of enterprises above designated size achieved 1,294.24 billion yuan, a year-on-year increase of 10.1 percent, 0.7 percentage points higher than that in the first two months. The industrial profits from principal business achieved 1,223.85 billion yuan, a year-on-year increase of 9.4 percent, 1.0 percentage point higher than that in the first two months.
In March, the industrial profits of enterprises above designated size achieved 513.16 billion yuan, increased 10.7 percent year-on-year.
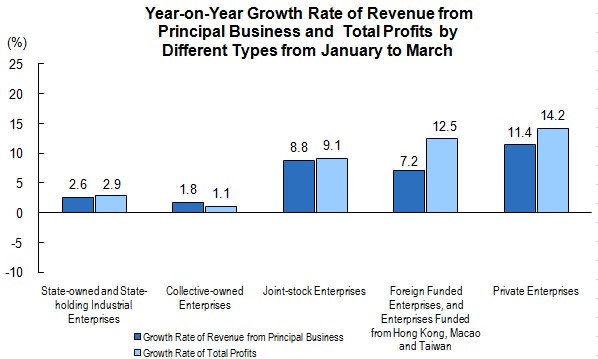
From January to March, the profits of state-owned and state-holding industrial enterprises above designated size gained 354.84 billion yuan, increased 2.9 percent year-on-year; that of collective-owned enterprises reached 17.1 billion yuan, increased 1.1 percent; that of joint-stock enterprises stood at 755.05 billion yuan, increased 9.1 percent; that of foreign funded enterprises, and enterprises funded from Hong Kong, Macao and Taiwan achieved 301.12 billion yuan, increased 12.5 percent; and that of private enterprises gained 419.14 billion yuan, increased 14.2 percent.
From January to March, the profits of mining and quarrying gained 168.51 billion yuan, decreased 15.1 percent year-on-year; that of manufacturing was 1,021.47 billion yuan, increased 13.9 percent; that of production and distribution of electricity, gas and water reached 104.26 billion yuan, went up by 29.7 percent.
From January to March, within 41 branches of industrial divisions, the industrial profits of 33 industrial divisions increased year-on-year, that of 1 remained at the same level, and that of 7 decreased. In view of the profit growth of major industries, the profits of processing of food from agricultural products increased 8.2 percent year-on-year, that of manufacture of textile increased 12.4 percent, that of processing of petroleum, coking, processing of nucleus fuel increased 3.4 percent, that of manufacture of chemical raw material and chemical products increased 10.0 percent, that of manufacture of non-metallic mineral products increased 26.7 percent, that of manufacture of general-purpose machinery increased 16.3 percent, that of manufacture of special-purpose machinery increased 11.7 percent, that of manufacture of motor vehicles increased 29.8 percent, that of manufacture of electrical machinery and equipment increased 28.2 percent, that of manufacture of computer, communication equipment and other electronic equipment increased 21.5 percent, that of production and supply of electric power and heat power increased 32.3 percent, that of mining and washing of coal decreased 41.2 percent, that of extraction of petroleum and natural gas decreased 6.3 percent, that of manufacture and processing of ferrous metals decreased 19.9 percent, that of manufacture and processing of non-ferrous metals decreased 13.6 percent.
From January to March, the revenue from principal business of enterprises above designated reached 23,955.39 billion yuan, increased 8.0 percent year-on-year. The main business cost was 20,497.38 billion yuan, increased 8.7 percent.
By the end of March, the total volume of receivable accounts for industrial enterprises hit 9,345.89 billion yuan, went up by 13.1 percent year-on-year. The total value of finished products for industrial enterprises accounted for 3,388.7 billion yuan, went up by 10.7 percent year-on-year.
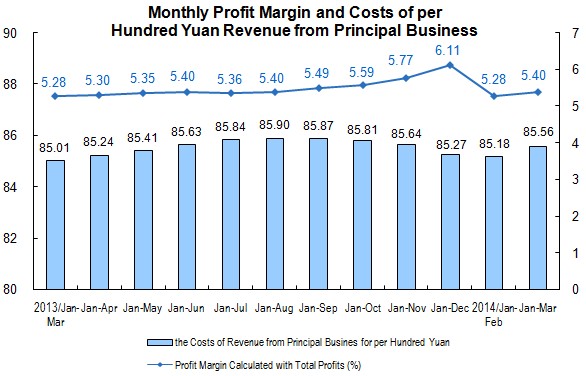
From January to March, the main business income margin of industrial enterprises above designated size hit 5.4 percent, the cost of main business revenue for per hundred yuan stood at 85.56 yuan, the main business income brought by per hundred yuan assets was 115.1 yuan, and the turnover days of finished goods were 14.5 days.
|
Key Financial Indicators of Industrial Enterprises above Designated Size from January to March | ||||||
| Table I | ||||||
| Indicators | Revenue from Principal Business | Total Profits | Profits from Principal Business | |||
| Accumulated to March (100 million yuan) | Increase rate Y/Y (%) | Accumulated to March (100 million yuan) | Increase rate Y/Y (%) | Accumulated to March (100 million yuan) | Increase rate Y/Y (%) | |
|
|
|
|
|
|
|
|
| Total | 239553.9 | 8.0 | 12942.4 | 10.1 | 12238.5 | 9.4 |
| Of which: Mining and Quarrying | 14578.4 | -2.8 | 1685.1 | -15.1 | 1678.6 | -15.4 |
| Manufacturing | 210084.3 | 8.9 | 10214.7 | 13.9 | 9723.3 | 13.7 |
| Production and Distribution of Electricity, Gas and Water | 14891.2 | 6.2 | 1042.6 | 29.7 | 836.6 | 28.6 |
| Of which: State Owned & State-holding Enterprises | 59925.2 | 2.6 | 3548.4 | 2.9 | 3039.6 | -0.7 |
| Of which: Collective-owned Enterprises | 2548.1 | 1.8 | 171.0 | 1.1 | 172.5 | 0.3 |
| Joint-Stock Enterprises | 141670.3 | 8.8 | 7550.5 | 9.1 | 7113.9 | 8.3 |
| Enterprises with Funds From Hong Kong, Macao and Taiwan, and Foreign Funded Enterprises | 57582.8 | 7.2 | 3011.2 | 12.5 | 2895.2 | 13.7 |
| Of which: Private Enterprises | 75923.4 | 11.4 | 4191.4 | 14.2 | 4193.6 | 13.9 |
|
|
|
|
|
|
|
|
| Quality Performance Indicators of Industrial Enterprises above Designated Size from January to March
|
| ||||
| Table II | |||||
| Indicators | Main Business Income Brought by per Hundred yuan Assets (yuan) | Main Business Income Margin (%) | Costs of Revenue from Principal Business for per Hundred yuan (yuan) | Turnover Days of Finished Goods (days) | |
|
|
|
|
|
| |
| Total | 115.1 | 5.40 | 85.56 | 14.5 | |
| Of which: Mining and Quarrying | 67.8 | 11.56 | 75.02 | 12.8 | |
| Manufacturing | 133.0 | 4.86 | 86.13 | 15.7 | |
| Production and Distribution of Electricity, Gas and Water | 51.9 | 7.00 | 87.86 | 0.4 | |
| Of which: State Owned & State-holding Enterprises | 72.0 | 5.92 | 82.00 | 15.8 | |
| Of which: Collective-owned Enterprises | 172.1 | 6.71 | 86.06 | 11.1 | |
| Joint-Stock Enterprises | 112.7 | 5.33 | 85.48 | 16.0 | |
| Enterprises with Funds From Hong Kong, Macao and Taiwan, and Foreign Funded Enterprises | 126.0 | 5.23 | 86.01 | 14.6 | |
| Of which: Private Enterprises | 179.1 | 5.52 | 87.08 | 12.1 | |
|
|
|
|
|
| |
| Key Financial Indicators of Industrial Enterprises above Designated Size from January to March (Group by Industries)
| ||||||
| Table III | ||||||
| Indicators | Revenue from Principal Business | Total Profits | Profits from Principal Business | |||
| Accumulated to March (100 million yuan) | Increase rate Y/Y (%) | Accumulated to March (100 million yuan) | Increase rate Y/Y (%) | Accumulated to March (100 million yuan) | Increase rate Y/Y (%) | |
|
|
|
|
|
|
|
|
| Total | 239553.9 | 8.0 | 12942.4 | 10.1 | 12238.5 | 9.4 |
| Mining and Washing of Coal | 7012.5 | -8.3 | 323.2 | -41.2 | 324.9 | -40.3 |
| Extraction of Petroleum and Natural Gas | 2870.5 | 0.4 | 993.6 | -6.3 | 999.3 | -6.4 |
| Mining of Ferrous Metal Ores | 1967.7 | 3.8 | 167.6 | 5.1 | 157.7 | -2.4 |
| Mining of Non-Ferrous Metal Ores | 1300.2 | 4.1 | 123.8 | -15.6 | 123.6 | -14.8 |
| Mining And Processing of Nonmetal Ores | 1075.2 | 10.7 | 75.0 | 9.6 | 75.6 | 7.8 |
| Processing of Food From Agricultural Products | 13790.1 | 8.6 | 600.8 | 8.2 | 597.0 | 8.7 |
| Manufacture of Foods | 4506.2 | 11.2 | 353.5 | 7.9 | 348.5 | 7.3 |
| Manufacture of Wines, Beverage and Refined Tea | 3755.6 | 6.6 | 394.0 | 0.0 | 391.6 | -2.0 |
| Manufacture of Cigarettes And Tobacco | 2709.3 | 4.0 | 432.2 | -0.1 | 442.8 | 0.7 |
| Manufacture of Textile | 8139.7 | 8.2 | 380.6 | 12.4 | 375.9 | 12.3 |
| Manufacture of Textile Wearing Apparel And Ornament | 4372.4 | 9.4 | 232.7 | 9.7 | 233.4 | 12.8 |
| Manufacture of Leather, Fur, Feather Aad Its Products | 2876.4 | 11.1 | 177.3 | 19.5 | 176.8 | 18.7 |
| Processing of Timbers, Manufacture of Wood, Bamboo, Rattan, Palm, and Straw Products | 2659.4 | 12.3 | 154.3 | 15.5 | 154.5 | 16.2 |
| Manufacture of Furniture | 1496.0 | 10.6 | 75.4 | 10.2 | 74.1 | 9.1 |
| Manufacture of Paper and Paper Products | 3174.0 | 6.7 | 142.1 | 3.3 | 136.5 | 2.2 |
| Printing, Reproduction of Recording Media | 1251.7 | 10.3 | 87.3 | 12.2 | 83.6 | 9.6 |
| Manufacture of Articles for Culture, Education, Artwork, Sport and Entertainment Activity | 2864.9 | 9.4 | 129.3 | 22.1 | 127.8 | 23.6 |
| Processing of Petroleum, Coking, Processing of Nucleus Fuel | 9736.8 | -1.0 | 90.9 | 3.4 | 90.2 | 5.7 |
| Manufacture of Chemical Raw Material and Chemical Products | 18197.7 | 10.8 | 779.1 | 10.0 | 751.8 | 11.6 |
| Manufacture of Medicines | 5069.3 | 13.7 | 498.7 | 14.0 | 471.8 | 9.4 |
| Manufacture of Chemical Fibres | 1551.7 | 4.6 | 37.9 | 4.7 | 32.7 | -4.1 |
| Manufacture of Rubber and Plastics Products | 6351.2 | 10.8 | 352.6 | 16.3 | 351.4 | 15.3 |
| Manufacture of Non-Metallic Mineral Products | 11334.7 | 13.0 | 690.9 | 26.7 | 661.3 | 28.7 |
| Manufacture and Processing of Ferrous Metals | 17719.8 | 1.9 | 187.2 | -19.9 | 173.6 | -23.4 |
| Manufacture and Processing of Non-Ferrous Metals | 10809.1 | 7.2 | 204.7 | -13.6 | 176.1 | -17.1 |
| Manufacture of Fabricated Metal Products | 7311.0 | 9.8 | 351.6 | 15.0 | 352.5 | 14.6 |
| Manufacture of General-Purpose Machinery | 9725.3 | 11.5 | 574.3 | 16.3 | 555.0 | 17.3 |
| Manufacture of Special-Purpose Machinery | 7372.8 | 12.3 | 409.2 | 11.7 | 392.8 | 11.0 |
| Manufacture of Motor Vehicles | 15326.4 | 17.3 | 1331.3 | 29.8 | 1157.5 | 30.7 |
| Manufacture of Railway Locomotives, Building of Ships and Boats, Manufacture of Air and Spacecrafts and Other Transportation Equipments | 3113.5 | 8.1 | 163.8 | 21.6 | 152.2 | 23.3 |
| Manufacture of Electrical Machinery and Equipment | 13886.5 | 10.3 | 690.1 | 28.2 | 639.3 | 27.0 |
| Manufacture of Computer, Communication Equipment and Other Electronic Equipment | 17884.1 | 7.2 | 533.7 | 21.5 | 470.1 | 26.6 |
| Manufacture of Measuring Instrument and Meter | 1679.5 | 11.6 | 110.1 | 10.5 | 104.0 | 13.8 |
| Production and Supply of Electric Power and Heat Power | 13342.4 | 4.8 | 940.9 | 32.3 | 762.4 | 31.6 |
| Production and Distribution of Gas | 1199.7 | 23.7 | 94.1 | 3.9 | 76.4 | -2.8 |
| Production and Distribution of Water | 349.1 | 7.6 | 7.7 | 305.3 | -2.4 | (Note) |
|
|
|
|
|
|
|
|
Annotations:
1. Explanatory Notes:
Total Profits: refer to the final achievement of production and operation activities of the enterprises, represented by total profits after deducting losses (loss is expressed by the negative figure).
Profits from Principal Business = Revenue from principal business – Cost of principal business – Tax and extra charges of principal business – Selling expenses – Administrative expenses – Financial expenses
Revenue from Principal Business: refers to total income of enterprises gained from principal business operation.
Main Business Cost: refers to the total costs of enterprises incurred by principal business operation.
Receivable Accounts: refers to the funds received by enterprises from units purchasing goods or receiving labor services through selling goods, products, proving labor services and etc.
Finished Goods: refers to manufactured products which are ready for sale by the end of report period.
Main Business Income Margin = Total profits / Revenue from principal business × 100%, unit: %.
Costs of Revenue from Principal Business for per Hundred yuan = The cost of revenue from principal business / The revenue from principal business ×100, unit: yuan.
Main Business Income Brought by per Hundred yuan Assets = Main business income / Average assets × 12 ÷ The cumulative number of months × 100, unit: yuan.
Turnover Days of Finished Goods = 360 × Average finished goods / Main business cost ÷ 12 × The cumulative number of months, unit: days.
2. Statistical Coverage
Since 2011, enterprises above designated size refers to all industrial enterprises with revenue from principal business over 20 million yuan (the former is 5 million yuan).
3. Data Collection
Since 2011, the Financial Report of Enterprises Above Designated Size conducts complete survey by month (the data on January are not required to report).
4. Standard Industrial Classification
Since 2012, the new Industrial Classification for National Economic Activities (GB/T 4754-2011) was implemented by NBS, the industrial divisions were expanded to 41 from 39, please refer to http://www.stats.gov.cn/tjsj/tjbz/hyflbz.