China Innovation Index (CII) Was 148.2 in 2012
In order to objectively reflect the development of China’s innovation capability in the process of building an innovation-oriented country, the China Innovation Index (CII) in 2012 was estimated by CII research group of Department of Social, Science and Technology, and Cultural Statistics of the NBS, based on releasing China Innovation Index (CII): 2005-2011. The results showed that the CII was 148.2 in 2012 (CII in 2005 was 100), an increase of 6.2 percent over the previous year.
CII evaluation index system includes 4 components, which were innovation environment, innovation input, innovation output and innovation effectiveness, and a total of 21 evaluation indices (see the attached table in annotations). Among CII, the Innovation Environment Index, Innovation Input Index, Innovation Output Index, and Innovation Effectiveness Index were 144.0, 152.2, 164.2 and 132.4 respectively, up by 4.3, 8.2, 9.5 and 2.2 percent respectively over the previous year. The estimation results showed that China’s innovation environment continued to be optimized, innovation input had been strengthened constantly, innovation output capacity had been improved obviously, innovation effectiveness had been enhanced steadily.
| China Innovation Index from 2005 to 2012 | ||||||||
|
| 2005 | 2006 | 2007 | 2008 | 2009 | 2010 | 2011 | 2012 |
|
|
|
|
|
|
|
|
|
|
| China Innovation Index | 100 | 105.7 | 110.8 | 116.5 | 125.5 | 131.8 | 139.6 | 148.2 |
| I. Innovation Environment Index | 100 | 106.4 | 112.1 | 114.4 | 121.7 | 131.0 | 138.1 | 144.0 |
| 1. Index of Population with Technical Secondary School, College or above Degree among Economically Active Population | 100 | 111.9 | 121.2 | 123.7 | 134.3 | 161.7 | 184.7 | 194.7 |
| 2. Per Capita GDP Index | 100 | 112.1 | 127.3 | 138.9 | 150.9 | 165.9 | 180.4 | 193.8 |
| 3. Informatization Index | 100 | 103.7 | 107.4 | 111.1 | 115.7 | 120.0 | 124.3 | 128.4 |
| 4. Index of The Proportion of Science and Technology Funds in Financial Allocations | 100 | 106.2 | 107.9 | 104.8 | 107.4 | 116.4 | 114.1 | 113.0 |
| 5. Index of The Proportion of Enterprises Enjoying Tax Breaks of R&D Costs Deduction | 100 | 98.7 | 99.0 | 98.2 | 106.0 | 103.0 | 106.3 | 113.5 |
| II. Innovation Input Index | 100 | 103.1 | 107.8 | 113.5 | 130.5 | 132.7 | 140.7 | 152.2 |
| 1. Index of Full-time Equivalent of R&D Personnel per 10 Thousand Persons | 100 | 109.5 | 125.9 | 141.8 | 164.5 | 182.5 | 205.0 | 229.7 |
| 2. Index of the Proportion of R&D Expenditure in GDP | 100 | 105.3 | 106.1 | 111.4 | 129.2 | 133.3 | 139.2 | 150.0 |
| 3. Index of Per capita funding for basic research personnel | 100 | 104.2 | 110.8 | 125.7 | 143.6 | 163.5 | 187.0 | 206.2 |
| 4. Index of The Proportion of R&D Expenditure in Main Business Income | 100 | 101.8 | 104.9 | 108.3 | 107.2 | 112.8 | 115.9 | 119.7 |
| 5. Index of The Proportion of Enterprises with R&D Institutions | 100 | 99.8 | 102.6 | 103.4 | 132.3 | 117.6 | 124.4 | 142.7 |
| 6. Index of The Proportion of Enterprises Developing Industry-University-Research Cooperation | 100 | 98.3 | 98.6 | 96.0 | 114.6 | 103.7 | 100.9 | 102.5 |
| III. Innovation Output Index | 100 | 109.0 | 113.4 | 123.2 | 127.4 | 137.2 | 150.0 | 164.2 |
| 1. Index of The Number of Scientific Papers per 10 Thousand Persons | 100 | 111.8 | 119.9 | 124.5 | 147.8 | 152.8 | 154.5 | 155.6 |
| 2. Index of The Number of Patents Granted per 10 Thousand R&D Personnel | 100 | 118.5 | 138.2 | 142.6 | 174.2 | 230.6 | 243.8 | 284.9 |
| 3. Index of The Proportion of Invention Patents Granted in Patents Granted | 100 | 92.9 | 87.8 | 109.6 | 108.0 | 89.3 | 105.4 | 102.5 |
| 4. Index of Trademark Ownership per Hundred Enterprises | 100 | 98.7 | 99.0 | 102.3 | 94.7 | 100.1 | 112.0 | 125.2 |
| 5. Index of Volume of Transaction in Technology Market per Ten Thousand Scientific and Technical Personnel | 100 | 127.0 | 130.6 | 142.9 | 127.8 | 155.3 | 171.7 | 211.1 |
| IV. Innovation Effectiveness Index | 100 | 104.4 | 110.0 | 114.7 | 122.3 | 126.4 | 129.5 | 132.4 |
| 1. Index of The Proportion of Sales Revenue of New Products in Main Business Income | 100 | 101.3 | 107.4 | 109.7 | 118.7 | 115.2 | 113.9 | 111.5 |
| 2. Index of The Proportion of High-Tech Products Export in Goods Export | 100 | 101.4 | 99.5 | 101.4 | 109.5 | 109.0 | 100.9 | 102.5 |
| 3. Index of Energy Consumption for Unit GDP | 100 | 102.8 | 108.2 | 114.2 | 118.5 | 123.5 | 126.1 | 130.6 |
| 4. Labor Productivity Index | 100 | 114.5 | 131.0 | 138.6 | 158.5 | 177.1 | 210.1 | 225.8 |
| 5. Index of The Contribution Rate of Scientific and Technological Progress | 100 | 102.5 | 106.5 | 113.0 | 112.0 | 117.8 | 119.7 | 120.8 |
|
|
|
|
|
|
|
|
|
|
Annotations:
China Innovation Index System and the Compiling Methods of the Index
I. China Innovation Index System
China innovation index system is divided into three levels. The first level is to reflect the overall development of China's innovation, achieved by calculating the innovation index; the second level is to reflect the development of China’s innovation environment, innovation input, innovation output and innovation effectiveness, achieved by calculating the sub-indices of these 4 fields; the third level is to reflect the specific development of different aspects composing innovation capability, achieved by 21 evaluation indices selected from the 4 fields above (see the attached table for the framework of index system). Brief descriptions of the 4 fields and 21 evaluation indices are as follows:
1. Innovation Environment
This field is to mainly reflect the support for basic conditions which are necessary to drive the development of innovation capability, such as human and financial resources, etc, and to reflect policy environment’s guidance and support for innovation, including a total of five evaluation indicators.
i. Population with Technical Secondary School, College or above Degree among Economically Active Population
This indicator is to reflect the overall quality of China's labor force and the status of innovation human resources. Economically active population refers to population all aged 16 and above, providing labor supply for various economic production and service activities in a period of time.
ii. Per Capita GDP
This is the most representative indicator to reflect one country's economic strength, and can reflect the relationship of interdependence and mutual promotion between economic growth and innovation capacity development.
iii. Informatization Index
This index is a comprehensive measure of the overall level of national informatization development in terms of infrastructure construction, application and environmental constraints of informatization, to reflect the ability that a society creates, accesses, utilizes and shares information and knowledge by using information and communication technology, as well as the role of informatization development in promoting social and economic development. Data of this indicator comes from the calculation results of the evaluation of informatization development index, carried out by relevant departments.
iv. The Proportion of Science and Technology Funds in Financial Allocations
Financial science and technology funds plays a driving and guiding role in the whole society for innovation input and carrying out innovation activities. This indicator reflects the direct government funding for innovation as well as government’s planning and guiding for key and frontier areas.
v. The Proportion of Enterprises Enjoying Tax Breaks of R&D Costs Deduction
The policy of pre-tax R&D costs deduction is considered to be one of the most direct and beneficial support policies that encourage enterprises to increase investment in R&D and develop innovation activities. The indicator reflects the implementation of government policies, thus reflecting the innovation environment of enterprises from another angle. Restricted by data sources, data of this indicator comes from large and medium-sized industrial enterprises.
2. Innovation Input
This field reflects the roles and relationships of the subjects among national innovation system, through innovation investment in human and financial resources, building of key departments of enterprise innovators (R&D institutions), and the cooperation of innovators. Due to the lack of indicators of human and financial investment in innovation, and currently R&D is the most important part of China’s innovation, we use R&D investment in place of innovation investment here. There are 6 indicators in this field.
i. Full-time Equivalent of R&D Personnel per 10 Thousand Persons
Refers to the full-time equivalent of R&D personnel calculated on average of the entire resident population. The indicator reflects the scale and strength of human input of independent innovation. R&D Personnel, including R&D Personnel of enterprises, scientific research institutions, colleges and universities, is a joint force of R&D human input of various innovators in the whole society. Full-time equivalent of R&D personnel is the R&D personnel converted by workload.
ii. The Proportion of R&D Expenditure in GDP
The indicator, also known as R&D investment intensity, is an international core indicator that reflects national or regional level of investment in science and technology, but also an important evaluation indicator in China’s medium and long-term development programs on science and technology.
iii. Per capita funding for basic research personnel
Defined as the average funding for full-time equivalent of basic research personnel. Basic research is the foundation for science and technology development, to some extent, its level can represent a country's original innovation ability. The index system will reflect the efforts countries made in strengthening the ability of original innovation through this indicator.
iv. The Proportion of R&D Expenditure in Main Business Income
Enterprises are the main innovators, and industrial enterprises occupy a dominant position in enterprise innovation activities. The indicator reflects the investment of main innovators. Restricted by data sources, data of this indicator comes from large and medium-sized industrial enterprises with R&D activities.
v. The Proportion of Enterprises with R&D Institutions
R&D institutions operated by enterprises are specialized agencies for enterprises to carry out R&D activities, and an important safeguard for enterprises to carry out R&D activities continuously and steadily. The indicator reflects the ability of enterprises to carry out R&D activities continuously from one side. Restricted by data sources, data of this indicator comes from large and medium-sized industrial enterprises.
vi. The Proportion of Enterprises Developing Industry-University-Research Cooperation
This is an important indicator to reflect industry-university-research cooperation. The index system reflects the cooperation among various main innovators through industry-university-research cooperation. Restricted by data sources, data of this indicator comes from large and medium-sized industrial enterprises.
3. Innovation Output
This field reflects the intermediate innovation output through papers, patents, trademarks, and technological achievements. The field consists of five indicators.
i. The Number of Scientific Papers per 10 Thousand Persons
Scientific Paper refers to academic paper, generated by science and technology project which is set up by enterprises and institutions, and published in journals with standard serial number. Scientific paper is one of the important achievements of the intermediate innovation output. This indicator reflects the level of output and efficiency of R&D activities.
ii. The Number of Patents Granted per 10 Thousand R&D Personnel
Defined as the number of patents granted on average of full-time equivalent of R&D personnel. The number of patents in the index system is the quantity of domestic service patents, and is another important achievement of intermediate innovation output. This indicator is also important to reflect the level and efficiency of output of R&D activities.
iii. The Proportion of Invention Patents Granted in Patents Granted
Invention patent is the most high-tech of three kinds of patents, able to reflect the quality of patent, but also reflects the market value and competitiveness of R&D results. The number of invention patents in the index system is the quantity of domestic service invention patents. This is a key indicator reflecting the quality of patents.
iv. Trademark Ownership per Hundred Enterprises
Trademark ownership refers to trademarks owned by enterprises, which are registered in domestic and overseas intellectual property divisions, and protected by intellectual property laws. To a certain extent, the indicator reflects the ownership of enterprises’ self-owned brands and operating capacity of these self-owned brands. Restricted by data sources, data of this indicator comes from large and medium-sized industrial enterprises.
v. Volume of Transaction in Technology Market per Ten Thousand Scientific and Technical Personnel
Refers to the average volume of transaction in technology market per ten thousand scientific and technical personnel. The indicator reflects the overall scale of technology transformation and commercialization of research findings. Volume of transaction in technology market refers to the total value of transaction contracts in the national technology market.
4. Innovation Effectiveness
This field reflects the impact of innovation on economic and social development through product structure adjustment, international competitiveness of industry, energy conservation, economic growth, etc. The field consists of five indicators.
i. The Proportion of Sales Revenue of New Products in Main Business Income
Sales revenue of new products is an indicator reflecting enterprises’ innovations, an indicator of successfully driving new products to market. The indicator is to reflect the effect of innovation on product structure adjustment. Restricted by data sources, data of this indicator comes from large and medium-sized industrial enterprises
ii. The Proportion of High-Tech Products Export in Goods Export
There is an interaction between high-tech industry and innovation. The indicator reflects the effect of innovation on international competitiveness of industry through changes in high-tech products export. Data of this indicator comes from industrial enterprises above designated size.
iii. Energy Consumption for Unit GDP
The indicator refers to the energy consumption for every ten thousand yuan of GDP, calculated in terms of standard coal. Energy conservation is one of the purposes for which enterprises develop technology innovation, and innovation is the approach and support of saving energy, playing a decisive role. The indicator reflects the effect of innovation on reducing energy consumption.
iv. Labor Productivity
Means the total industrial output value to annual average employed persons ratio over a period of time. Innovation is an important factor affecting labor productivity, and to improve labor productivity is one of the purposes for which enterprises innovate. The indicator reflects the role of innovation in promoting the development of industrial economy, and data of this indicator comes from industrial enterprises above designated size.
v. The Contribution Rate of Scientific and Technological Progress
Refers to the contribution share of generalized technological progress for economic growth, i.e., the contribution of other factors for economic growth with capital and labor factors deducted. Data of this indicator comes from the calculation results of evaluating the contribution rate of scientific and technological progress, carried out by relevant departments. The indicator is a comprehensive measurement of the competition strength of science and technology, as well as the transforming of science and technology into realistic productive force. In the index system, data in reporting period and the average in past 4 years is used by this indicator, to reflect the promoting effects of innovation for national economic development.
II. Compilation Method of China Innovation Index
1. Determine the Index Weights
Based on comparison of domestic and overseas weight determining methods, method of stepwise equally weighted is used to apportion weights in this project, that is the weight of every field is 1/4; in certain field, the weight of some index in the field is 1/n (n is the number of indices in the field); therefore, the final weight of some index is 1/4n. Please see the attached table for the weights of all the indices.
2. Calculate the Growth Rate of Index
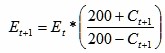
Growth rate or development speed of different indices is usually compared by using the index value in the base year as a benchmark. In particular index system, if the growth rates of all indices are calculated and weightedly averaged according to usual method, as the growth rates of some indices may be too high (or low), the growth rates of different indices will be incomparable (i.e., the effects of indices with too high or low growth rates mask the effects of other indices), resulting in the distortion of the entire index system. Therefore, the growth rate ranges of indices in the index system must be controlled. A relatively good approach is to set a two-year average of the growth rate of one index as the base value, which will make the growth rate ranges of indices be controlled in the [-200,200] range.
In the index system, except for the “energy consumption for every ten thousand yuan of GDP” as an inverse index, the remaining 20 indices are all normal indices. The growth rates of inverse indices are calculated after taking the reciprocal of inverse indices.
Indices’ growth rates in adjacent years are calculated as follows:
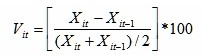
Where i is the serial number of indices, t is the year, t>=2006.
(As 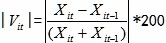 , and
, and 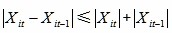 , for
, for  and
and  , we have
  .
.
3. Compose Indices of Sub-Fields and General Index
Index Composition is divided into the following three steps:
i. Calculate the Weighted Growth Rate of The Indices in Every Field
Where  is the weight of indices in the field, k is the number of indices in the field, t is the year, t>=2006.
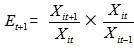
ii. Calculate the Accumulated Development Sub-Indices with Fixed Base of Every Field
Where t is the year, t>=2005,  =100.
=100.
(If the development speed with fixed base of a certain index in the index system is calculated in this method, the result will be the same with usual methods, i.e., the development speed with fixed base in current year equals to the product of the development speed with fixed base in last year and the development speed in current year then divided by 100, the development speed with fixed base in current year equals to index value in current year multiplied by 100 then divided by the value in base period.
This is because:

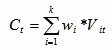
iii. Calculate the Accumulated Development General Index with Fixed Base
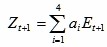
Where t is the year,  is the weight of every sub-field to the general index.
| Framework of China Innovation Index System | |||
|
| Indicators | Unit | Weight |
|
|
|
|
|
| Innovation Environment (1/4) | 1.1 Index of Population with Technical Secondary School, College or above Degree among Economically Active Population | person/10,000 persons | 1/5 |
| 1.2 Per Capita GDP Index | yuan/ person | 1/5 | |
| 1.3 Informatization Index | % | 1/5 | |
| 1.4 Index of The Proportion of Science and Technology Funds in Financial Allocations | % | 1/5 | |
| 1.5 Index of The Proportion of Enterprises Enjoying Tax Breaks of R&D Costs Deduction | % | 1/5 | |
| nnovation Input (1/4) | 2.1 Index of Full-time Equivalent of R&D Personnel per 10 Thousand Persons | man-year/10,000 persons | 1/6 |
| 2.2 Index of the Proportion of R&D Expenditure in GDP | % | 1/6 | |
| 2.3 Index of Per capita funding for basic research personnel | 10,000 yuan/ man-year | 1/6 | |
| 2.4 Index of The Proportion of R&D Expenditure in Main Business Income | % | 1/6 | |
| 2.5 Index of The Proportion of Enterprises with R&D Institutions | % | 1/6 | |
| 2.6 Index of The Proportion of Enterprises Developing Industry-University-Research Cooperation | % | 1/6 | |
| Innovation Output (1/4) | 3.1 Index of The Number of Scientific Papers per 10 Thousand Persons | piece/10,000 persons |
1/5 |
| 3.2 Index of The Number of Patents Granted per 10 Thousand R&D Personnel | piece/10,000 man-year | 1/5 | |
| 3.3 Index of The Proportion of Invention Patents Granted in Patents Granted | % | 1/5 | |
| 3.4 Index of Trademark Ownership per Hundred Enterprises | piece/100 enterprises | 1/5 | |
| 3.5 Index of Volume of Transaction in Technology Market per Ten Thousand Scientific and Technical Personnel | 100 million yuan/10,000 persons | 1/5 | |
| Innovation Effectiveness (1/4) | 4.1 Index of The Proportion of Sales Revenue of New Products in Main Business Income | % | 1/5 |
| 4.2 Index of The Proportion of High-Tech Products Export in Goods Export | % | 1/5 | |
| 4.3 Index of Energy Consumption for Unit GDP | tons of standard coal/10,000 yuan | 1/5 | |
| 4.4 Labor Productivity Index | 10,000 yuan / person | 1/5 | |
| 4.5 Index of The Contribution Rate of Scientific and Technological Progress | % | 1/5 | |
|
|
|
|
|