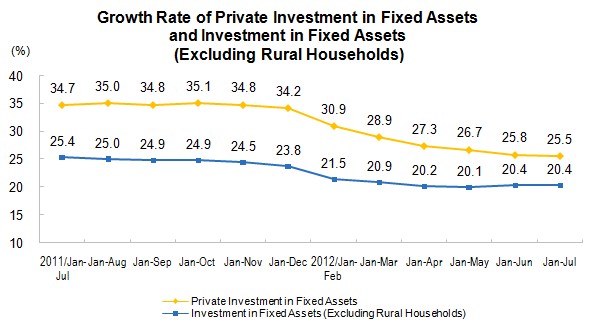
Private Investment in Fixed Assets for the First Seven Months of 2012
In the first seven months of 2012, the private investment in fixed assets reached 11,448.0 billion yuan, a year-on-year nominal increase of 25.5 percent, decreased 0.3 percentage points over the first six months. The proportion of private investment in fixed assets to the total investment in fixed assets was 62.1 percent, which kept the same level over the first six months.
In term of different areas, the private investment in fixed assets in eastern region amounted to 5,772.2 billion yuan, went up by 22.5 percent year-on-year, and 0.4 percentage points lower over the first six months; that of central region, 3,379.6 billion yuan, surged 27.4 percent, 0.1 percentage points lower over the first six months; that of western region, 2,296.3 billion yuan, increased 30.8 percent, 0.4 percentage points lower over the first six months.
In term of different industries, the private investment in fixed assets in primary industry reached 314.7 billion yuan, a year-on-year increase of 32.2 percent, 1.0 percentage points higher over the first six months; that in the secondary industry amounted to 6,082.5 billion yuan, increased 29.2 percent and 0.3 percentage points higher; that in the tertiary industry was 5,050.9 billion yuan, went up by 21.1 percent and 0.9 percentage points lower.
Of the secondary industry, industrial private investment in fixed assets reached 5,989.3 billion yuan, a year-on-year increase of 29.1 percent, and 0.2 percentage points lower over the first six months, of which, that of mining industry was 356.3 billion yuan, increased 25.8 percent, and 3.4 percentage points lower; that of the manufacturing industry was 5,407.3 billion yuan, increased 29.6 percent, and 0.5 percentage points highter; that of the production and supply of electric power, heat power, gas and water was 225.7 billion yuan, increased 23.0 percent, and 0.5 percentage points lower.
|
Private Investment in Fixed Assets For January to July | ||
|
Indicators |
Jan-Jul | |
|
Absolute Value |
Increase rate Y/Y | |
|
(100 Million Yuan) |
(%) | |
|
|
|
|
|
Private Investment in Fixed Assets |
114480 |
25.5 |
|
|
| |
|
Eastern Region |
57722 |
22.5 |
|
Central Region |
33796 |
27.4 |
|
Western Region |
22963 |
30.8 |
|
Grouped by Types of Industry |
|
|
|
Primary Industry |
3147 |
32.2 |
|
Secondary Industry |
60825 |
29.2 |
|
Tertiary Industry |
50509 |
21.1 |
|
Grouped by Industrial Sectors |
|
|
|
Agriculture, Forestry, Animal Husbandry and Fishery |
3147 |
32.2 |
|
Mining |
3563 |
25.8 |
|
Of which: Mining and Washing of Coal |
1401 |
15.3 |
|
Extraction of Petroleum and Natural Gas |
82 |
112.1 |
|
Ore Mining, Smelting and Pressing of Ferrous Metals |
661 |
29.3 |
|
Ore Mining, Smelting and Pressing of Non-Ferrous Metal |
575 |
26.0 |
|
Ore Mining, Processing of Non-Metallic Minerals |
747 |
31.1 |
|
Manufacturing |
54073 |
29.6 |
|
Of which: Manufacture of Non-metallic Mineral Products |
5883 |
21.7 |
|
Smelting and Pressing of Ferrous Metals |
1977 |
10.3 |
|
Smelting and Pressing of Non-Ferrous Metal |
1776 |
19.7 |
|
Manufacture of General Purpose Machinery |
3980 |
36.1 |
|
Manufacture of Special Purpose Machinery |
3788 |
58.8 |
|
Manufacture of automobile |
2968 |
44.9 |
|
Manufacture of railways, shipbuilding, aerospace and other transportation equipment |
931 |
17.8 |
|
Manufacture of Electrical Machinery & Equipment |
3920 |
12.8 |
|
Manufacture of Telecommunications Equipment, Computers and Other Electronic Equipment |
1860 |
43.9 |
|
Production and Supply of Electricity ,Gas and Water |
2257 |
23.0 |
|
Of which: Production and Supply of Electric Power and Heat Power |
1598 |
20.6 |
|
Construction |
931 |
35.0 |
|
Transport, Storage and Post |
2917 |
34.7 |
|
Of which: Railway Transportation |
76 |
-15.4 |
|
Road Transportation |
998 |
37.4 |
|
Management of Water Conservancy, Environment and Public Facilities |
3030 |
22.0 |
|
Of which: Management on Water Resource |
227 |
3.1 |
|
Management on Public Facilities |
2629 |
24.6 |
|
Education |
557 |
41.7 |
|
Health, Social Works |
322 |
43.4 |
|
Culture, Sports and Entertainment |
968 |
34.5 |
|
Public Management, Social Security and Social Organizations |
937 |
6.4 |
|
|
|
|
|
Note: For parts of data, the total is not equal to the total of sub-items due to round-off. | ||
Annotations:
1. In order to implement the requirements of “statistics departments should strengthen the statistical work on private investment, and accurately reflect the progress and distribution of private investment”, proposed by the Several Opinions of the State Council on Encouraging and Guiding the Healthy Development of Private Investment and Notice of the General Office of the State Council on the Division of Key Work of Encouraging and Guiding the Healthy Development of Private Investment, NBS formulated regulations on the definition and statistical coverage on private investment in fixed assets in early 2012, and started to release the data on private investment in fixed assets monthly since May, 2012.
2. Explanatory Notes on Indicators
Private investment in fixed assets refers to the investment in construction and purchase of fixed assets within the territory of the People's Republic of China, by collective, private, and personal domestic enterprises and institutional units as well as the enterprises controlled (including absolutely controlled and relatively controlled) by these units.
3. Statistical Coverage
The statistical coverage of private investment in fixed assets is determined according to the types of industrial and commercial registration of the fixed assets investment projects units, which includes:
(1) The investment in fixed assets of collective enterprises, joint-stock cooperative enterprises, private enterprises, private partnerships, private limited liability companies, self-employed businessmen, individual partnerships and other pure non-governmental entities with industrial and commercial registration;
(2) All the investment in fixed assets of the main investment units, which are controlled by collective enterprises, private enterprises and individuals in the mixed economic components with industrial and commercial registration.
4. Data Collection
Private investment in fixed assets is a part of investment in fixed assets, and the reports of private investment on fixed assets are collected monthly with complete enumeration (no report in January), which is the same as the report of investment on fixed assets.
5. Classification on East, Central and West Region
Eastern region: including Beijing, Tianjin, Hebei, Shanghai, Jiangsu, Zhejiang, Fujian, Shandong, Guangdong and Hainan. Central region: including Shanxi, Anhui, Jiangxi, Henan, Hubei and Hunan. Western region: including Inner Mongolia, Guangxi, Chongqing, Sichuan, Guizhou, Yunnan, Tibet, Shaanxi, Gansu, Qinghai, Ningxia and Xinjiang.
6. Standard Industrial Classification
Since 2012, NBS performed the new industrial classification standard on national economy (GB/T 4754-2011), please refer to http://www.stats.gov.cn/tjbz
7. Calculation of the Growth Rates
The growth rates of private investment in fixed assets are calculated in nominal except that in Jan.-Mar., Jan.-Jun., Jan-Sep. and Jan.-Dec. in case of the price indices of investment in fixed assets are calculated on quarterly.