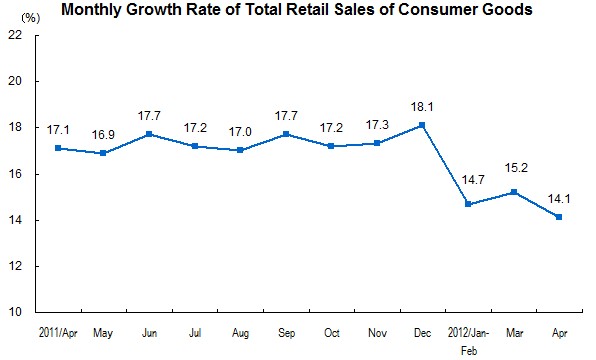
Total Retail Sales of Consumer Goods in April 2012
In April, the total retail sales of consumer goods reached 1,560.3 billion yuan, up by 14.1 percent year-on-year (Nominal growth rate. The real growth rate was 10.7 percent. The follows are nominal growth rates if there’s no additional explanation). Of the total, the retail sales of consumer goods of industrial enterprises (units) above designated size was 748.3 billion yuan, increased 14.6 percent. From January to April, the total retail sales of consumer goods reached 6,492.2 billion yuan, up by 14.7 percent year-on-year (actual increase was 10.9 percent after deducting price factors). The total retail sales of consumer goods increased 1.13 percent in April, month-on-month.
In terms of different areas, the retail sales of consumer goods in urban areas was 1,355.4 billion yuan in April, up by 14.0 percent, year-on-year; while that in rural areas was 204.9 billion yuan, up by 14.5 percent, year-on-year.
In terms of different consumption patterns, the catering services in April gained 168.9 billion yuan, up by 13.0 percent, year-on-year; the retail sales of goods gained 1,391.4 billion yuan, up by 14.2 percent, year-on-year, of which, the amount of enterprises (units) above designated size was 692.8 billion yuan, up by 14.8 percent, year-on-year. Total Retail Sales of Consumer Goods in April Item April Jan-Apr Absolute Value (100 million yuan) Y/Y (%) Absolute Value (100 million yuan) Y/Y (%) Total Retail Sales of Consumer Goods 15603 14.1 64922 14.7 Of Which: Retail Sales of the Enterprises (units) above Designated Size 7483 14.6 30413 15.3 Grouped by Different Areas City 13554 14.0 56242 14.7 At and Below County Level 2049 14.5 8680 14.6 Grouped by Consumption Patterns Catering Services 1689 13.0 7116 13.3 Of which: Income of Catering Services of the Enterprises (units) above Designated Size 555 12.1 2304 13.7 Retail Sales of Goods 13914 14.2 57806 14.8 Of which: Income of Retail Sales of Goods of the Enterprises (units) above Designated Size 6928 14.8 28109 15.5 Of which: Grain, Oil, Foodstuff, Beverages, Tobacco and Liquor 864 18.5 3907 17.0 Garments, Footwear, Hats, Knitwear 682 19.5 3092 15.6 Cosmetics 99 14.2 429 17.1 Gold, Silver and Jewelry 161 12.5 753 15.7 Commodities 243 16.0 1035 16.2 Sports and Recreation Articles 32 10.3 125 6.3 Household Appliances and AV Equipment 459 7.7 1698 2.4 Traditional Chinese and Western Medicines 369 22.7 1434 23.8 Cultural and Office Appliances 150 24.0 576 17.4 Furniture 110 24.0 406 25.0 Communication Appliances 112 37.6 470 42.0 Petroleum and Related Products 1397 15.9 5176 20.0 Automobile 1738 8.2 7056 10.3 Building and Decoration Materials 137 24.5 489 25.4 Notes: 2.For parts of data, the total is not equal to the total of sub-items due to round-off.
1.The growth rate in this table are all nominal growth rate.
Annotations:
1. Explanatory Notes
Total Retail Sales of Consumer Goods: refers to the sales of physical commodity or the income of catering services sold or provided by enterprises (units) to individuals, social organizations for non-production and non-operation purposes.
2.Statistical Coverage
The corporate enterprises, industrial activity units or self-employed individuals which retail goods or provide catering services. Enterprises (units) above designated size refer to those wholesale enterprises (units) with an annual revenue from primary business of 20 million yuan and above, those retail enterprises (units) with an annual revenue from primary business of 5 million yuan and above, and those hotel and catering enterprises (units) with an annual revenue from primary business of 2 million yuan and above.
3. Survey Methods
All enterprises (units) above designated size are surveyed, while the data of enterprises (units) below designated size are collected by sampling survey.
4. Month-on-Month Figure Revision
According to the auto-revision function of the seasonal adjustment model, the growth rate of the total retail sales of consumer goods from March 2011 was revised. The revised figures and figures for April are as follows:
|
The Month-on-Month Growth Rate | |
|
|
Growth Rate (%) |
|
|
|
|
2011-March |
1.26 |
|
April |
1.31 |
|
May |
1.35 |
|
June |
1.52 |
|
July |
1.33 |
|
August |
1.42 |
|
September |
1.52 |
|
October |
1.44 |
|
November |
1.43 |
|
December |
1.67 |
|
2012-January |
0.91 |
|
February |
1.32 |
|
March |
1.19 |
|
April |
1.13 |
|
|
|