Consumer Prices for November 2011
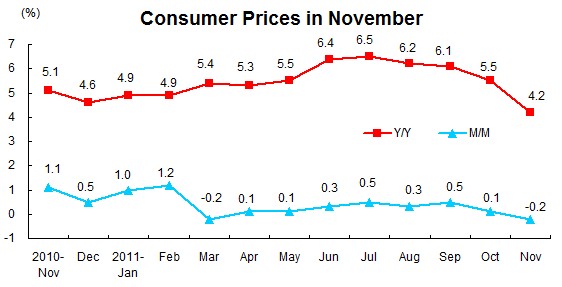
In November, the consumer price index went up by 4.2 percent year-on-year. The prices grew by 4.2 percent in cities and 4.3 percent in rural areas. The food prices went up by 8.8 percent while the non-food prices increased by 2.2 percent. The prices of consumer goods went up by 5.3 percent and the prices of services grew by 2.4 percent. In November, the month-on-month change of consumer prices was down by 0.2 percent. Of which, prices in cities and rural areas went down by 0.2 percent simultaneously. The food prices dropped 0.8 percent while the non-food prices increased by 0.1 percent. The prices of consumer goods decreased 0.2 percent, and the prices of services went down by 0.3 percent. From January to November, the consumer price index increased 5.5 percent over the same period of the previous year.
I. Year-on-Year Changes of Prices of Different Categories
Food Prices went up by 8.8 percent year-on-year, contributing nearly 2.70 percentage points to the overall growth. Of which, the prices of grain rose by 8.9 percent, meaning 0.25 percentage point growth in the overall price level; meat, poultry and related products, surged 19.6 percent, contributing 1.31 percentage points (price of pork was up by 26.5 percent, contributing 0.78 percentage points); fresh eggs, up 4.4 percent, contributing 0.04 percentage point; aquatic products, up 10.8 percent, contributing 0.24 percentage point; fresh vegetables, down 11.0 percent, fresh fruits, up 10.8 percent, contributing 0.20 percentage point, and grease, increased 8.9 percent, contributing 0.11 percentage point.
Prices for tobacco, liquor and articles went up by 3.8 percent year-on-year, of which, that for tobacco was up by 0.4 percent and liquor 9.1 percent.
Prices for clothing rose by 3.5 percent year-on-year. The clothes prices went up by 3.6 percent while the shoes prices increased by 2.7 percent.
Prices for household facilities, articles and maintenance services went up by 2.9 percent year-on-year, of which, prices for durable consumer goods was up by 1.0 percent, and household services, maintenance and renovation up by 11.6 percent.
Prices for health care and personal articles grew by 3.2 percent year-on-year. Of which, prices for western medicine went down by 0.6 percent; traditional Chinese medicine, up 11.1 percent; and health care services, up 0.6 percent.
Prices for transportation and communication rose by 0.5 percent year-on-year. Of which, prices for transportation facilities dropped by 0.2 percent; fuels and parts for vehicles, up 9.2 percent; fees for vehicles use and maintenance, up 4.6 percent; intercity traffic fares up 2.9 percent; incity traffic fares up 1.7 percent; and communication facilities down by 13.5 percent.
Prices for recreation, education, culture articles and services grew by 0.1 percent year-on-year. Of which, education went up by 0.8 percent; cultural and recreational articles up 1.4 percent; touring and outing up 3.3 percent; and durable goods for cultural and recreational use and services down by 6.4 percent.
Prices for residence went up by 3.3 percent year-on-year. Of which, prices for water, electricity and fuels rose by 1.3 percent; prices for building and building decoration materials up 3.4 percent; prices for renting up 3.7 percent.
According to estimation, in the 4.2 percent growth in November, the carryover effect of last year’s prices rising accounted for 0.5 percentage points, while new prices rising factors in this year accounted for 3.7 percentage points. The year-on-year growth rate of CPI in November declined 1.3 percentage points compared with that of October, mainly affected by two reasons: first, the higher cardinal number of last year, carryover effect in November significantly reduced; second, month-on-month prices for vegetables, meat, poultry and related products went down, thus driving the consumer price index decreased by 0.25 percentage points.
II. Month-on-Month Changes of Prices of Different Categories
In November, food prices down by 0.8 percent month-on-month, contributing 0.25 percentage point to the month-on-month growth of consumer prices. In November, price for fresh vegetables continued to decline 6.0 percent month-on-month, affecting 0.15 percentage points decrease in the overall price level. Price for meat, poultry and related products decreased 2.6 percent (that for pork declined 5.3 percent, 3.5 percentage points decrease compared with October.), price for fresh eggs dropped 4.0 percent, price for aquatic products declined 0.7 percent. Price changes of the above mentioned three items contributed 0.27 percentage points decrease to the overall price level. Price for grease decreased 0.1 percent (promoted 0.5 percentage point month-on-month), price for fresh fruits increased 6.8 percent (expanded 1.1 percentage points month-on-month), contributed 0.12 percentage points increase to the overall price level.
Non-food prices climbed 0.1 percent in November, affecting 0.07 percentage points increase in the overall price level. Of this total, prices for tobacco, liquor and articles, clothing, household facilities, articles and maintenance services, health care and personal articles, rose by 0.3, 1.4, 0.3, and 0.2 percent respectively. Effected by the impacts on tourism market, and after the off-season attraction tickets and travel prices in November, price for recreation, education, culture articles and service, transportation and communication, dropped 0.8 and 0.3 percent, respectively, price for housing remained general level. Consumer Prices in November Item November Jan-Nov M/M (%) Y/Y (%) Y/Y (%) Consumer Prices -0.2 4.2 5.5 Of which: Urban -0.2 4.2 5.4 Rural -0.2 4.3 6.0 Of which: Food -0.8 8.8 12.1 Non food 0.1 2.2 2.7 Of which: Consumer Goods -0.2 5.0 6.3 Services -0.3 2.4 3.6 Commodity Categories Food -0.8 8.8 12.1 Tobacco, Liquor and Articles 0.3 3.8 2.7 Clothing 1.4 3.5 2.0 Household Facilities, Articles and Maintenance Services 0.3 2.9 2.4 Health Care and Personal Articles 0.2 3.2 3.4 Transportation and Communication -0.2 0.5 0.5 Recreation, Education, Culture Articles and Services -0.8 0.1 0.4 Housing 0.0 3.0 5.6
Notes:
1. Explanation of Indicator. Consumer Price Index (CPI) is an index measuring changes over time in the price level of consumer goods and services purchased by residents, which comprehensively reflects changes of price level.
2. Statistical Coverage. Consumer Price Index (CPI) covers the prices of goods and services of eight categories and 262 basic divisions which cover the living consumption of urban and rural residents, including food; tobacco, liquor and articles; clothing; household facilities, articles and maintenance services; health care and personal articles; transportation and communication; recreation, education, culture articles and services and housing. Data are collected from 63,000 prices collection units in 500 cities and counties of the 31 provinces (autonomous regions and municipalities), which cover grocery stores, department stores, supermarkets, convenience stores, professional markets, franchise houses, shopping centers, open fairs and service consumption units etc.
3. Data Collection. Original data of consumer prices are collected by specific person in fixed place at fixed time.
4. From January 2011, the CPI calculation in China began to take 2010 as the base year. It was the second routine adjustment since the adoption of fixed-base price index in 2001. The first round base year was 2000, as changing every five years, the second round base year was 2005.
5. In accordance with the data of national survey of urban and rural household consumption expenditure in 2010 and data of other surveys conducted by relevant departments, the National Bureau of Statistics made a routine adjustment of the weights of CPI from January 2011. By using the new weights, the consumer price index in November went up by 4.225 percent year-on-year, or 0.189 percent month-on-month, while it was up 4.307 percent year-on-year, or 0.184 percent month-on-month if the former weights were used.