National Economy Maintained Steady and Fast Development in the First Three Quarters of 2011
Sheng Laiyun
Spokesman
National Bureau of Statistics of
18 October 2011
In the first three quarters of 2011, faced with the complicated and volatile international environment and the emerging challenges in domestic economic development, the Central Party Committee and the State Council firmly carried out the pro-active fiscal policy and prudent monetary policy, continuously strengthened and improved macro control. As a result, the national economy generally carried good development state and kept moving towards the expected direction of macro economic control.
According to the preliminary estimation, the gross domestic product (GDP) of
1. Agricultural Production Went on Steadily. The total output of summer grain was 126.27 million tons, an increase of 3.12 million tons, up by 2.5 percent year-on-year. The total output of early rice was 32.76 million tons, an increase of 1.43 million tons, up by 4.5 percent year-on-year. The autumn grain is expected to achieve a good harvest and the annual output of grain will be higher than that of last year. In the first three quarters of this year, the total output of pork, beef, mutton and poultry reached 54.53 million tons, a year-on-year growth of 0.2 percent. The output of pork was 35.68 million tons, down by 0.6 percent.
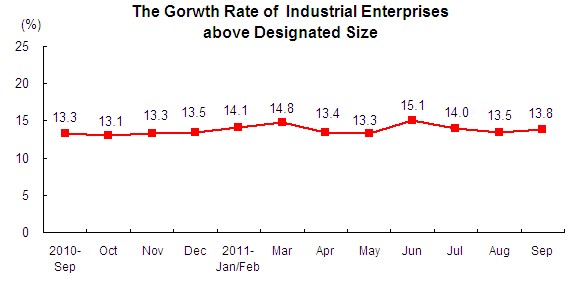
2. Industrial Production Realized a Steady Growth. In the first three quarters of this year, the total value added of the industrial enterprises above designated size was up by 14.2 percent year-on-year at comparable prices, 0.1 percentage point lower than that in the first half of this year. An analysis by types of ownership showed that the value added growth of the state-owned and state holding enterprises went up by 10.4 percent; collective enterprises by 9.6 percent; share-holding enterprises by 16.1 percent; and enterprises funded by foreign investors or investors from
In the first eight months of this year, the profits made by industrial enterprises above designated size stood at 3,228.1 billion yuan, up by 28.2 percent year-on-year. Among the 39 industrial divisions, 38 of them registered year-on-year increase in profits, and 1 division witnessed reduction. In the first eight months of this year, the costs of primary activities of the industrial enterprises above designated size accounted for 85.1 percent of the turnover from their primary activities, which was 0.3 percentage point higher than that in the first half of 2011. In August, the profit rate of industrial enterprises above designated size from their primary activities was 5.9 percent.
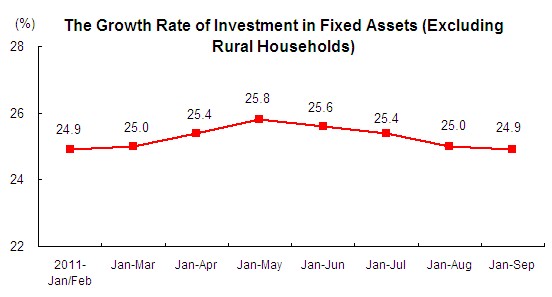
In the first three quarters of 2011, the investment in real estate development was 4,422.5 billion yuan, a year-on-year growth of 32.0 percent, or 0.9 percentage point lower than that in the first half of this year. Specifically, the investment in residential buildings reached 3,178.8 billion yuan, up by 35.2 percent. The floor space of commercial buildings sold in the first three quarters of 2011 reached 712.89 million square meters, a year-on-year growth of 12.9 percent. Specifically, the growth of residential buildings was up by 12.1 percent. In the first three quarters of this year, the sources of funds for real estate development enterprises from the current year reached 6,194.7 billion yuan, up by 22.7 percent year-on-year. In September, the national real estate climate index was 100.41.
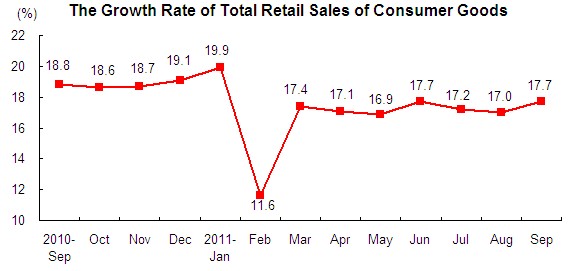
4. Sales on Domestic Markets Enjoyed a Steady Growth. In the first three quarters of this year, the total retail sales of consumer goods reached 13,081.1 billion yuan, a nominal year-on-year rise of 17.0 percent (a real growth of 11.3 percent after deducting price factors), or 0.2 percentage point higher than that of the first half of this year. Specifically, the retail sales of the enterprises (units) above designated size stood at 6,016.5 billion yuan, up by 23.5 percent. Analyzed by different areas, the retail sales in urban areas reached 11,326.5 billion yuan, up by 17.1 percent, and the retail sales in rural areas stood at 1,754.6 billion yuan, up by 16.4 percent. Grouped by consumption patterns, the income of catering industry was 1,473.7 billion yuan, up by 16.5 percent; and the retail sales of goods was 11,607.4 billion yuan, up by 17.0 percent. In particular, the retail sales of the enterprises (units) above designated size reached 5,560.7 billion yuan, a year-on-year growth of 24.3 percent. Specifically, the sales of motor vehicles rose by 16.0 percent, or 18.9 percentage points lower than that in the same period of last year; that of furniture grew up by 31.4 percent, or 7.0 percentage points lower; and that of household appliances and audio-video equipment went up by 20.5 percent, or 7.6 percentage points lower. In September, the total retail sales of consumer goods rose by 17.7 percent year-on-year (a real growth of 11.0 percent after deducting price factors), or 1.35 percent month-on-month.
5. Urban and Rural Residents’ Income Increased Steadily. In the first three quarters of this year, the per capita total income of urban households was 17,886 yuan. Specifically, the per capita disposable income of urban population was 16,301 yuan, the nominal year-on-year growth was
The external and internal environment for
Notes:
1. The growth rate of gross domestic product, value added of industrial enterprises above designated size and its sub-items are real growth by using comparable prices. The growth rates of other indicators are nominal growth by using current prices unless otherwise specified.
2. Approved by the State Council, the seasonally adjusted indicators of the following four will be released by the National Bureau of Statistics from April 2011: the quarterly gross domestic product (GDP), the month-on-month changes of value added of industrial enterprises above designated size, investment in fixed assets (excluding rural households), and total retails of consumer goods.
According to the auto-revision function of the seasonal adjustment model, GDP in the first quarter and the second quarter of 2011 and the month-on-month changes of the value added of industrial enterprises above designated size, investment in fixed assets (excluding rural households), and total retail sales of consumer goods from February to August have been revised. The revised figures and figures for September as well as GDP of the third quarter of 2011 are as follows: Month-on-Month Changes Value Added of Investment (%) Total Retail Sales of Consumer Goods (%) February 0.98 0.75 1.34 March 1.18 1.82 1.34 April 0.97 2.36 1.32 May 1.01 0.36 1.33 June 1.42 -0.84 1.36 July 0.91 1.04 1.31 August 1.02 1.45 1.30 September 1.20 -0.16 1.35
The quarter-on-quarter growth of GDP in the first, second and third quarter of 2011 was 2.0 percent, 2.4 percent and 2.3 percent respectively.
Industrial Enterprises
above Designated Size (%)
in Fixed Assets
3. Approved by the State Council, the National Bureau of Statistics raised the cut-off size of industrial and fixed assets investment statistics from January 2011. The cut-off size of industrial enterprises changed from an annual revenue from primary activities above 5 million yuan to 20 million yuan; and the cut-off size of fixed assets investment projects rose from a total planned investment above 500 thousand yuan to 5 million yuan. According to estimation, with the new coverage, the data collected on the total volume, structure and growth rates of industrial enterprises and investment in fixed assets showed a similar trend as compared with those under the former coverage.
4. From 2011, the National Bureau of Statistics improved the monthly statistical system of fixed assets investment, expanding the coverage of the monthly statistics from urban areas to rural enterprises and institutions, and defined it as the investment in fixed assets (excluding rural households). This makes the monthly data more complete and the definition more accurate.
5. From 2011, data on the retail sales of the enterprises (units) above designated size are released. The retail sales of the enterprises (units) above designated size refer to the wholesale enterprises (units) with the revenue from primary activities above 20 million yuan, the retail enterprises (units) with the revenue from primary activities above 5 million yuan, and the lodging and catering enterprises (units) with the revenue from primary activities above 2 million yuan.
|
Major indicators in the first half year of 2011 | ||||
|
Indicators |
September |
Jan-Sep | ||
|
Absolute Magnitude |
Increased YoY |
Absolute Magnitude |
Increased YoY | |
|
|
|
|
|
|
|
1. Gross Domestic Products(100 million yuan) |
… |
… |
320692 |
9.4 |
|
Primary Industry |
… |
… |
30340 |
3.8 |
|
Secondary Industry |
… |
… |
154795 |
10.8 |
|
Tertiary Industry |
… |
… |
135557 |
9.0 |
|
|
|
|
|
|
|
2. Agriculture |
|
|
|
|
|
Production of Summer Grain (10,000 tons) |
… |
… |
12627 |
2.5 |
|
Early Rice (10,000 tons) |
|
|
3276 |
4.5 |
|
Pork Beef Mutton and Poultry Meat(10,000 tons) |
… |
… |
5453 |
0.2 |
|
Pork(10,000 tons) |
… |
… |
3568 |
-0.6 |
|
|
|
|
|
|
|
3. Value-added of Industry Above Designated Size |
… |
13.8 |
… |
14.2 |
|
Grouped by Light & Heavy Industry |
|
|
|
|
|
Light Industry |
… |
12.8 |
… |
13.1 |
|
Heavy Industry |
… |
14.3 |
… |
14.6 |
|
Grouped by Status of Registration |
|
|
|
|
|
State Owned & State-holding Enterprises |
… |
9.9 |
… |
10.4 |
|
Collective-Owned Enterprises |
… |
7.2 |
… |
9.6 |
|
Joint-Stock Enterprises |
… |
16.0 |
… |
16.1 |
|
Enterprises with Funds from |
… |
10.1 |
… |
10.9 |
|
The Value-Added of the Main Industrial Sectors |
|
|
|
|
|
Manufacture of Textile |
… |
8.3 |
… |
7.5 |
|
Manufacture of Chemical Raw Material and Chemical Products |
… |
14.8 |
… |
15.0 |
|
Manufacture of Nonmetal Mineral Products |
… |
18.0 |
… |
18.9 |
|
Smelting and Pressing of Ferrous Metals |
… |
13.6 |
… |
10.0 |
|
Manufacture of General Purpose Machinery |
… |
14.7 |
… |
18.5 |
|
Manufacture of Transport Equipment |
… |
12.2 |
… |
12.1 |
|
Manufacture of Electrical Machinery & Equipment |
… |
13.3 |
… |
15.3 |
|
Manufacture of Telecommunications Equipment, Computers and Other Electronic Equipment |
… |
17.7 |
… |
16.1 |
|
Production and Supply of Electric Power and Heat Power |
… |
8.9 |
… |
10.4 |
|
Output of Major Products |
|
|
|
|
|
Generating Capacity (100 million kWh) |
3861 |
11.5 |
34540 |
12.7 |
|
Pig Iron (10,000 tons) |
5208 |
15.7 |
48552 |
10.4 |
|
Crude Steel (10,000 tons) |
5670 |
16.5 |
52574 |
10.7 |
|
Steel (10,000 tons) |
7636 |
18.8 |
66729 |
13.9 |
|
Cement (100 million tons) |
19031 |
15.7 |
151253 |
18.1 |
|
Crude Oil (10,000 tons) |
3610 |
1.5 |
33352 |
6.0 |
|
10 Kinds Of Nonferrous Metals (10,000 tons) |
300 |
13.9 |
2586 |
11.2 |
|
Ethylene (10,000 tons) |
106 |
-18.8 |
1140 |
10.1 |
|
Automobile (10,000 sets) |
166 |
2.5 |
1397 |
4.5 |
|
Of which: Autocars (10,000 sets) |
93 |
9.5 |
763 |
9.4 |
|
Sales Ratio (%) |
97.8 |
-0.3 |
97.9 |
0 |
|
Export Delivery Value (100 million yuan) |
9086 |
13.9 |
74492 |
18.4 |
|
|
|
|
|
|
|
4. Investment in Fixed Assets (Exclude Rural Households) (100 million yuan) |
… |
… |
212274 |
24.9 |
|
Of which: State-owned and State Holding |
… |
… |
73481 |
12.7 |
|
Grouped by Jurisdiction of Project Management |
|
|
|
|
|
Central Investment |
… |
… |
12445 |
-7.5 |
|
Local Investment |
… |
… |
199829 |
27.7 |
|
Grouped by Types of Industry |
|
|
|
|
|
Primary Industry |
… |
… |
4957 |
25.5 |
|
Secondary Industry |
… |
… |
92829 |
26.9 |
|
Tertiary Industry |
… |
… |
114488 |
23.4 |
|
Grouped by Industrial Sectors |
|
|
|
|
|
Extraction of Petroleum and Natural Gas |
… |
… |
1628 |
1.5 |
|
|
… |
… |
905 |
18.7 |
|
|
… |
… |
852 |
17.9 |
|
|
… |
… |
860 |
23.8 |
|
Manufacture of Non-metallic Mineral Products |
… |
… |
7472 |
28.2 |
|
Smelting and Pressing of Ferrous Metals |
… |
… |
2812 |
20.0 |
|
Smelting and Pressing of Non-Ferrous Metal |
… |
… |
2765 |
33.2 |
|
Manufacture of General Purpose Machinery |
… |
… |
5589 |
30.5 |
|
Manufacture of Transport Equipment |
… |
… |
6061 |
32.1 |
|
Manufacture of Electrical Machinery & Equipment |
… |
… |
5706 |
50.0 |
|
Manufacture of Telecommunications Equipment, Computers and Other Electronic Equipment |
… |
… |
3705 |
39.4 |
|
Production and Supply of Electric Power and Heat Power |
… |
… |
7925 |
3.4 |
|
Railway Transportation |
… |
… |
3521 |
-19.0 |
|
Road Transportation |
… |
… |
9531 |
11.6 |
|
Management on Water Resource |
… |
… |
2264 |
25.1 |
|
Management on Public Facilities |
… |
… |
13965 |
17.2 |
|
Grouped by Registration Type |
|
|
|
|
|
Domestic Funded |
… |
… |
197739 |
25.7 |
|
Funds from |
… |
… |
6666 |
22.3 |
|
Foreign Investment |
… |
… |
6890 |
15.7 |
|
Grouped by Construction and New Projects |
|
|
|
|
|
Total Investment in Construction Project |
… |
… |
557578 |
19.8 |
|
Total Planned Investment in New Projects |
… |
… |
180482 |
23.4 |
|
Funds in Place for Investment (Exclude Rural Households) |
… |
… |
243950 |
23.2 |
|
Government Budgetary Funds |
… |
… |
10221 |
12.8 |
|
Domestic Loans |
… |
… |
33638 |
7.8 |
|
Foreign Investment |
… |
… |
3791 |
13.8 |
|
Self-Raising Funds |
… |
… |
161373 |
29.3 |
|
Other Funds |
… |
… |
34927 |
17.8 |
|
The Gross Output Value of Construction in the Whole Country |
… |
… |
72466 |
25.8 |
|
The total area of housing construction in the Whole Country |
… |
… |
69.3 |
23.9 |
|
|
|
|
|
|
|
5. Investment in Real Estate Development |
|
|
|
|
|
Investment in Real Estate (100 million yuan) |
… |
… |
44225 |
|
|
Of which: Residential Buildings |
… |
… |
31788 |
32.0 |
|
Floor Space under Construction (10,000 sq.m) |
… |
… |
460786 |
35.2 |
|
Of which: Residential Buildings |
… |
… |
353099 |
29.7 |
|
Floor space of houses newly started (10,000 sq.m) |
… |
… |
147775 |
28.1 |
|
Of which: Residential Buildings |
… |
… |
114480 |
23.7 |
|
Floor Space of Buildings Completed (10,000 sq.m) |
… |
… |
43456 |
21.3 |
|
Of which: Residential Buildings |
… |
… |
34845 |
17.8 |
|
Floor Space of Commercial Buildings Sold (10,000 sq.m) |
… |
… |
71289 |
16.6 |
|
Of which: Residential Buildings |
… |
… |
63604 |
12.9 |
|
Office Buildings |
… |
… |
1326 |
12.1 |
|
Buildings for Commercial Business |
… |
… |
4624 |
17.0 |
|
Sales of Commercial Buildings (10,000 sq.m) |
… |
… |
39312 |
19.3 |
|
Of which: Residential Buildings |
… |
… |
32694 |
23.2 |
|
Office Buildings |
… |
… |
1781 |
21.2 |
|
Buildings for Commercial Business |
… |
… |
4071 |
35.1 |
|
Sources of Funds for Real Estate Development Enterprises (100 milliaon yuan) |
… |
… |
61947 |
33.8 |
|
Of which: Domestic Loans |
… |
… |
9749 |
22.7 |
|
Foreign Investment |
… |
… |
679 |
3.7 |
|
Self-raising Funds |
… |
… |
25535 |
50.1 |
|
Other Sources |
… |
… |
25985 |
33.5 |
|
Of Which: Deposits and advantage payments |
… |
… |
15761 |
20.7 |
|
Personal mortgage loans |
… |
… |
6186 |
29.3 |
|
|
|
|
|
|
|
6. TotalRetail Sales of Consumer Goods (100 million yuan) |
15865 |
17.7 |
130811 |
17.0 |
|
Of which: Retail Sales of the Enterprises (units) above Designated Size |
7550 |
24.7 |
60165 |
23.5 |
|
Grouped by Different Areas |
|
|
|
|
|
Cities |
13543 |
17.8 |
113265 |
17.1 |
|
At and Below |
2323 |
17.3 |
17546 |
16.4 |
|
Grouped by Consumption Patterns |
|
|
|
|
|
Catering Services |
1814 |
17.1 |
14737 |
16.5 |
|
Of which: Income of Catering Services of the Enterprises (units) above Designated Size |
574 |
19.7 |
4559 |
18.8 |
|
Retail Goods |
14051 |
17.8 |
116074 |
17.0 |
|
Of which: Income of Retail Goods of the Enterprises (units) above Designated Size |
6976 |
25.1 |
55607 |
24.3 |
|
Of Which: Grain, Oil, Foodstuff, Beverages, Tobacco, and Liquor |
945 |
24.4 |
7434 |
25.2 |
|
Garments, Footwear, Hats, Knitwear |
645 |
27.6 |
5450 |
24.8 |
|
Cosmetics |
96 |
19.5 |
793 |
19.5 |
|
Gold and Silver Jewelry |
152 |
38.5 |
1354 |
47.8 |
|
Commodities |
248 |
22.0 |
1990 |
24.7 |
|
Sports and Recreation Articles |
31 |
1.3 |
266 |
13.0 |
|
Household Appliances and AV Equipment |
445 |
19.5 |
3831 |
20.5 |
|
Traditional Chinese and Western Medicines |
346 |
18.0 |
2676 |
20.2 |
|
Cultural and Office Appliances |
164 |
35.3 |
1108 |
24.5 |
|
Furniture |
105 |
33.6 |
801 |
31.4 |
|
Communication Appliances |
96 |
24.8 |
766 |
27.8 |
|
Petroleum and Related Products |
1286 |
38.7 |
10570 |
39.3 |
|
Automobile |
1902 |
18.7 |
14823 |
16.0 |
|
Building and Decoration Materials |
130 |
26.5 |
923 |
17.0 |
|
|
|
|
|
|
|
7. CPI |
… |
6.1 |
… |
5.7 |
|
Of which: Urban |
… |
5.9 |
… |
5.5 |
|
Rural |
… |
6.6 |
… |
6.2 |
|
Of which: foodstuff |
… |
13.4 |
… |
12.5 |
|
Non-foodstuff |
… |
2.9 |
… |
2.8 |
|
Of which: Consumer Goods |
… |
7.3 |
… |
6.4 |
|
Services |
… |
3.0 |
… |
3.8 |
|
Grouped by Commodity Categories |
… |
|
… |
|
|
Foodstuff |
… |
13.4 |
… |
12.5 |
|
Tobacco, Liquor and its Articles |
… |
3.4 |
… |
2.5 |
|
Clothing |
… |
3.2 |
… |
1.6 |
|
Household Facilities, Articles and Maintenance Services |
… |
3.0 |
… |
2.2 |
|
Health Care and Personal Articles |
… |
4.1 |
… |
3.4 |
|
Transportation and Communication |
… |
1.0 |
… |
0.5 |
|
Recreational, Educational, Cultural Articles and Services |
… |
0.0 |
… |
0.5 |
|
Housing |
… |
5.1 |
… |
6.0 |
|
|
|
|
|
|
|
8. Producer Prices For Manufactured Goods |
… |
6.5 |
… |
7.0 |
|
Means of Production |
… |
7.1 |
… |
7.8 |
|
Mining and Quarrying |
… |
17.2 |
… |
16.7 |
|
Raw Materials |
… |
10.6 |
… |
10.7 |
|
Processing |
… |
4.6 |
… |
5.7 |
|
Means of Livelihood |
… |
4.6 |
… |
4.5 |
|
Foodstuff |
… |
8.2 |
… |
8.0 |
|
Clothing |
… |
4.5 |
… |
4.3 |
|
Articles for Daily Use |
… |
4.4 |
… |
4.4 |
|
Durable Consumer Goods |
… |
-0.6 |
… |
-0.6 |
|
|
|
|
|
|
|
9. Purchasing Price for Raw Materials, Fuels and Power Products |
… |
10.0 |
… |
10.4 |
|
Nonferrous Metal Materials and Wires |
… |
14.7 |
… |
15.1 |
|
Fuel and Power |
… |
12.3 |
… |
11.2 |
|
Ferrous Metals Materials |
… |
8.8 |
… |
11.3 |
|
Chemical Raw Materials |
… |
12.7 |
… |
12.3 |
|
|
|
|
|
|
|
10. Investment Price on Fixed Assets |
… |
7.3 |
… |
6.6 |
|
Construction and Installation |
… |
10.2 |
… |
9.3 |
|
Material Expense |
… |
9.7 |
… |
9.2 |
|
Labor Expense |
… |
14.8 |
… |
12.5 |
|
Machine-used Expense |
… |
5.4 |
… |
4.7 |
|
Equipment and Apparatus Purchasing Expense |
… |
1.2 |
… |
1.3 |
|
Other Expenses |
… |
4.4 |
… |
3.8 |
|
|
|
|
|
|
|
11. Produce Price on Agricultural Products |
… |
7.3 |
… |
18.3 |
|
Farming Products |
… |
10.2 |
… |
10.6 |
|
Grain |
… |
9.7 |
… |
9.9 |
|
Cereal |
… |
14.8 |
… |
10.2 |
|
Wheat |
… |
5.4 |
… |
5.2 |
|
Rice |
… |
1.2 |
… |
15.9 |
|
Corn |
… |
4.4 |
… |
10.6 |
|
Oil-bearing Crops |
|
|
… |
14.8 |
|
Sugar Crops |
… |
7.3 |
… |
32.2 |
|
Vegetables |
… |
10.2 |
… |
4.1 |
|
Fruits |
… |
9.7 |
… |
7.8 |
|
Tea |
… |
14.8 |
… |
14.0 |
|
Tobacco |
… |
5.4 |
… |
10.6 |
|
Forestry Products |
… |
1.2 |
… |
15.6 |
|
Timber |
… |
4.4 |
… |
8.7 |
|
Animal Husbandry Products |
… |
7.3 |
… |
27.7 |
|
Hogs |
… |
10.2 |
… |
39.3 |
|
Cattle and Buffaloes |
… |
9.7 |
… |
7.1 |
|
Sheep and Goats |
… |
14.8 |
… |
14.5 |
|
Poultry |
… |
5.4 |
… |
13.2 |
|
Poultry Eggs |
… |
1.2 |
… |
13.7 |
|
Fishery Products |
… |
4.4 |
… |
10.6 |
|
|
|
|
|
|
|
12. Income and Expenditure of Households ( yuan/ person) |
|
|
|
|
|
Per Capita Cash Income of Rural Households |
… |
… |
5875 |
13.6 |
|
Income from Wages and Salaries |
… |
… |
2161 |
21.9 |
|
Income from Household Operations |
… |
… |
3129 |
20.4 |
|
Of which: Income from the First Industry |
… |
… |
2313 |
18.6 |
|
Income from the Second and Tertiary Industry |
… |
… |
816 |
25.7 |
|
Income from Properties |
… |
… |
143 |
6.2 |
|
Income from Transfers |
… |
… |
442 |
22.0 |
|
Per Capita Consumption Living Expenditure of Rural Households |
… |
… |
3337 |
15.8 |
|
Per Capita Disposable Income of Urban Households |
… |
… |
16301 |
7.8 |
|
Per Capita Consumption Expenditure of Urban Households |
… |
… |
11195 |
6.7 |
|
|
|
|
|
|
|
Notes: 1. GDP, Value-added of Industry Above Designated Size and its growth rate were calculated at constant price. The growth rate of Per capita Cash Income of Rural Households, Per Capita Disposable Income of Urban Households, Per Capita Consumption Expenditure of Urban Households were real growth rate, other indicators of growth rate were calculated at current price. 2. Construction Enterprises refers to the general construction contractors and professional contractors (not including construction enterprises of worker subcontractors). 3.The Produce Price on Agricultural Products refers to price as agricultural producers directly sell their products. | ||||