Sales Prices of Residential Buildings in 70 Medium and Large-sized Cities in August
I. The Sales Prices of Newly Constructed Residential Buildings (excluding affordable housing)
Comparing with the previous month, among 70 medium and large-sized cities, the sales prices of newly constructed residential buildings declined in 16 cities while that of 30 cities remained general level. The chain index decreased and remained the general level rose by 15 cities in August as compared with previous month. The month-on-month growth rate within 0.4 percent in the cities with increasing price, while that of 8 cities dipped.
In August, the year-on-year increase rate of sales prices of newly constructed residential buildings dropped in 40 cities, increased 14 cities over July. The year-on-year growth rates of 45 cities were within 5.0 percent.
II. Sales Prices of Second-Hand Residential Buildings
Comparing with the previous month, the sales prices of second-hand residential buildings decreased in 26 cities, while that of 17 cities remained general level. The chain index decreased and remained the general level rose by 9 cities in August as compared with previous month. The growth rates of chain index were within 0.7 percent in the cities with increasing price, while that of 25 cities were less than 0.5 percent.
Comparing with the same month last year, the sales prices of second-hand residential buildings decreased in 5 cities. The growth rates of 34 cities dropped, increased 6 cities over July. In August, the growth rates of 49 cities were within 5.0 percent, year-on-year.
Sales Price Indices of Residential Buildings in 70 Medium- and Large-sized Cities in August
Explanatory Notes:
1. Since January 2011, NBS started to implement “Survey Program on Sales Prices of Residential Buildings”. Because considerable adjustments were made in the new Program concerning with on data sources, indicator selecting, calculation methods and other factors that may have an impact on the calculation of price index, So the data from January to November this year is not comparable with historical data.
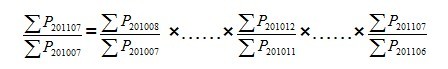
2. The calculation of year-on-year index. Due to the transaction records started to report since December 2010, the year-on-year data under the same scope can not be calculated. In order to sustain the continuity and stability for the calculation on the year-on-year data, NBS adopts technical methods on the calculation of year-on-year data, based on the concerning statistical data on housing price in 2010 and transaction records in 2011, according to the mathematics relations between year-on-year and month-on-month. The formula is:
P201008-P201012 stands for price in August to December in 2010. P201101-P201108 stands for price in January to August, 2011.
3. In August 2011, the data of newly constructed residential buildings in 65 cities started to be calculated based on transaction records data. That of the other 5 cities were calculated according to the floor spaces sold and sales values in each item in the real estate development reports. The 65 transaction records collected cities are: Beijing, Tianjin, Shijiazhuang, Taiyuan, Hohhot, Shenyang, Dalian, Changchun, Harbin, Shanghai, Nanjing, Hangzhou, Ningbo, Hefei, Fuzhou, Xiamen, Nanchang, Jinan, Qingdao, Zhengzhou, Wuhan, Changsha, Guangzhou, Shenzhen, Nanning, Haikou, Chongqing, Chengdu, Guiyang, Kunming, Xi’an, Lanzhou, Xining, Yinchuan, Urumqi, Qinhuangdao, Baotou, Dandong, Jilin, Mudanjiang, Wuxi, Yangzhou, Xuzhou, Wenzhou, Jinhua, Bengbu, Anqing, Quanzhou, Jiujiang, Yantai, Jining, Luoyang, Pingdingshan, Yichang, Xiangyang, Yueyang, Changde, Huizhou, Zhanjiang, Shaoguan, Guilin, Beihai, Sanya, Luzhou, and Nanchong.
4. The newly constructed residential buildings including affordable housing, the newly constructed commercial residential buildings excluding affordable housing.
5. “-” in table denotes no deal record this month.