Sales Price of Residential Buildings in 70 Large and Medium-Sized Cities in March
I The Sales Price of Newly Constructed Residential Buildings
The sales price of newly constructed residential buildings in 70 large and medium-sized cities decreased in 12 cities and that of remained the same level in 8 cities comparing with the previous month.
Comparing with last month, the number of cities with sales price decreased and remained the same level added 6, while the number of cities with growth rate narrowed was 29.
Comparing with the same month of last year, the sales price of 2 cities declined, 1 city more than the previous month. The number of cities with sales price decreased amounted to 46, 16 cities more than the previous month. In March, the growth rate of sales price in 26 cities exceeded 5.0 percent, 2 cities more than that was in February.
II Sales Price of Second-Handed Residential Buildings
Comparing with last month, the sales price of second-handed residential buildings in 16 cities and that of 10 cities remained the same level.
Comparing with last month, the number of cities with sales price remained the same level or decreased added 6. The growth rate of sales price in 3 cities exceeded 1.0 percent, reduced 2 cities than that in February.
Comparing with the same month of last year, the sales price in 5 city declined, while that of the growth rate in 45 cities went down in 70 large and medium-sized cities, 23 cities more than in the previous month. In March, the growth rate in 41cities within 5 percent, 1 city more than in February,
Note:
1.Since January 2011, NBS started to implement “Survey Program on Sales Price of
2. The calculation of year-on-year index. NBS will compile figures based on transactions records from city-level housing departments. Due to the transaction records started to report since December 2010, the year-on-year data under the same scope can not be calculated. In order to sustain the continuity and stability for the calculation on the y-o-y data, NBS adopts technical methods on the calculation of y-o-y data, based on the concerning statistical data on housing price in 2010 and transaction records in 2011, according to the mathematics relations between y-o-y and chain index. The formula are as followings:
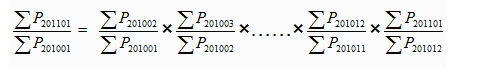
P201002……P201012 stands for price in Feb. to Dec. in 2010. P201101、P201102 stands for price in Jan. and Feb. 2011.
3.Since February 2011, the data of newly constructed residential buildings in 54 cities started to be calculated based on transaction records data. That of the other 16 cities were calculated according to the floor spaces sold and sales values in each items in the real estate development reports. The 54 transaction records collected cities are: Beijing, Tianjin, Shijiazhuang, Taiyuan, Hohhot, Shenyang, Dalian, Changchun, Harbin, Shanghai, Nanjing, Hangzhou, Ningbo, Hefei, Fuzhou, Xiamen, Nanchang, Jinan, Qingdao, Zhengzhou, Wuhan, Changsha, Guangzhou, Shenzhen, Nanning, Haikou, Chongqing, Chengdu, Guiyang, Kunming, Xi’an, Lanzhou, Xining, Yinchuan, Urumqi, Qinhuangdao, Baotou, Jilin, Mudanjiang, Wuxi, Yangzhou, Xuzhou, Quanzhou, Jiujiang, Luoyang, Pingdingshan, Huizhou, Zhanjiang, Shaoguan, Guilin, Beihai, Sanya, Luzhou and Nanchong. Luzhou is the new added one.
4.Eastern Region includes 7 provinces and 28 cities, they are:
Central Region includes 6 provinces and 16 cities, they are:
Western Region includes 10 provinces (autonomous regions) and 18 cities, they are:
Northeast Region includes 3 provinces and 8 cities, they are:
5. —— in table stands for no deal record this month.