Statistical Communiqué on the 2006 National Economic and Social Development
STATISTICAL COMMUNIQUÉ OF
THE PEOPLE'S REPUBLIC OF
ON THE 2006 NATIONAL
ECONOMIC AND SOCIAL DEVELOPMENT
National Bureau of Statistics of
February 28, 2007
In 2006, under the leadership of the CPC Central Committee and the State Council, the people of all nationalities of China, taking as the guidance of Deng Xiaoping Theory and the important thought of “Three Represents”, adhered to the scientific approach to the economic and social development, endeavored to build a socialist harmonious society, carefully carried out various measures set by the central government aiming at enhancing and improving macro-control and made remarkable achievements in the national economic and social development. The major problems existing in the economic and social development are the extensive mode of economic growth and outstanding relationship within the economic structure.
I. General Outlook
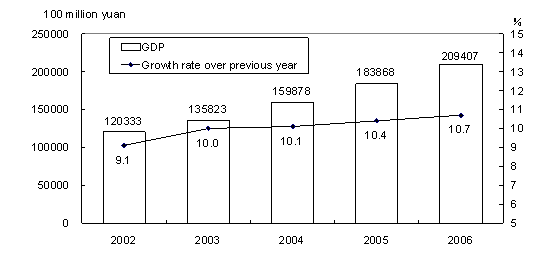
In 2006, the gross domestic product (GDP) of the year was 20,940.7 billion yuan, up by 10.7 percent over the previous year. The value added of the primary industry was 2,470.0 billion yuan, up by 5.0 percent. The value added of the secondary industry was 10,200.4 billion yuan, up by 12.5 percent. The value added of the tertiary industry was 8,270.3 billion yuan, up by 10.3 percent. The value added of the primary industry, secondary industry and the tertiary industry contributed 11.8 percent, 48.7 percent and 39.5 percent respectively to the GDP.
Figure 1: Gross Domestic Product and Its Growth, 2002-2006
The general level of consumer prices in
Table 1: Change in Consumer Prices in 2006 over 2005
|
Unit: % | |||
|
Item |
National Average |
| |
|
Urban |
Rural | ||
|
General level of consumer prices |
1.5 |
1.5 |
1.5 |
|
Food |
2.3 |
2.5 |
2.1 |
|
Grain |
2.7 |
2.7 |
2.9 |
|
Tobaccos and alcohols |
0.6 |
0.8 |
0.3 |
|
Clothing |
-0.6 |
-0.6 |
-0.4 |
|
Household appliances and services |
1.2 |
1.3 |
1.0 |
|
Medical, health and personal articles |
1.1 |
0.9 |
1.5 |
|
Transportation and telecommunications |
-0.1 |
-0.7 |
1.3 |
|
Recreational, educational, cultural articles and services |
-0.5 |
0.0 |
-1.4 |
|
Housing |
4.6 |
4.7 |
4.6 |
At the end of 2006, the total of employed people in
At the end of 2006,
The various taxes collected in the whole year reached 3,763.6 billion yuan (excluding tariffs, farm land taxes and deed taxes), up by 21.9 percent or an increase of 677.0 billion yuan over 2005.
II. Agriculture
In 2006, the sown area of grain was 105.38 million hectares, an increase of 1.10 million hectares as compared with that in the previous year; the sown area of cotton was 5.40 million hectares, an increase of 340 thousand hectares; the sown area of oil-bearing crops was 13.80 million hectares, a decline of 520 thousand hectares; the sown area of sugar crops was 1.78 million hectares, an increase of 220 thousand hectares; and that for vegetables stood at 18.18 million hectares, an increase of 460 thousand hectares.
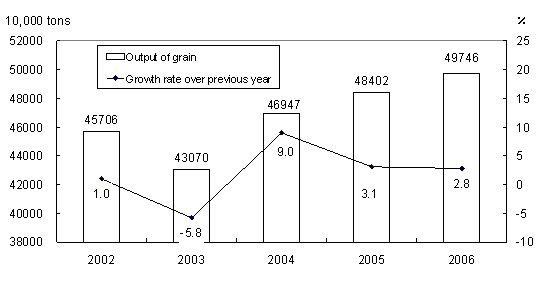
The total output of grain in 2006 was 497.46 million tons, up by 13.44 million tons or by 2.8 percent over the previous year; that of cotton was 6.73 million tons, a growth of 17.8 percent; that of oil-bearing crops was 30.62 million tons, down by 0.5 percent and that of sugar crops was 109.87 million tons, an increase of 16.2 percent.
Table 2: Output of Major Farm Products and the Growth Rates in 2006
Unit: 10,000 tons
|
Item |
Output |
Increase over 2005 (%) |
|
Grain |
49746 |
2.8 |
|
Summer crops |
11381 |
7.0 |
|
Early rice |
3187 |
0.0 |
|
Autumn crops |
35178 |
1.7 |
|
Oil-bearing crops |
3062 |
-0.5 |
|
Peanuts |
1461 |
1.8 |
|
Rapeseed |
1270 |
-2.7 |
|
Cotton |
673 |
17.8 |
|
Sugar crops |
10987 |
16.2 |
|
Sugarcane |
9925 |
14.6 |
|
Beetroot |
1062 |
34.8 |
|
Cured tobacco |
247 |
1.3 |
|
Tea |
102 |
9.0 |
|
Fruits |
17050 |
5.8 |
|
Vegetables |
58233 |
3.2 |
Figure 2: Output of Grain and Its Growth, 2002-2006
The total output of meat for the year reached 81.00 million tons, up by 4.6 percent. Of this total, the output of pork, beef and mutton was up 4.3 percent, 5.3 percent and 7.8 percent respectively. The total output of aquatic products was 52.50 million tons, up by 2.8 percent. The total production of timber for the year 2006 reached 78.00 million cubic meters, an increase of 40.3 percent over the previous year.
Over 1.08 million hectares of farmland was increased with effective irrigation systems and another additional 1.28 million hectares of farmland was guaranteed by water-saving irrigation systems.
III. Industry and Construction
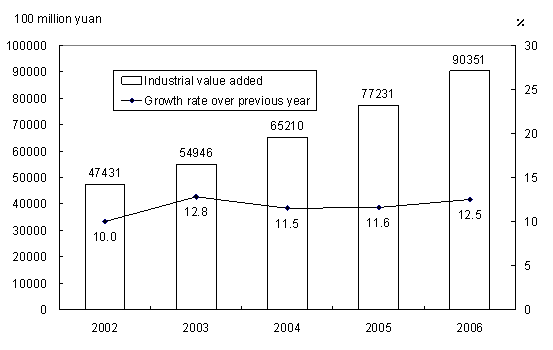
In 2006, the total value added of the industrial sector was 9,035.1 billion yuan, up by 12.5 percent over the previous year. The value added of industrial enterprises above the designated size was up by 16.6 percent and their sales ratio was 98.1 percent.
Table 3: Value Added of Industrial Enterprises above Designated Size and the Growth Rates in 2006
Unit: 100 million yuan
|
Item |
Value added |
Increase over 2005 (%) |
|
Value added |
79752 |
16.6 |
|
Of which: State-owned and state-holding enterprises |
28396 |
12.6 |
|
Of which: Collective enterprises |
2558 |
11.6 |
|
Share-holding enterprises |
39918 |
17.8 |
|
Enterprises by foreign investors and investors from |
22502 |
16.9 |
|
Of which: Private enterprises |
15547 |
24.4 |
|
Of which: Light industry |
24314 |
13.8 |
|
Heavy industry |
55438 |
17.9 |
Figure 3: Industrial Value Added and Its Growth, 2002-2006
In 2006, the total output of primary energy reached 2.21 billion tons of standard coal equivalents, up by 7.3 percent over the previous year. The electricity generated in the whole year was 2,834.4 billion kilowatt-hours, up by 13.4 percent. The output of coal was 2.38 billion tons, up by 8.0 percent. The output of crude oil reached 184 million tons, up by 1.7 percent.
In 2006, the output of crude steel stood at 420 million tons, up by 19.7 percent; that of rolled steel was 470 million tons, up by 25.3 percent, that of cement was 1.24 billion tons, up by 15.5 percent; the production of 10 kinds of nonferrous metals went up by 17.2 percent; and the growth of the output of major chemical products including sulfuric acid, soda ash, caustic soda and ethylene ranged from 9.6 percent to 24.5 percent.
In 2006, the production of motor vehicles reached 7.28 million, an increase of 27.6 percent. Of this total, the production of cars reached 3.87 million, up by 39.7 percent.
The output of high-tech products such as mobile telephones and microcomputers rose by a range of 58.2 percent to 15.5 percent. Of the industrial enterprises above the designated size, the value added of high-tech industry in 2006 went up by 18.7 percent over the previous year.
Table 4: Output of Major Industrial Products and the Growth Rates in 2006
|
Product |
Unit |
Output |
Increase over 2005 (%) |
|
Yarn |
10000 tons |
1740.0 |
20.0 |
|
Cloth |
100 million meters |
550.0 |
13.5 |
|
Chemical fibers |
10000 tons |
2025.5 |
21.7 |
|
Sugar (final product) |
10000 tons |
949.1 |
4.0 |
|
Cigarettes |
100 million |
20218.1 |
4.3 |
|
Color TV sets |
10000 |
8375.4 |
1.1 |
|
Household refrigerators |
10000 |
3530.9 |
18.2 |
|
Room air conditioners |
10000 |
6849.4 |
1.3 |
|
Total primary energy production |
100 million tons of standard coal equivalent |
22.1 |
7.3 |
|
Coal |
100 million tons |
23.8 |
8.0 |
|
Crude oil |
100 million tons |
1.84 |
1.7 |
|
Natural gas |
100 million cubic meters |
585.5 |
18.7 |
|
Electricity |
100 million kilowatt-hours |
28344.0 |
13.4 |
|
Of which: Thermal-power |
100 million kilowatt-hours |
23573.0 |
15.1 |
|
Hydro-power |
100 million kilowatt-hours |
4167.0 |
5.0 |
|
Crude steel |
10000 tons |
42266.0 |
19.7 |
|
Rolled steel |
10000 tons |
47339.6 |
25.3 |
|
Ten kinds of nonferrous metals |
10000 tons |
1917.0 |
17.2 |
|
Of which: Refined copper (copper) |
10000 tons |
299.8 |
15.0 |
|
Aluminum electrolyze |
10000 tons |
935.0 |
20.1 |
|
Aluminum oxide |
10000 tons |
1370.0 |
59.4 |
|
Cement |
100 million tons |
12.4 |
15.5 |
|
Sulfuric acid |
10000 tons |
4981.0 |
9.6 |
|
Soda ash |
10000 tons |
1597.2 |
12.4 |
|
Caustic soda |
10000 tons |
1511.8 |
21.9 |
|
Ethylene |
10000 tons |
940.5 |
24.5 |
|
Chemical fertilizers (100 percent equivalent) |
10000 tons |
5592.8 |
8.0 |
|
Power-generating equipment |
10000 kilowatts |
11000.0 |
19.6 |
|
Motor vehicles |
10000 |
727.9 |
27.6 |
|
Of which: Cars |
10000 |
386.9 |
39.7 |
|
Large & medium tractors |
10000 |
19.9 |
22.0 |
|
Integrated circuits |
100 million pieces |
335.8 |
24.4 |
|
Program-controlled switchboards |
10000 lines |
7404.6 |
-4.1 |
|
Mobile telephones |
10000 |
48013.8 |
58.2 |
|
Micro-computers |
10000 |
9336.4 |
15.5 |
The profits made by the industrial enterprises above the designated size were 1,878.4 billion yuan, an increase of 31 percent over the previous year.
Table 5: Profits and Growth of Industrial Enterprises above the Designated Size in 2006
Unit: 100 million yuan
|
Item |
Total Profits |
Increase over 2005 (%) |
|
Industrial enterprises above designated size |
18784 |
31.0 |
|
Of which: State-owned and state-holding enterprises |
8072 |
27.0 |
|
Of which: Collective enterprises |
561 |
29.5 |
|
Share-holding enterprises |
10073 |
32.3 |
|
Enterprises by foreign investors or investors from and |
5162 |
26.7 |
|
Of which: Private enterprises |
2948 |
43.6 |
In 2006, the value added of construction enterprises in
IV. Investment in Fixed Assets
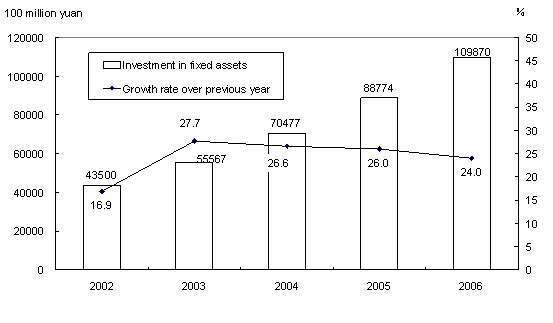
The completed investment in fixed assets of the country in 2006 was 10,987.0 billion yuan, up by 24 percent over the previous year. Of the total investment, that in urban areas was 9,347.2 billon yuan, up by 24.5 percent; and that in rural areas reached 1,639.7 billion yuan, up by 21.3 percent.
Figure 4: Investment in Fixed Assets and Its Growth, 2002-2006
In the urban areas, the investment by state-owned and state-holding enterprises was 4,521.2 billion yuan, up by 16.9 percent over the previous year. The investment in the primary industry was 110.2 billion yuan, up by 30.7 percent; that in the secondary industry was 3,976.0 billion yuan, up by 25.9 percent; and that in the tertiary industry was 5,261.1 billion yuan, up by 23.3 percent.
Table 6: Fixed Assets Investment in Urban Areas and Its Growth Rates by Sector in 2006
Unit: 100 million yuan
|
Sector |
Investment |
Increase over 2005 (%) |
|
Total |
93472 |
24.5 |
|
Agriculture, Forestry, Animal Husbandry and Fishing |
1102 |
30.7 |
|
Mining |
4168 |
28.9 |
|
Manufacturing |
26399 |
29.4 |
|
Of Which: Manufacture of Raw Chemical Materials and Chemical Products |
2556 |
19.9 |
|
Manufacture of Non-Metallic Mineral Products |
1854 |
33.0 |
|
Smelting and Pressing of Ferrous Metals |
2247 |
-2.5 |
|
Manufacture of Transport Equipment |
1974 |
25.2 |
|
Manufacture of Communication Equipment, Computers and Other Electronic Equipment |
1687 |
38.7 |
|
Production and Supply of Electricity, Gas and Water |
8196 |
12.5 |
|
Construction |
997 |
50.1 |
|
Transport, Storage and Post |
11140 |
25.7 |
|
Information, Transmission, Computer Services and Software |
1786 |
14.4 |
|
Wholesale and Retail Trade |
1885 |
23.0 |
|
Lodging and Catering Services |
929 |
37.4 |
|
Banking |
118 |
11.7 |
|
Real Estate |
21446 |
25.4 |
|
Leasing and Business Services |
666 |
37.0 |
|
Scientific Research, Technical Service and Geologic Prospecting |
465 |
9.5 |
|
Management of Water Conservancy, Environment and Public Facilities |
7453 |
22.2 |
|
Services to Households and Other Services |
182 |
34.5 |
|
Education |
2114 |
7.5 |
|
Health, Social Security and Social Welfare |
693 |
17.0 |
|
Culture, Sports and Entertainment |
850 |
23.9 |
|
Public Management and Social Organization |
2885 |
18.3 |
In 2006, the investment in real estate development was 1,938.2 billion yuan, up by 21.8 percent. Of this total, the investment in commercial buildings reached 1,361.2 billion yuan, an increase of 25.3 percent. The completed floor space of commercial buildings reached 530.19 million square meters, down by 0.6 percent. The total sales of commercial buildings reached 2,051.0 billion yuan. Of this total, the sales of the forward delivery housing was 1,436.6 billion yuan, accounting for 70.0 percent.
Table 7: Newly Increased Production Capacity through Fixed Assets Investment
|
Item |
Unit |
Volume |
|
Newly increased power generating capacity |
10,000 kilowatts |
10117 |
|
Power transformer equipment with a capacity of over 220 kilovolts |
10,000 kilovolt-amperes |
15531 |
|
New railways put into operation |
Kilometer |
1605 |
|
Double-track railways put into operation |
Kilometer |
705 |
|
Electrified railways put into operation |
Kilometer |
3960 |
|
New highways |
Kilometer |
93720 |
|
Of which: Expressways |
Kilometer |
4325 |
|
New cargo-handling capacity of berths for over 10000-tonnage ships |
10,000 tons |
45726 |
|
New capacity of telephone switchboards |
10,000 lines |
3067 |
|
New lines of optical-fiber cables |
|
19 |
|
New capacity of digital cellular mobile phone switchboards |
10,000 subscribers |
12818 |
Qinghai-Tibet railway was fully put into operation on July 1, 2006. A total amount of 11.9 billion yuan worth of investment was completed for the first phase of the eastern and central routes of South-to-North Water Diversion Project. The total completed investment in the Three Gorges Project stood at 131.3 billion yuan. The power generators, which were currently in operation, had produced 49.2 billion kilowatt-hours of electricity in 2006, with an accumulated electricity generation of 146.1 billion kilowatt-hours since the very beginning.
V. Domestic Trade
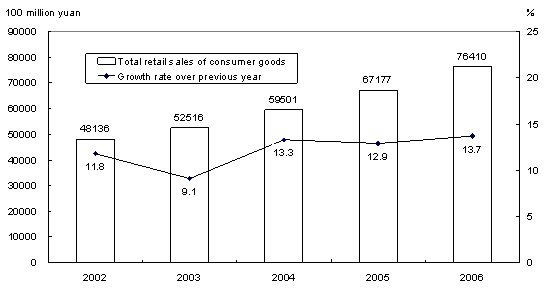
In 2006, the total retail sales of consumer goods reached 7,641.0 billion yuan, up by 13.7 percent over the previous year. In terms of different areas, the retail sales of consumer goods in cities reached 5,154.3 billion yuan, up by 14.3 percent and the retail sales of consumer goods at and below county level was 2,486.7 billion yuan, up by 12.6 percent. In terms of different sectors, the sales of the wholesale and retail industry reached 6,432.6 billion yuan, up 13.7 percent; the sales of the lodging and catering industry was 1,034.5 billion yuan, up 16.4 percent, and the sales of the other industries was 173.9 billion yuan, up 2.3 percent.
Of the total retail sales by wholesale and retail enterprises above designated size, the sales of motor vehicles was up by 26.3 percent, petroleum and related products up by 36.2 percent, cultural and office goods up by 14.5 percent, telecommunication equipment up by 22.0 percent, electric and electronic appliances for household use and audio-video equipment up by 19.2 percent, building and decoration materials up by 24.0 percent, daily necessities up by 15.7 percent, furniture up 21.3 percent, food, beverages, tobacco and liquor up by 15.5 percent, clothing up by 19.2 percent, cosmetics up by 18.6 percent, and gold, silver and jewelry up by 28.5 percent.
Figure 5: Total Retail Sales of Consumer Goods and Its Growth, 2002-2006
VI. Foreign Economic Relations
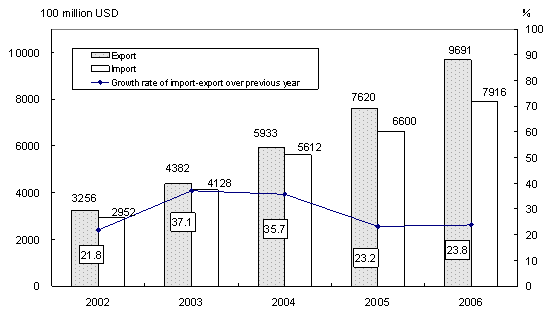
The total value of imports and exports in 2006 reached 1,760.7 billion US dollars, up 23.8 percent over the previous year. Of this total, the value of exports was 969.1 billion US dollars, up 27.2 percent, and the value of imports was 791.6 billion US dollars, up 20.0 percent.
Table 8: Total Value of Imports and Exports and the Growth Rates in 2006
Unit: 100 million USD
|
Item |
Value |
Increase over 2005 (%) |
|
Total imports and exports |
17607 |
23.8 |
|
Exports |
9691 |
27.2 |
|
Of which: General trade |
4163 |
32.1 |
|
Processing trade |
5104 |
22.5 |
|
Of which: Mechanical and electronic products |
5494 |
28.8 |
|
High & new-tech products |
2815 |
29.0 |
|
Of which: State-owned |
1913 |
13.4 |
|
Foreign-funded |
5638 |
26.9 |
|
Others |
2139 |
43.6 |
|
Imports |
7916 |
20.0 |
|
Of which: General trade |
3332 |
19.1 |
|
Processing trade |
3215 |
17.3 |
|
Of which: Mechanical and electronic products |
4277 |
22.1 |
|
High & new-tech products |
2473 |
25.1 |
|
Of which: State-owned |
2252 |
14.2 |
|
Foreign-funded |
4726 |
22.0 |
|
Others |
938 |
24.4 |
|
Trade surplus |
1775 |
|
|
Of which: General trade |
831 |
|
|
Processing trade |
1889 |
|
|
Other trade |
-945 |
|
Table 9: Imports and Exports by Major Countries and Regions and the Growth Rates in 2006
Unit: 100 million USD
|
Country or region |
Exports |
Increase over 2005 (%) |
Imports |
Increase over 2005 (%) |
|
|
2035 |
24.9 |
592 |
21.8 |
|
European Union |
1820 |
26.6 |
903 |
22.7 |
|
|
1554 |
24.8 |
108 |
-11.8 |
|
|
916 |
9.1 |
1157 |
15.2 |
|
ASEAN |
713 |
28.8 |
895 |
19.4 |
|
|
445 |
26.8 |
898 |
16.9 |
|
|
207 |
25.3 |
871 |
16.6 |
|
|
158 |
19.8 |
176 |
10.5 |
Figure 6: Imports and Exports and the Growth Rates, 2002-2006
The year 2006 witnessed the establishment of 41,485 enterprises with foreign direct investment, down by 5.8 percent; and the foreign capital actually utilized was 69.47billion
Table 10: Foreign Direct Investment by Sectors in 2006
Value in 100 million USD
|
Sectors |
Contracted Projects |
Increase over 2005 (%) |
Actually Utilized Value |
Increase over 2005 (%) |
|
Total |
41485 |
-5.8 |
694.7 |
-4.1 |
|
Farming, Forestry, Animal Husbandry and Fishery |
951 |
-10.1 |
6.0 |
-16.5 |
|
Mining and Quarrying |
208 |
-17.5 |
4.6 |
29.7 |
|
Manufacturing |
24790 |
-14.3 |
400.8 |
-5.6 |
|
Production and Supply of Electricity, Gas and Water |
375 |
-3.9 |
12.8 |
-8.1 |
|
Construction |
352 |
-23.0 |
6.9 |
40.4 |
|
Transport, Storage, Post and Telecommunication Services |
665 |
-9.4 |
19.8 |
9.5 |
|
Information Transmission, Computer Services and Software |
1378 |
-7.7 |
10.7 |
5.5 |
|
Wholesales & Retail Trade |
4664 |
79.3 |
17.9 |
72.3 |
|
Lodging & Catering Services |
1060 |
-12.2 |
8.3 |
47.8 |
|
Financial Intermediation |
64 |
10.3 |
67.4 |
-45.2 |
|
Real Estate Development |
2398 |
13.1 |
82.3 |
51.9 |
|
Leasing and Business Services |
2885 |
-3.2 |
42.2 |
12.8 |
|
Scientific Research, Technical Services and Geological Prospecting |
1035 |
11.8 |
5.0 |
48.1 |
|
Water Conservancy, Environment Protection and Public Facilities Management |
132 |
-5.0 |
2.0 |
40.4 |
|
Services to Households and Other Services |
236 |
-28.3 |
5.0 |
93.9 |
|
Education |
27 |
-47.1 |
0.3 |
65.6 |
|
Health, Social Security and Social Welfare |
20 |
-9.1 |
0.2 |
-61.4 |
|
Culture, Sports and Recreation |
241 |
-11.4 |
2.4 |
-21.0 |
|
Public Management and Social Organization |
4 |
|
0.07 |
91.1 |
In 2006, the overseas direct investment (non-financial investment) by Chinese investors was 16.1 billion US dollars, up by 31.6 percent over the previous year.
In 2006, the accomplished business revenue through contracted overseas engineering projects was 30.0 billion US dollars, up by 37.9 percent, and the business revenue through overseas labor contracts was 5.4 billion US dollars, up by 12.3 percent.
VII. Transportation, Post, Telecommunications and Tourism
The value added of the transportation, storage, post and telecommunication sectors reached 1,203.2 billion yuan in 2006, up 8.3 percent over the previous year.
Table 11: Freight Traffic by All Means of Transportation and the Growth Rates in 2006
|
Item |
Unit |
Volume |
Increase over 2005 (%) |
|
Total freight traffic |
100 million tons |
202.5 |
8.9 |
|
Railways |
100 million tons |
28.8 |
7.1 |
|
Highways |
100 million tons |
146.1 |
8.9 |
|
Waterways |
100 million tons |
24.4 |
11.0 |
|
Civil aviation |
10 000 tons |
349.4 |
13.9 |
|
Pipelines |
100 million tons |
3.2 |
6.7 |
|
Freight turnover |
100 million ton-kilometers |
86921.2 |
8.4 |
|
Railways |
100 million ton-kilometers |
21954.0 |
5.9 |
|
Highways |
100 million ton-kilometers |
9647.0 |
11.0 |
|
Waterways |
100 million ton-kilometers |
53907.8 |
8.5 |
|
Civil aviation |
100 million ton-kilometers |
94.3 |
19.5 |
|
Pipelines |
100 million ton-kilometers |
1318.2 |
29.5 |
Table 12: Passenger Traffic by All Means of Transportation and the Growth Rates in 2006
|
Item |
Unit |
Volume |
Increase over 2005 (%) |
|
Total passenger traffic |
100 million persons |
200.8 |
8.7 |
|
Railways |
100 million persons |
12.6 |
8.7 |
|
Highways |
100 million persons |
184.5 |
8.7 |
|
Waterways |
100 million persons |
2.2 |
6.3 |
|
Civil aviation |
10 000 persons |
15961.3 |
15.4 |
|
Passenger flows |
100 million person-kilometers |
19202.7 |
9.9 |
|
Railways |
100 million person-kilometers |
6622.0 |
9.2 |
|
Highways |
100 million person-kilometers |
10135.9 |
9.1 |
|
Waterways |
100 million person-kilometers |
74.9 |
10.5 |
|
Civil aviation |
100 million person-kilometers |
2369.9 |
15.9 |
The volume of freight handled by ports above the designated size throughout the country totaled 4.56 billion tons, up 15.6 percent over the previous year, of which, freight for foreign trade was 1.57 billion tons, up 16.8 percent. Container shipping handled 93.00 million standard containers, up by 23.0 percent.
The total number of motor vehicles for civilian use reached 49.85 million (including 13.99 million tri-wheel motor vehicles and low-speed trucks) by the end of 2006, up 15.2 percent, of which, private-owned vehicles numbered 29.25 million, up 23.7 percent. The total number of cars for civilian use stood at 15.45 million, up by 27.2 percent, of which, private-owned cars numbered 11.49 million, up by 33.5 percent.
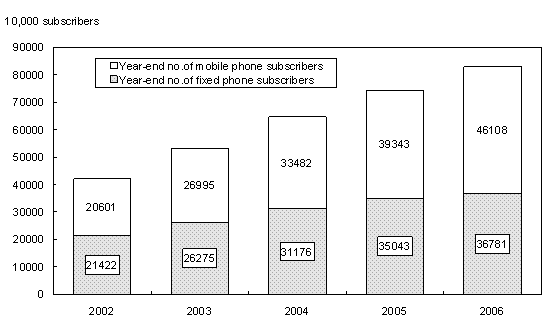
The turnover of post and telecommunication services totaled 1,532.1 billion yuan, up 25.6 percent over the previous year. Of this total, post services accounted for 72.9 billion yuan, up 16.9 percent, and telecommunication services 1,459.2 billion yuan, up 26.1 percent. By the end of 2006, with 30.67 million newly installed lines of office switchboards, the total capacity reached 500 million lines. The year also saw 17.37 million new fixed telephone subscribers to bring the total number to 367.81 million by the end of the year. This included 251.39 million urban subscribers and 116.42 million rural subscribers. Mobile phone users numbered 461.08 million by the end of 2006, with 67.68 million new subscribers in the year. In total, the number of fixed and mobile phone users reached 828.89 million, an increase of 85.05 million as compared with at the end of 2005. On average, phone coverage is 63 sets per 100 Chinese populations.
Figure 7: Number of Phone Subscribers, 2002-2006
In 2006, the number of inbound visitors to
VIII. Banking, Securities and Insurance
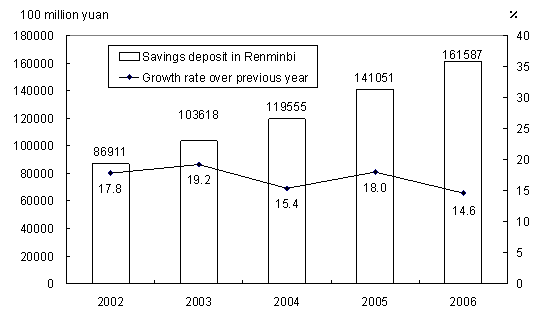
By the end of 2006, money supply of broad sense (M2) was 34.6 trillion yuan, reflecting a year-on-year increase of 16.9 percent. Money supply of narrow sense (M1) was 12.6 trillion yuan, up 17.5 percent. Cash in circulation (M0) was 2.7 trillion yuan, up 12.7 percent. Savings deposit in Renminbi and foreign currencies in all items in financial institutions totaled 34.8 trillion yuan at the end of 2006, up 16.0 percent. Loans in Renminbi and foreign currencies in all items in financial institutions reached 23.9 trillion yuan, up 14.7 percent.
Table 13: Savings Deposit and Loans in RMB and Foreign Currencies in All Financial Institutions and the Growth Rates in 2006
Unit: 100 million yuan
|
Item |
Year-end figure |
Increase over 2005 (%) |
|
Savings deposit |
348065 |
16.0 |
|
Of which: By enterprises |
118881 |
16.8 |
|
By urban and rural households |
166617 |
13.3 |
|
Of which: Deposits in RMB |
161587 |
14.6 |
|
Loans |
238519 |
14.7 |
|
Of which: Short-term |
101762 |
10.9 |
|
Medium and long-term |
113173 |
21.3 |
Loans in Renminbi from rural financial cooperation institutions (i.e. rural credit cooperatives, rural cooperation banks, and rural commercial banks) totaled 2.6 trillion yuan by the end of 2006, an increase of 427.7 billion yuan as compared with the end of 2005. The loans in Renminbi for consumption use from all financial institutions totaled 2.4 trillion yuan, an increase of 206.8 billion yuan. Of all consumption loans, those for individual housing totaled 1.99 trillion yuan, an increase of 143.9 billion yuan.
Funds rose in 2006 by enterprises through issuing stocks and share rights on stock market amounted to 559.4 billion yuan, an increase of 371.2 billion yuan over the previous year. Of this total, 128 companies issued A-shares (including newly issued and convertible loan stocks) and other 2 companies issued A-share rights, receiving 246.4 billion yuan worth of capital altogether, an increase of 212.6 billion yuan over 2005. The issue of 34 H-shares raised another 313.1 billion yuan worth of capital, an increase of 158.6 billion yuan. The number of listed companies (with A- or B-shares) on China’s stock market rose from 1,381 at the end of 2005 to 1,434 at the end of 2006, representing 8,940.4 billion yuan worth of market value, a growth of 175.7 percent over the previous year.
The total corporate bonds issued throughout the year reached 101.5 billion yuan, an increase of 36.1 billion yuan over 2005; and the short-term financing funds were 294.3 billion yuan, an increase of 155.1 billion yuan.
The premium received by the insurance companies totaled 564.1 billion yuan in 2006, up 14.4 percent over the previous year. Of this total, life insurance premium amounted to 359.3 billion yuan, health and casualty insurance premium 53.9 billion yuan, and property insurance premium 150.9 billion yuan.
Insurance companies paid an indemnity worth of 143.9 billion yuan, of which, life insurance indemnity was 46.5 billion yuan, health and casualty insurance indemnity 17.7 billion yuan, and property insurance indemnity 79.6 billion yuan.
IX. Education, Science and Technology
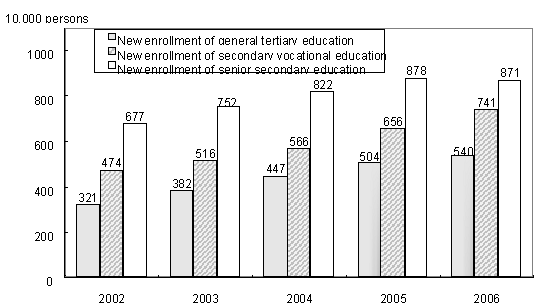
In 2006, the post-graduate education enrollment was 1.10 million students with 400 thousand new students and 260 thousand graduates. The general tertiary education enrollment was 17.39 million students with 5.40 million new students and 3.77 million graduates. Vocational secondary schools of various types had 18.09 million enrolled students, including 7.41 million new entrants, and 4.76 million graduates. Senior secondary schools had 25.15 million enrolled students, including 8.71 million new entrants, and 7.27 million graduates. Students enrolled in junior secondary schools totaled 59.58 million, including 19.30 million new entrants, and 20.72 million graduates. The country had a primary education enrollment of 107.12 million students, including 17.29 million new entrants, and 19.28 million graduates. There were 360 thousand students in special education schools, with 50 thousand new entrants. Kindergartens accommodated 22.64 million children.
Figure 9: New Entrants into Education, 2002-2006
The amount of expenditures on research and development activities (R&D) was worth 294.3 billion yuan in 2006, up 20.1 percent over 2005, accounting for 1.41 percent of GDP. Of this total, 14.8 billion yuan was appropriated for fundamental research programs. A total number of 1,409 projects under the National Key Technology Research and Development Program and 2,841 projects under the Hi-tech Research and Development Program (the 863 Program) were implemented. The year 2006 saw the establishment of 7 new national engineering research centers and 3 national engineering laboratories.
The number of state validated enterprise technical centers reached 438 by the end of the year. A total of 33 thousand scientific research outcomes at and above provincial or ministerial level were achieved. Some 573 thousand patent applications were accepted from home and abroad, of which 470 thousand were domestic applications, accounting for 82.1 percent of the total. A total number of 210 thousand patent applications for new inventions were accepted, of which 122 thousand were from domestic applicants or 58.1 percent of the total. A total of 268 thousand patents were authorized in 2006, of which 224 thousand were domestic patents, accounting for 83.5 percent of the total. A total of 58 thousand patents for new inventions were authorized, of which 25 thousand were domestic ones, accounting for 43.4 percent. A total of 206 thousand technology transfer contracts were signed, representing 181.8 billion yuan in value, up 20.4 percent over the previous year.
By the end of 2006, there were altogether 21,458 laboratories for product inspection, including 325 national inspection centers. There were 184 institutions for certification of product quality systems, which accumulatively certified products in 49 thousand enterprises. A total of 3,750 authorized measurement institutions enforced compulsory inspection on 37.30 million measurement instruments in the year. Some 1,950 national standards were developed or revised in the year, including 1,100 new standards. The country had 18,053 meteorology observatories, including 249 national climate observatories, 2,297 national weather observatories and 15,507 regional weather observation stations. There were 1,253 seismological monitor stations and 31 seismological remote monitor network stations. The number of oceanic observation and monitor spots reached 8,800. Mapping departments published 1,779 maps and 532 mapping books.
X. Culture, Public Health and Sports
At the end of 2006, there were 2,766 art-performing groups, 2,889 culture centers, 2,767 public libraries, 1,593 museums, 267 radio broadcasting stations, 296 television stations and 46 educational television stations throughout China. Subscribers to cable television programs numbered 138.62 million. A number of 209 cities provided digital cable television services covering 12.62 million subscribers. Radio broadcasting and television broadcasting coverage rates were 95.0 percent and 96.2 percent respectively. The country produced 330 feature movies and 62 science, educational, documentary and cartoon movies. A total of 41.6 billion copies of newspapers and 3.0 billion copies of magazines were issued, and 6.2 billion copies of books published. By the end of the year, there were 3,994 archives in
By the end of 2006, there were 300 thousand health institutions in
In 2006, Chinese athletes won 141 world championships on 24 sports events. Eleven athletes and 3 teams broke 21 world records on 25 occasions. In December 2006, Chinese athletes won 165 gold medals, 88 silver medals and 63 bronze medals in the 15th Asian Games at
XI. Population, Living Conditions and Social Security
At the end of 2006, the total number of Chinese population reached 1,314.48 million, an increase of 6.92 million over the previous year. The year 2006 saw 15.84 million births, a crude birth rate of 12.09 per thousand, and 8.92 million deaths, or a crude death rate of 6.81 per thousand. The natural growth rate was 5.28 per thousand. The sex ratio at birth was 119.25.
Table 14: Composition of Population in 2006
Unit: 10,000 persons
|
|
Population (Year-end figure) |
Percentage (%) |
|
National Total |
131448 |
100.0 |
|
Of which: Urban |
57706 |
43.9 |
|
Rural |
73742 |
56.1 |
|
Of which: Male |
67728 |
51.5 |
|
Female |
63720 |
48.5 |
|
Of which: 0-14 years |
25961 |
19.8 |
|
15-59 years |
90586 |
68.9 |
|
60 years and over |
14901 |
11.3 |
|
Of which: 65 years and over |
10419 |
7.9 |
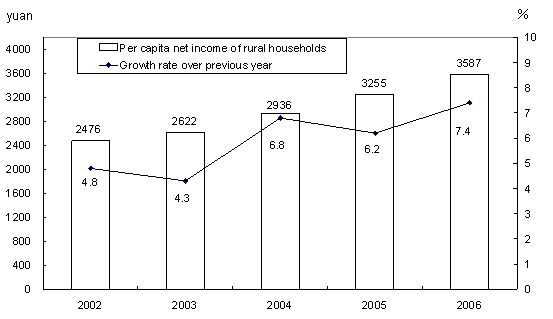
In 2006, the annual per capita net income of rural households was 3,587 yuan, or a real increase of 7.4 percent. The annual per capita disposable income of urban households was 11,759 yuan, or a real increase of 10.4 percent. The Engel coefficient (which refers to the proportion of expenditure on food to the total expenditure of households) was 43 percent for rural households and 35.8 percent for urban households. The population in absolute poverty in rural areas with annual per capita net income below 693 yuan numbered 21.48 million at the end of 2006, a decline of 2.17 million over the previous year.
The low-income population in rural areas with annual per capita net income between 694 and 958 yuan numbered 35.50 million, a decline of 5.17 million.
Figure 10: Per Capita Disposable Income of Urban Households and Its Growth, 2002-2006
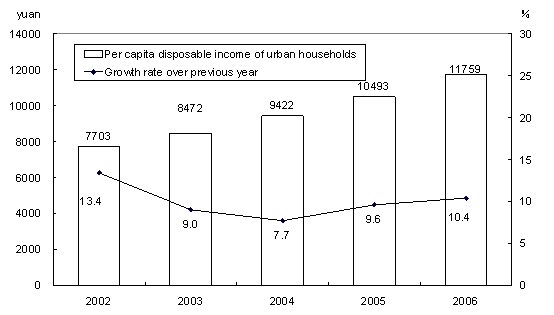
Figure 11: Per Capita Net Income of Rural Households and Its Growth, 2002-2006
At the end of 2006, 186.49 million people participated in basic pension programs, a year-on-year increase of 11.62 million. Of this total, 140.28 million were staff and workers, and 46.21 million were retirees. A total of 157.37 million people participated in urban basic health insurance programs, an increase of 19.54 million, of whom 115.87 million were staff and workers, 41.50 million were retirees. About 111.87 million people participated in unemployment insurance programs, an increase of 5,390 thousand. Some 102.35 million people participated in work accident insurance, an increase of 17.57 million, of which 25.38 million were migrant workers coming from the rural areas, an increase of 12.86 million. Some 64.46 million people participated in maternity insurance programs, an increase of 10.38 million.
The total income of various social security funds reached 851.7 billion yuan and the total expenditure stood at 658.3 billion yuan. The number of people receiving unemployment insurance payment stood at 3.27 million. Some 22.41 million urban residents received the government minimum living allowances, or 67 thousand more than the previous year. About 15.09 rural residents received the government minimum living allowance, an increase of 6.84 million.
Social welfare institutions of various types provided 1.75 million beds by the end of 2006, accommodating 1.36 million inmates. There were 120 thousand community service facilities in urban areas, including 9,817 comprehensive community service centers. Some 49.6 billion yuan worth of social welfare lottery tickets were sold, raising 17.4 billion yuan of social welfare funds. Another 3.5 billion yuan were received from direct donations.
XII. Resources, Environment and Work Safety
Some 167 thousand hectares of cultivated land was used for construction purpose in 2006. An area of 36 thousand hectares of cultivated land was destroyed by disasters, 339 thousand hectares of farmland was converted into land for ecological preservation and structural adjustment to agriculture led to a reduction of 40 thousand hectares of cultivated land. Non-reported farmland of 91 thousand hectares used for construction purposes in earlier years was revealed in 2006. Land reclamation and re-development programs added 367 thousand hectares of cultivated land. As a result, the year 2006 witnessed a net reduction of 306 thousand hectares of cultivated land.
The total stock of water resources in 2006 was 2,550.0 billion cubic meters, a year-on-year decline of 9.1 percent, or 1,945 cubic meters in per capita terms, down by 9.6 percent. The annual average precipitation was 604 millimeters, down by 6.2 percent. Large reservoirs in
National land surveys and geological explorations discovered a total of 213 new mineral deposits in large or medium size, including 42 energy mineral deposits, 85 metallic mineral deposits, 85 non-metallic mineral deposits and 1 aqueous and gaseous deposit. Increased reserves were found for 72 minerals, including 944 million tons of crude oil, 538.1 billion cubic meters of natural gas and 36.7 billion tons of coal.
A total of 4.57 million hectares of forest were planted, of which 2.52 million were afforested by manpower. Some 2.97 million hectares were afforested through key afforestation projects, accounting for 65 percent of the total planted area of the year. About 1.89 billion trees were planted in 2006 by volunteers. By the end of 2006, there were 233 national ecological demonstration zones approved and 2,395 natural reserves including 265 national ones and covering a total area of 151.54 million hectares, or 15 percent of the total land area of
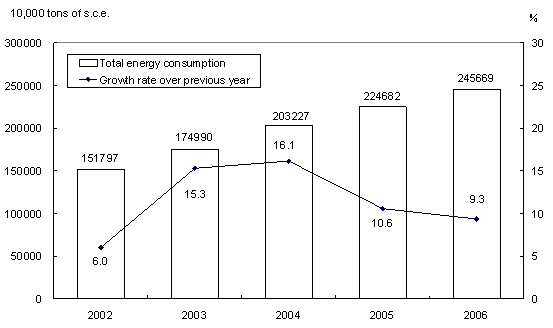
Preliminary estimation indicated that the total energy consumption in 2006 amounted to 2.46 billion tons of standard coal equivalent, up 9.3 percent over 2005. Of this total, the consumption of coal was 2.37 billion tons, up 9.6 percent; crude oil 320 million tons, up 7.1 percent; natural gas 55.6 billion cubic meters, up 19.9 percent; hydro-electric power 416.7 billion kilowatt hours, up 5.0 percent; and nuclear power 54.3 billion kilowatt hours, up 2.4 percent. The consumption of major kinds of raw materials included 450 million tons of rolled steel, up 17.2 percent; 3.72 million tons of copper, down by 4.0 percent; 8.65 million tons of aluminum, up 32.1 percent; 9.39 million tons of ethylene, up by 23.9 percent; and 1.20 billion tons of cement, up 14.5 percent. Energy consumption for producing 10 thousand yuan worth of GDP was 1.21 tons of standard coal equivalents, down by 1.23 percent over that in 2005.
Figure 12: Total Energy Consumption and Its Growth, 2002-2006
Monitoring of water quality on 408 sections of the 7 major water systems in
Monitoring of oceanic water quality at 288 offshore monitoring stations indicated that oceanic water met the national quality standard Grade I and II in 67.7 percent of the stations, up 0.4 percentage point from the previous year; water quality at 8.0 percent of the stations met Grade III standard, down by 0.9 percentage point; and water of Grade IV or inferior quality was found in 24.3 percent of the stations, up by 0.5 percentage point. A total of 149 thousand square kilometers of oceanic waters did not meet the quality standard for clean oceanic water, an increase of about 10 thousand square kilometers. Of this total, seriously polluted oceanic area occupied 29 thousand square kilometers.
In the 559 cities covered by air quality monitoring program, 349 cities reached or topped air quality standard Grade II, accounting for 62.4 percent of all cities under the program; 159 cities attained Grade III, accounting for 28.4 percent; and air quality in 51 cities was inferior to Grade III, accounting for 9.1 percent. Of the 378 cities subject to noise monitoring program, 5.0 percent enjoyed fairly good environment, 63.8 percent had good environment, 29.3 percent had light noise pollution, 1.6 percent experienced medium noise pollution and 0.3 percent of cities suffered serious noise pollution in downtown areas.
In 2006, the total emission of chemical oxygen demand (COD) of the whole country reached 14.31 million tons, up by 1.2 percent over the previous year; and that of the sulphur dioxide (SO2) was 25.94 million tons, up 1.8 percent.
At the end of 2006, the daily treatment capacity of municipal sewage reached 61.22 million cubic meters, up 6.9 percent. Municipal sewage treatment rate was 56 percent, up 4 percentage points. The floor space with central heating systems amounted to 2.65 billion square meters, up 5.1 percent. Greenery coverage reached 33.5 percent of the urban area, up 1 percentage point.
In 2006, natural disasters caused 252.8 billion yuan worth of direct economic loss, up 23.8 percent. Natural disasters hit 41.09 million hectares of crops, up 5.9 percent, of which 5.41 million hectares of crops was demolished, up 17.7 percent. 2006 witnessed 7,775 forest fires, which were 3,767 less than that in the previous year. There were five extra big forest fires in 2006, 2 less than that in the previous year. The fires hit 410 thousand hectares of forest, 4.5 times more than in 2005. Oceanic disasters caused a direct economic loss of 21.8 billion yuan, down by 34.3 percent. The occurrence of 93 red tides in the year, 11 tides more than in 2005, hit an accumulative area of 19,840 square kilometers, down by 26.7 percent.
The death toll due to work accidents amounted to 112,822 people, a year-on-year decrease of 11.2 percent. The death toll from work accidents every 100 million yuan worth of GDP was 0.56 person, a decline of 20.4 percent. Work accidents in industrial, mining and commercial enterprises caused 3.33 deaths out of every 100 thousand employees, down 13.5 percent. The death toll for producing one million tons of coal in coal mines was 2.04 persons, down 27.4 percent. The year 2006 witnessed 378,781 traffic accidents, claiming 89,455 lives, injuring 431 thousand people and causing a direct property loss of 1.49 billion yuan. The death toll per 10 thousand vehicles was 6.20 persons, down by 18.4 percent.
Notes:
1. All figures in this Communiqué are preliminary statistics.
2. Statistics in this Communiqué do not include Hong Kong SAR, Macao SAR and
3. Due to the rounding-off reasons, the subentries may not add up to the aggregate totals.
4. Gross domestic product (GDP) and value added as quoted in this Communiqué are calculated at current prices, whereas their growth rates are at comparable prices.
5. Output and consumption of rolled steel include duplicated counting of rolled steel as intermediate inputs used for producing other types of rolled steel.
6. The national total of fixed assets investment is larger than the aggregate sum by adding up the subtotals of fixed assets investment in the eastern areas, central areas, western areas and northeastern areas due to the fact that some of the non-classified investments are not covered by regional figures.
7. The investment in real estate includes the investment made in real estate development, construction of buildings for own use, property management, intermediary services and other real estate development.
8. The consumption of water and energy for producing 10 thousand yuan worth of GDP is calculated at 2005 constant prices. The turnover of post and telecommunication services is calculated at constant prices of 2000.