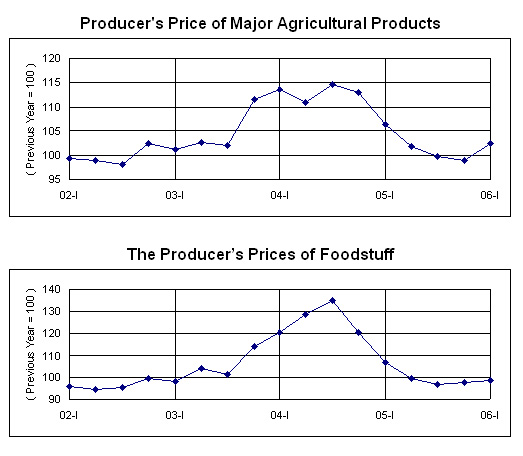
The Producer's Price of Major Agricultural Products Rose by 2.4 Percent in the First Quarter
Producer's price of major agricultural products refers to the farmers and agricultural producers to sell their farm products directly to the actual unit price. In the first quarter, the national producer’s price of major agricultural products was up by 2.4 percent as compared with same period of last year, as the NBS’s producer’s price survey results on 31000 agricultural holdings showed (the direct price which sold by the agricultural producers). Of which, crop planting, forestry, and fishery rose by 4.8 percent, 8.9 percent and 2.3 percent respectively, whereas the animal husbandry was down by 1.6 percent; that of foodstuff fell 1.4 percent compared with same period of previous year, price of cotton turned around, whereas oil-bearing crops continued to decline. National producer’s price of major agricultural products trend shows the following characteristics:
I. The producer’s prices of crop planting were up by 4.8 percent. Cotton, sugar-bearing crops, vegetables and fruit prices is the main important factor of pulling up the producer’s price of crop planting in the first quarter.
The producer’s prices of foodstuff fell 1.4 percent over the same period. Under the national strong supports of foodstuff production and strengthened the macro-control policy, China’s foodstuff output was 193.6 billion kilograms of last year, the annual production increased by 3.1 percent; The net import of foodstuff was nearly 86.0 billion kilograms, the anticipative market of foodstuff supply is getting well. The grist and legume was respectively down by 1.4 percent and 5.6 percent in the first quarter, whereas the potato was up by 9.9 percent. In the main grain varieties, the price of wheat, corn and paddy was down by 5.1 percent, 0.6 percent, and 1.1 percent; that of non glutinous rice was up by 1.5 percent, early rice was down by 2.1 percent, and late rice was down by 2.5 percent; that of soybean was down by 6.0 percent, and mung bean was down by 3.7 percent. In view of different regions, the producer’s price of main foodstuff production areas was down by 1.6 percent, the main sale areas, and production and sale balance areas was down by 0.5 percent and 1.4 percent respectively.
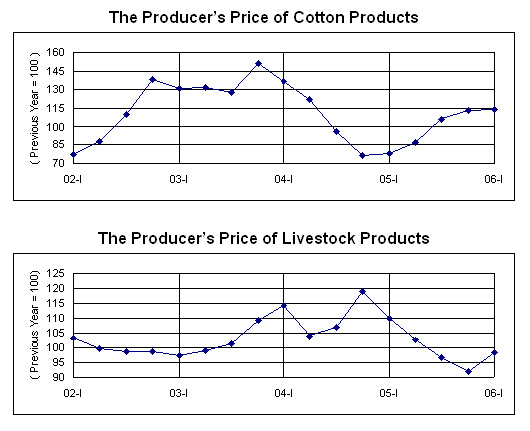
The producer’s price of cotton products increased 14.5 percent as compared with the same price of previous year, drove the producer’s price index of major agricultural products rose by 0.3 percentage points. The increase of cotton price was mainly due to the national cotton planting acreage was down by 11.1 percent, and the cotton production dropped by 9.8 percent over the previous year; moreover, domestic demand of cotton continued growing, the obvious contradiction between supply and demand to promoting cotton rebound.
The producer’s price of oil-bearing crops dropped whereas the sugar-bearing crops increased. In the first quarter, oil-bearing crops, rapeseed, and peanut was down by 6.9 percent, 9.5 percent, and 2.5 percent respectively, sesame remained the general level. The sugar-bearing crops has a substantial increase of 35.1 percent, drove the producer’s price index of major agricultural products rose by 0.4 percentage points. The main reason of sugar-bearing crops’ price increasing was due to the last year’s output of sugar-bearing crops was declined by 0.2 percent. The sugar price continued to increase in the international market,
The producer’s price of vegetables and fruits increased. By festivals and climate factors, the producer’s price of vegetables and fruits was up by 14.2 percent and 18.1 percent respectively; that of tea was up by 4.4 percent, whereas the tobacco leaf was down by 3.7 percent.
II. The producer’s price of forestry products was up by 8.9 percent.
III. The producer’s price of livestock products were down by 1.6 percent. The prices of live pigs, poultry and eggs were important factors in stimulating livestock prices. The producer’s price of pigs slaughtered and sold dropped by 1.4 percent as compared with that same period of last year, that of poultry and eggs dropped by 4 percent and 4.1 percent respectively. The main reasons of decreasing price of pigs and poultry: Firstly,
The producer’s price of meat cattle and beefs, live sheep rose by 0.2 percent, and 1.5 percent; that of dairy products rose by 3.3 percent; that of feather products remain the general level.
IV. The producer’s price of fishery products was up by 2.3 percent. By enhancing the common effects of consumer preferences and consumption levels, aquatic products consumption increased steadily, and price market is getting highly. The producer’s price of seawater products rose by 5.2 percent as compared with that same period of last year; of which, seawater fish, and seashell rose by 7.0 percent and 1.0 percent respectively; As the supply sufficiently, the producer’s price of freshwater products and freshwater fish dropped by 0.5 percent and 0.6 percent respectively; that of freshwater shrimp and crab rose by 2.2 percent.
PPI of Major Agricultural Products
(Same period last year =100)
|
|
Year 2005 |
Year 2006 | |||
|
|
First Quarter |
Second Quarter |
Third Quarter |
Fourth Quarter |
First Quarter |
|
|
|
|
|
|
|
|
Producer’s Price Index |
106.40 |
101.75 |
99.72 |
98.81 |
102.37 |
|
|
|
|
|
|
|
|
1. Farm Crops |
104.20 |
100.59 |
100.60 |
101.99 |
104.78 |
|
Grain Crops |
106.62 |
99.46 |
96.78 |
97.75 |
98.57 |
|
Cereal |
107.95 |
99.74 |
97.11 |
97.81 |
98.61 |
|
Wheat |
109.41 |
99.07 |
95.81 |
95.18 |
94.92 |
|
Rice |
112.98 |
101.41 |
98.35 |
100.13 |
98.88 |
|
Corn |
101.15 |
97.64 |
95.67 |
96.30 |
99.40 |
|
Soybeans |
99.95 |
95.41 |
92.74 |
93.49 |
94.38 |
|
Soya |
98.12 |
94.02 |
90.89 |
92.14 |
93.96 |
|
Tubers |
103.06 |
106.47 |
102.92 |
109.13 |
109.89 |
|
Oil-bearing Crops |
99.40 |
88.70 |
89.02 |
91.07 |
93.10 |
|
Cotton |
77.98 |
87.05 |
106.00 |
113.73 |
114.48 |
|
Sugar Crops |
107.60 |
104.16 |
94.93 |
117.66 |
135.05 |
|
Tobacco |
101.04 |
106.58 |
100.80 |
104.46 |
96.31 |
|
Vegetables |
105.52 |
105.65 |
109.41 |
108.23 |
114.24 |
|
Fruits |
102.48 |
107.27 |
108.87 |
108.10 |
118.05 |
|
Tea |
111.01 |
107.50 |
108.87 |
113.86 |
104.38 |
|
|
|
|
|
|
|
|
2. |
102.58 |
102.45 |
104.42 |
107.20 |
108.89 |
|
Timber |
102.92 |
104.54 |
105.06 |
101.64 |
107.14 |
|
Bamboo |
105.97 |
100.57 |
105.14 |
102.09 |
112.14 |
|
Glue Grease and Fruitage Products |
102.40 |
101.50 |
104.11 |
109.83 |
109.69 |
|
|
|
|
|
|
|
|
3. Livestock Products |
109.95 |
102.52 |
96.78 |
92.10 |
98.43 |
|
Hogs (gross weight) |
111.91 |
100.60 |
90.88 |
85.47 |
98.55 |
|
Cattle and Buffaloes (gross weight) |
102.89 |
101.37 |
101.60 |
100.48 |
100.20 |
|
Sheep and Goats (gross weight) |
105.08 |
102.21 |
100.08 |
99.32 |
101.48 |
|
Meat Poultry (gross weight) |
110.51 |
107.23 |
105.61 |
97.38 |
95.95 |
|
Poultry Eggs |
111.98 |
107.48 |
105.77 |
101.48 |
95.91 |
|
Milk |
101.15 |
99.32 |
99.06 |
99.25 |
103.31 |
|
Feather Products |
107.56 |
106.47 |
106.72 |
104.43 |
100.00 |
|
|
|
|
|
|
|
|
4. Fishery Products |
105.80 |
103.95 |
103.76 |
103.73 |
102.26 |
|
Seawater Aquatic Products |
100.88 |
103.63 |
104.58 |
105.27 |
105.20 |
|
Seawater Fish |
100.17 |
104.51 |
105.88 |
104.92 |
106.96 |
|
Seashell |
105.05 |
100.94 |
101.35 |
106.17 |
100.98 |
|
Inland Waters Aquatic Products |
110.36 |
104.25 |
103.00 |
102.31 |
99.54 |
|
Freshwater Fish |
110.00 |
103.96 |
102.33 |
101.81 |
99.39 |
|
Freshwater Shrimp and Crabs |
116.78 |
109.31 |
114.88 |
111.08 |
102.18 |
|
|
|
|
|
|
|