Statistical Communiqué on the 2005 National Economic and Social Development
STATISTICAL COMMUNIQUÉ OF
THE PEOPLE'S REPUBLIC OF
ON THE 2005 NATIONAL
ECONOMIC AND SOCIAL DEVELOPMENT
National Bureau of Statistics of China
February 28, 2006
In 2005, under the correct leadership of the CPC Central Committee and the State Council, people of all nationalities of China, taking as the guidance of Deng Xiaoping Theory, the important thought of “Three Represents”, and the scientific approach to development for economic and social development, carefully carried out various measures set by the central government aiming at enhancing and improving macro-control. Remarkable achievements were made in national economic and social development. The national economy kept stable and fairly fast growth; breakthrough was made in reforms in major fields and key sect
I. General Outlook
Preliminary estimation indicated that the gross domestic product (GDP) of the year was 18,232.1 billion yuan, up by 9.9 percent over the previous year. The value-added of the primary industry was 2,271.8 billion yuan, up by 5.2 percent. The value-added of the secondary industry was 8,620.8 billion yuan, up by 11.4 percent. The value-added of the tertiary industry was 7,339.5 billion yuan, up by 9.6 percent. The value-added of the primary industry, secondary industry and the tertiary industry accounted for 12.4 percent, 47.3 percent and 40.3 percent respectively of the GDP.
Figure1: Gross Domestic Product and Its Growth in the 10th Five-year Plan Period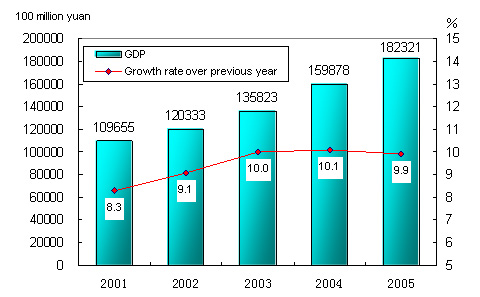
The general level of consumer prices in
|
Table 1: Change in Consumer Prices in 2005 over 2004 | |||
|
| |||
|
Unit: % | |||
|
Item |
National Average |
| |
|
Urban |
Rural | ||
|
|
|
|
|
|
General level of consumer prices |
1.8 |
1.6 |
2.2 |
|
Food |
2.9 |
3.1 |
2.5 |
|
Of which: grain |
1.4 |
1.5 |
1.3 |
|
Tobaccos and alcohols |
0.4 |
0.3 |
0.5 |
|
Clothing |
-1.7 |
-2.0 |
-0.9 |
|
Household appliances and services |
-0.1 |
-0.3 |
0.3 |
|
Medical, health and personal articles |
-0.1 |
-0.4 |
0.5 |
|
Transportation and telecommunications |
-1.0 |
-1.6 |
0.3 |
|
Recreational, educational, cultural articles and services |
2.2 |
1.3 |
3.8 |
|
Housing |
5.4 |
5.6 |
5.2 |
|
|
|
|
|
By the end of 2005, the total of employed people in China numbered 758.25 million, or 6.25 million more than at the end of 2004. Of this total, 273.31 million were employed in urban areas, an increase of 9.7 million or a net increase of 8.55 million. The urban unemployment rate through
By the end of 2005, China’s foreign exchange reserves reac
Various tax incomes for the whole year reached 3,086.6 billion yuan (excluding tariffs and agricultural taxes); it was up by 20.0 percent or an increase of 514.8 billion yuan over 2004. The profits made by industrial enterprises above designated size stood at 1,436.2 billion yuan, up by 22.6 percent over the previous year, and the ratio of profits to sales was 5.9 percent, which was 0.1 percentage point lower than that in the previous year.
II. Agriculture
In 2005, the sown areas of grain was 104.27 million hectares, an increase of 2.67 million hectares as compared with that in the previous year, and the sown areas of cotton was 5.06 million hectares, a decline of 630,000 hectares. The sown areas of oil-bearing crops was 14.31 million hectares, a decline of 120,000 hectares, the sown areas of sugar crops was 1.56 million hectares, a decrease of 10,000 hectares; and that for vegetables stood at 17.74 million hectares, an increase of 180,000 hectares.
The total output of grain in 2005 was 484.01 million tons, up by 14.54 million tons or 3.1 percent over the previous year. The output of cotton was 5.70 million tons, a decrease of 9.8 percent; that of oil-bearing crops was 30.78 million tons, up by 0.4 percent. The output of sugar crops was 95.51 million tons, a decrease of 0.2 percent. Steady progress was made in vegetable and fruit production with optimized varieties (Table 2).
|
Table 2: Output of Major Farm Products, 2005 | ||
|
| ||
|
Unit: 10,000 tons | ||
|
Item |
Output |
Increase over 2004 (%) |
|
|
|
|
|
Grain |
48401 |
3.1 |
|
Summer crops |
10627 |
5.1 |
|
Early rice |
3179 |
-1.3 |
|
Autumn crops |
34595 |
2.9 |
|
Oil-bearing crops |
3078 |
0.4 |
|
Peanuts |
1434 |
0.0 |
|
Rapeseed |
1305 |
-1.0 |
|
Cotton |
570 |
-9.8 |
|
Sugar crops |
9551 |
-0.2 |
|
Sugarcane |
8760 |
-2.5 |
|
Beetroot |
791 |
35.2 |
|
Cured tobacco |
241 |
11.5 |
|
Tea |
92 |
9.8 |
|
Fruits |
16076 |
4.8 |
|
Vegetables |
56284 |
2.2 |
|
|
|
|
Figure 2: Output of Grain and Its Growth in the 10th Five-year Plan Period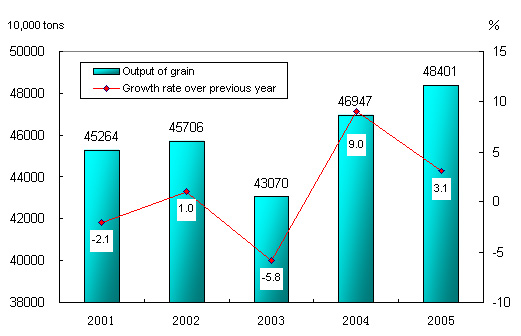
The total output of meat for the year reached 77.0 million tons, up by 6.3 percent. Of this total, the output of beef and mutton was up 5.6 percent and 9.3 percent respectively. The total output of aquatic products was 51.0 million tons, up by 4.0 percent.
The total production of timber for the year 2005 reached 47.46 million cubic meters, a decline of 8.7 percent.
Over 1.02 million hectares of farmland were installed with effective irrigation system, another 1.23 million hectares of farmland were guaranteed by water-saving irrigation system.
III. Industry and Construction
In 2005, the total value-added of the industrial sector was 7,619.0 billion yuan, up by 11.4 percent over the previous year. The value-added of industrial enterprises above designated size was 6,642.5 billion yuan, up by 16.4 percent (Table 3). The sales ratio of industrial enterprises was 98.1 percent, maintaining the same level as in 2004.
|
Table 3: Value-added of Industrial Enterprises above Designated Size in 2005 | ||
|
| ||
|
Unit: 100 million yuan | ||
|
Item |
Value-added |
Increase over 2004 (%) |
|
|
|
|
|
Value-added of industrial enterprises above designated size |
66425 |
16.4 |
|
Of which: State-owned and state-holding enterprises |
26063 |
10.7 |
|
Of which: Collective enterprises |
2581 |
12.4 |
|
Share-holding enterprises |
32173 |
17.8 |
|
Enterprises invested by foreigners or investors from |
18977 |
16.6 |
|
Of which: Private enterprises |
11807 |
25.3 |
|
Of which: Light industry |
20585 |
15.2 |
|
Heavy industry |
45840 |
17.0 |
|
|
|
|
Figure 3: Industrial Value-added and Growth in the 10th Five-year Plan Period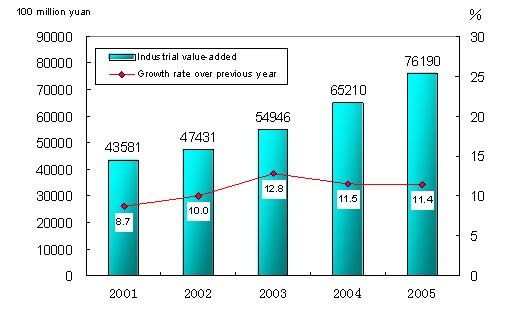
In 2005, the total output of primary energy reached 2.06 billion tons of standard coal equivalent, up by 9.5 percent over the previous year. The electricity generated in the whole year was 2,474.7 billion kilowatt-hours, up by 12.3 percent. The output of coal was 2.19 billion tons, up by 9.9 percent. The output of crude oil reached 181 million tons, up by 2.8 percent.
In 2005, among major raw material products, the output of crude steel stood at 352 million tons, up by 24.6 percent; that of rolled steel was 397 million tons, up by 24.1 percent. The output of cement was 1.06 billion tons, up by 10.0 percent. The production of 10 kinds of nonferrous metals went up by 13.2 percent. Output of major chemical products including sulfuric acid, soda ash, caustic soda, ethylene, etc. increased from 9.9 percent to 21.4 percent.
In 2005, the production of motor vehicles reached 5.70 million, an increase of 12.1 percent, of this total, the production of cars reached 2.77million, up by 19.7 percent.
The output of high-tech products such as program-controlled switchboards, mobile telephones and microcomputers rose by a range of 1.3 percent to 35.3 percent (Table 4). Of the industrial enterprises above designated size, the value-added of high-tech industry in 2005 was 783.9 billion yuan, up by 19.8 percent over the previous year.
|
Table 4: Output of Major Industrial Products in 2005 | |||
|
| |||
|
Product |
Unit |
Output |
Increase over 2004 (%) |
|
|
|
|
|
|
Yarn |
10000 tons |
1440 |
11.5 |
|
Cloth |
100 million meters |
470 |
11.9 |
|
Chemical fibers |
10000 tons |
1618 |
13.6 |
|
Sugar (final product) |
10000 tons |
903 |
-12.6 |
|
Cigarettes |
100 million |
19560 |
4.4 |
|
Color TV sets |
10000 |
8283 |
11.5 |
|
Household refrigerators |
10000 |
2986 |
-0.7 |
|
Room air conditioners |
10000 |
6765 |
5.9 |
|
Total primary energy production |
100 million tons of standard coal equivalent |
20.6 |
9.5 |
|
Coal |
100 million tons |
21.9 |
9.9 |
|
Crude oil |
100 million tons |
1.81 |
2.8 |
|
Natural gas |
100 million cubic meters |
500 |
20.6 |
|
Electricity |
100 million kilowatt-hours |
24747 |
12.3 |
|
Of which: Thermal-power |
100 million kilowatt-hours |
20180 |
12.4 |
|
Hydro-power |
100 million kilowatt-hours |
4010 |
13.4 |
|
Crude steel |
10000 tons |
35239 |
24.6 |
|
Rolled steel |
10000 tons |
39692 |
24.1 |
|
Ten kinds of nonferrous metals |
10000 tons |
1635 |
13.2 |
|
Of which: Refined copper (copper) |
10000 tons |
260 |
18.1 |
|
Aluminum electrolyze |
10000 tons |
779 |
16.4 |
|
Aluminum oxide |
10000 tons |
851 |
21.9 |
|
Cement |
100 million tons |
10.6 |
10.0 |
|
Sulfuric acid |
10000 tons |
4529 |
15.3 |
|
Soda ash |
10000 tons |
1467 |
9.9 |
|
Caustic soda |
10000 tons |
1264 |
21.4 |
|
Ethylene |
10000 tons |
756 |
20.0 |
|
Chemical fertilizers (100 percent equivalent) |
10000 tons |
5220 |
8.6 |
|
Power-generating equipment |
10000 kilowatts |
9200 |
28.9 |
|
Motor vehicles |
10000 |
570 |
12.1 |
|
Of which: Cars |
10000 |
277 |
19.7 |
|
Large & medium tractors |
10000 |
16.2 |
42.7 |
|
Integrated circuits |
100 million pieces |
266 |
12.9 |
|
Program-controlled switchboards |
10000 lines |
7721 |
1.3 |
|
Mobile telephones |
10000 |
30354 |
6.4 |
|
Micro-computers |
10000 |
8084 |
35.3 |
|
|
|
|
|
Among the industrial enterprises above designated size, the profits of state-owned and state-holding enterprises stood at 644.7 billion yuan, up by 17.4 percent; that of the collective enterprises was 55.1 billion yuan, up by 32.0 percent. The profits made by share-holding enterprise
In 2005, the value-added of construction enterprises in China was 1,001.8 billion yuan, up by 11.9 percent over the previous year. The profits made by construction enterprises with qualification certificates through general contracts and specialized contracts reached 81.8 billion yuan, up by 13.8 percent, with their taxes paid reaching 109.9 billion yuan, up by 17.4 percent.
IV. Investment in Fixed Assets
The completed investment in fixed assets of the country in 2005 was 8, 860.4 billion yuan, up by 25.7 percent over the previous year. Of the total investment, that in urban areas was 7,509.6 billon yuan, up by 27.2 percent; and that in rural areas reached 1,350.8 billion yuan, up by 18.0 percent.
Figure 4: Investment in Fixed Assets and Its Growth in the 10th Five-year Plan Period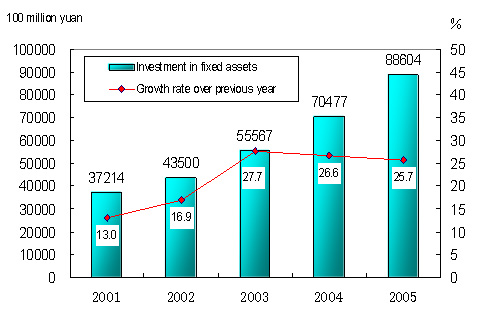
Of the investment in urban areas, the investment by state-owned and state-holding enterprises was 4,004.7 billion yuan, up by 17.5 percent over the previous year. The investment in the primary industry was 82.3 billion yuan, up by 27.5 percent; the investment in the secondary industry was 3,159.8 billion yuan, up by 38.4 percent; and that in the tertiary industry was 4,267.5 billion yuan, up by 20.0 percent. In terms of different sectors, the investment in coal mining and washing was up by 65.6 percent over the previous year; in the production and distribution of electric power and heat power, up by 33.7 percent; in the extraction of petroleum and natural gas, up by 29.7 percent; in railway transport, up by 45.7 percent; in the manufacture of transport equipment, up by 51.1 percent; in the manufacture of textile, up by 38.0 percent; in education, up by 8.4 percent, and in public health, up by 28.9 percent.
In 2005, the investment in real estate development was 1,575.9 billion yuan, up by 19.8 percent. The complete floor space of commercial buildings reached 487.93 million square meters, up by 14.9 percent. Total sales of commercial buildings reached 1,808.0 billion yuan. Of this total, the sales of completed housing accounted for 35.5 percent, and the forward delivery housing accounted for 64.5 percent.
|
Table 5: Newly Increased Production Capacity through Investment in Capital Construction in the 10th Five-year Plan Period | |||
|
| |||
|
Item |
Unit |
2001-2005 |
|
|
Of which: 2005 | |||
|
|
|
|
|
|
Newly increased power generating capacity |
10,000 kilowatts |
17655 |
6326 |
|
Power transformer equipment with a capacity of over 110,000 volts |
10,000 kilovolt-amperes |
40666 |
15306 |
|
New trunk railways put into operation |
Kilometer |
7063 |
1203 |
|
Double-track railways put into operation |
Kilometer |
3556 |
486 |
|
Electrified railways put into operation |
Kilometer |
5494 |
863 |
|
New highways |
Kilometer |
351173 |
129748 |
|
Of which: Expressways |
Kilometer |
23964 |
6457 |
|
Newly increased cargo-handling capacity of 10000-ton berths at harbors |
10,000 tons |
45232 |
18989 |
|
Newly installed capacity of telephone switchboards |
10,000 lines |
23254 |
4608 |
|
Newly installed length of optical-fiber cables |
10,000 km |
214 |
53 |
|
Newly installed capacity of digital cellular mobile phone switchboards |
10,000 subscribers |
35148 |
8598 |
|
|
|
|
|
A total of 14 power generators were currently in operation in the Three Gorges Project, having generated 94.0 billion kilowatt-hours of electricity. The West-East Electricity Transmission Project from north, central and south channels had built a power transmission capacity
V. Domestic Trade
In 2005, the total retail sales of consumer goods reached 6,717.7 billion yuan, up by 12.9 percent over the previous year, or a real growth of 12.0 percent if price factors were deducted. In terms of different areas, the retail sales of consumer goods in cities reached 4,509.5 billion yuan, up by 13.6 percent, and the retail sales of consumer goods at and below county level was 2,208.2 billion yuan, up by 11.5 percent. In terms of different sectors, the sales of the wholesale and retail industry reached 5,658.9 billion yuan, up 12.6 percent, the sales of the catering industry was 888.7 billion yuan, up 17.7 percent, and the sales of other industries was 170.1 billion yuan, up 0.4 percent.
Of the total retail sales by wholesale and retail enterprises above designated size, the sales of motor vehicles was up by 16.6 percent; petroleum and related products, up by 34.4 percent; cultural and office goods, up by 11.4 percent; telecommunication equipment, up by 19.9 percent; electric and electronic appliances for household use and audio-video equipment, up by 14.8 percent; building and decoration materials, up by 22.1 percent; daily necessities, up by 11.9 percent; furniture, up 13.3 percent; food, beverages, tobacco and liquor, up by 13.6 percent; clothing, up by 19.6 percent; cosmetics, up by 19.1 percent; and gold, silver and jewelry, up by 13.9 percent.
Figure 5: Total Retail Sales of Consumer Goods and Growth in the 10th Five-year Plan Period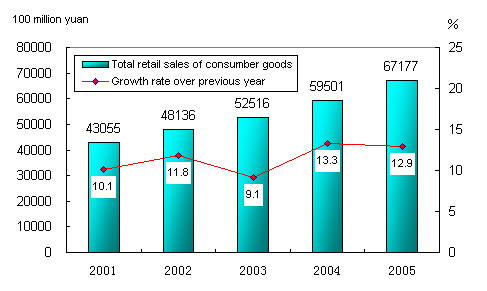
VI. Foreign Economic Relations
Total value of import and export in 2005 reached 1,422.1 billion US dollars, up 23.2 percent over the previous year. Of this total, the value
|
Table 6: Import and Export by Major Categories in 2005 | |||
|
| |||
|
Unit: 100 million USD | |||
|
Item |
Value |
Increase over 2004 (%) | |
|
|
|
|
|
|
Total import and export |
14221 |
23.2 | |
|
Export |
7620 |
28.4 | |
|
Of which: General trade |
3151 |
29.3 | |
|
Processing trade |
4165 |
27.0 | |
|
Of which: Mechanical and electronic products |
4267 |
32.0 | |
|
Import |
6601 |
17.6 | |
|
Of which: General trade |
2797 |
12.7 | |
|
Processing trade |
2740 |
23.6 | |
|
Of which: Mechanical and electronic products |
3504 |
16.0 | |
|
Trade Surplus |
1019 |
-- | |
|
Of which: General trade |
354 |
-- | |
|
Processing trade |
1425 |
-- | |
|
|
|
|
|
|
| ||||
|
| ||||
|
Unit: 100 million USD | ||||
|
Country or region |
Export |
Increase over 2004 (%) |
Import |
Increase over 2004 (%) |
|
|
|
|
|
|
|
|
1629 |
30.4 |
487 |
9.1 |
|
European Union |
1437 |
34.1 |
736 |
5.0 |
|
|
1245 |
23.4 |
122 |
3.6 |
|
|
840 |
14.3 |
1005 |
6.5 |
|
ASEAN |
554 |
29.1 |
750 |
19.1 |
|
|
351 |
26.2 |
768 |
23.4 |
|
|
165 |
22.2 |
747 |
15.3 |
|
|
132 |
45.2 |
159 |
31.0 |
|
|
|
|
|
|
Figure 6: Import and Export in the 10th Five-year Plan Period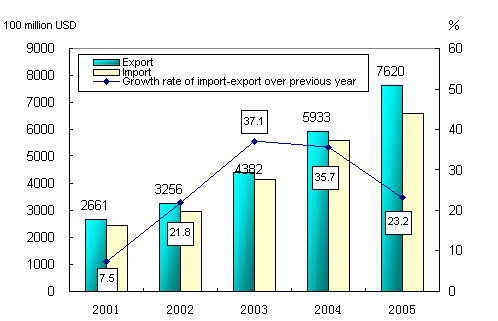
The year 2005 witnessed the approval of establishment of 44,001 foreign direct invested enterprises in
Figure7: The Foreign Direct Investment Actually Utilized and Its Growth in the 10th Five-year Plan Period Value in 100 million USD Sectors Contracted Projects Increase over 2004 (%) Actually Utilized Value Increase over 2004 (%) Total 44001 0.8 603.2 -0.5 Farming, Forestry, Animal Husbandry and Fishery 1058 -6.4 7.2 -35.5 Mining and Quarrying 252 -9.7 3.5 -34.0 Manufacturing 28928 -4.8 424.5 -1.3 Production and Supply of Electricity, Gas and Water 390 -14.3 13.9 22.7 Construction 457 11.2 4.9 -36.5 Transport, Storage, Post and Telecommunication Services, 734 15.1 18.1 42.4 Information Transmission, Computer Services and Software 1493 -8.0 10.1 10.7 Wholesales & Retail Trade 2602 53.1 10.4 40.4 Hotel & Catering Services 1207 2.8 5.6 -33.4 Banking 40 -7.0 2.2 -13.0 Real Estate Development 2120 20.0 54.2 -8.9 Leasing and Business Services 2981 12.0 37.5 32.6 Scientific Research, Technical Services and Geological Prospecting 926 47.2 3.4 15.8 Water Conservancy, Environment Protection and Public Facilities Management 139 -15.2 1.4 -39.3 Services to Households and Other Services 329 31.1 2.6 64.6 Education 51 -13.6 0.2 -53.8 Health, Social Security and Social Welfare 22 4.8 0.4 -55.1 Culture, Sports and Recreation 272 0 3.1 -31.8 Public Management and Social Organization -- -- 0.04 105.6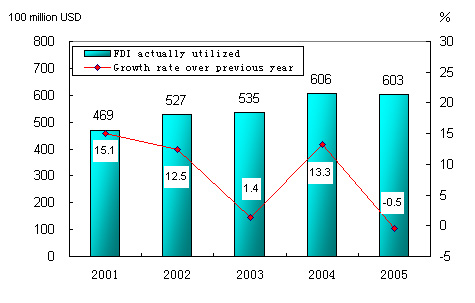
In 2005, the overseas direct investment (non-financial investment) by Chinese investors was 6.9 billion US dollars, up by 25.8 percent over the previous year.
In 2005, the accomplished business revenue through contracted overseas engineering projects was 21.8 billion US dollars, up by 24.6 percent, and the business revenue through overseas labor contracts was 4.8 billion US dollars, up by 27.5 percent.
VII. Transportation, Post, Telecommunications and Tourism
The value-added of the transportation, storage, post and telecommunication sectors reached 1,380.5 billion yuan in 2005, up 12.4 percent over the previous year (Table 9 and Table 10).
|
Table 9: Freight Traffic by All Means of Transportation in 2005 | |||||
|
| |||||
|
Item |
Unit |
Volume |
Increase over 2004 (%) | ||
|
|
|
|
|
|
|
|
Total freight traffic |
100 million tons |
183.7 |
7.7 | ||
|
Railways |
100 million tons |
27.0 |
8.2 | ||
|
Highways |
100 million tons |
132.9 |
6.7 | ||
|
Waterways |
100 million tons |
21.1 |
12.8 | ||
|
Civil aviation |
10 000 tons |
306.7 |
10.8 | ||
|
Pipelines |
100 million tons |
2.7 |
10.6 | ||
|
Freight turnover |
100 million ton-kilometers |
78329.8 |
12.8 | ||
|
Railways |
100 million ton-kilometers |
20730.5 |
7.5 | ||
|
Highways |
100 million ton-kilometers |
8573.8 |
9.3 | ||
|
Waterways |
100 million ton-kilometers |
48057.6 |
16.0 | ||
|
Civil aviation |
100 million ton-kilometers |
78.9 |
9.9 | ||
|
Pipelines |
100 million ton-kilometers |
889.0 |
12.4 | ||
|
|
|
|
|
|
|
|
Table 10. Passenger Traffic by All Means of Transportation in 2005 | |||||
|
| |||||
|
Item |
Unit |
Volume |
Increase over 2004 (%) | ||
|
|
|
|
|
|
|
|
Total passenger traffic |
100 million persons |
184.2 |
4.2 | ||
|
Railways |
100 million persons |
11.6 |
3.4 | ||
|
Highways |
100 million persons |
169.2 |
4.2 | ||
|
Waterways |
100 million persons |
2.0 |
3.6 | ||
|
Civil aviation |
10 000 persons |
13827.0 |
14.1 | ||
|
Passenger flows |
100 million person-kilometers |
17473.0 |
7.1 | ||
|
Railways |
100 million person-kilometers |
6061.8 |
6.1 | ||
|
Highways |
100 million person-kilometers |
9299.1 |
6.3 | ||
|
Waterways |
100 million person-kilometers |
67.1 |
1.3 | ||
|
Civil aviation |
100 million person-kilometers |
2044.9 |
14.7 | ||
|
|
|
|
|
|
|
The volume of freight handled by ports throughout the country totaled 4.9 billion tons, up 17.7 percent over the previous year, of which, freight for foreign trade accounted for 1.36 billion tons, up 18.0 percent.
The total number of motor vehicles for civilian use (including 11.49 million tri-wheel cars and low-speed trucks) reached 43.29 million by the end of 2005, up 20.6 percent, of which, private-owned vehicles numbered 23.65 million, up 22.0 percent.
The turnover of post and telecommunication services totaled 1,219.9 billion yuan, up 24.6 percent over the previous year. Of this total, post services accounted for 62.4 billion yuan, up 10.1 percent, and telecommunication services 1,157.5 billion yuan, up 25.4 percent. By the end of 2005, with 46.08 million newly installed lines of office switchboards, the total capacity reached 470 million lines. The year also saw 38.68 million new fixed telephone subscribers to bring the total number to 350.43 million by the end of the year. This included 239.77 million urban subscribers and 110.66 million rural subscribers. Mobile phone users numbered 393.43 million by the end of 2005, with 58.6 million new subscribers. In total, the number of fixed and mobile phone users reached 743.86 million, an increase of 97.28 million as compared with at the end of 2004. On average, phone coverage rate is 57 sets per 100 Chinese population.
Figure 8: Number of Phone Subscribers in the 10th Five-year Plan Period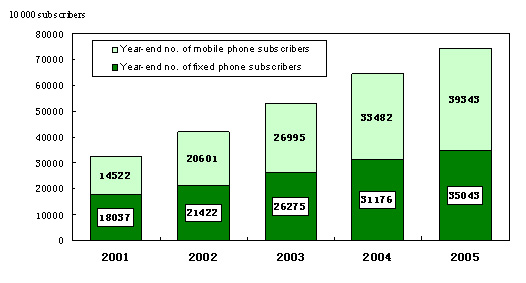
In 2005, the number of inbound visitors to
VIII. Banking, Securities and Insurance
By the end of 2005, money supply of broad sense (M2) was 29.9 trillion yuan, reflecting a year-on-year increase of 17.6 percent. Money supply of narrow sense (M1) was 10.7 trillion yuan, up 11.8 percent. Cash in circulation (M0) was 2.4 trillion yuan, up 11.9 percent. Savings deposit in Renminbi and foreign currencies in all items in financial institutions totaled 30.0 trillion yuan at the end of 2005, up 18.2 percent. Loans in Renminbi and foreign currencies in all items in financial institutions reached 20.7 trillion yuan, up 12.8 percent (Table 11).
|
Table 11: Savings Deposit and Loans in RMB and Foreign Currencies in All Financial Institutions in 2005 | ||||
|
| ||||
|
Unit: 100 million yuan | ||||
|
Item |
Year-end figure |
Increase over 2004 (%) | ||
|
|
|
|
|
|
|
Savings deposit |
300209 |
18.2 | ||
|
Of which: By enterprises |
101751 |
13.8 | ||
|
By urban and rural households |
147054 |
16.5 | ||
|
Of which: Deposits in RMB |
141051 |
18.0 | ||
|
Loans |
206838 |
12.8 | ||
|
Of which: Short-term |
91157 |
6.5 | ||
|
Medium and long-term |
92941 |
16.2 | ||
|
|
|
|
|
|
Figure 9: Urban and Rural Households’ Savings Deposit in RMB and Growth in the 10th Five-year Plan Period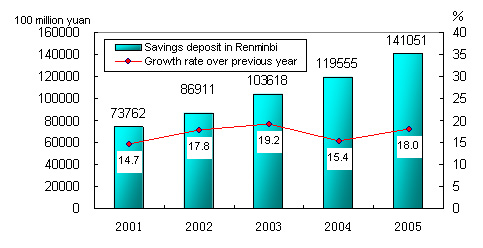
Loans in Renminbi from rural financial cooperation institutions (i.e. rural credit cooperatives, rural cooperation banks, and rural commercial banks) stood at 2.2 trillion yuan, an increase of 345.1 billion yuan as compared with the end of 2004. The loans in Renminbi for consumption use in all financial institutions totaled 2.2 trillion yuan, an increase of 199.6 billion yuan. Of all consumption loans, those for individual housing totaled 1.84 trillion yuan, an increase of 244.4 billion yuan.
Funds raised through issuing stocks and share rights on stock market amounted to 188.3 billion yuan, an increase of 36.3 billion yuan over the previous year. Of this total, 20 companies issued A shares (including newly issued and convertible loan stocks) and another 2 companies issued A share rights, receiving 33.8 billion yuan worth of capital, a decrease of 49.8 billion yuan over 2004. The issue of 24 H shares raised another 154.5 billion yuan worth of capital, an increase of 88.7 billion yuan. The number of listed companies (with A or B shares) on China stock market rose from 1,377 at the end of 2004 to 1,381 at the end of 2005, representing 3,243 billion yuan worth of market value, a shrink of 12.5 percent over the previous year. Corporate bonds with maturity at one year or longer issued throughout the year totaled 65.4 billion yuan, an increase of 33.2 billion yuan over 2004.
The premium of insurance companies totaled 492.7 billion yuan, up 14.0 percent over the previous year. Of this total, life insurance premium earnings amounted to 324.4 billion yuan, health and casualty insurance premium earnings 45.3 billion yuan, and property insurance premium earnings 123 billion yuan. Insurance companies paid an indemnity worth of 113 billion yuan, of which, life insurance indemnity was 30.7 billion yuan, health and casualty insurance indemnity 15.1 billion yuan, and property insurance indemnity 67.2 billion yuan.
IX. Education, Science and Technology
In 2005, the general tertiary education enrollment was 15.62 million students, including 5.05 million new enrollment, and 3.07 million graduates. Senior secondary schools had 24.09 million enrolled students, including 8.78 million new entrants, and 6.62 million graduates. The country had a primary education enrollment of 108.64 million students, including 16.72 million new entrants, and 20.2 million graduates (Table 12).
|
Table 12. Education Attainment in the 10th Five-year Plan Period | ||||||||
|
| ||||||||
|
Unit: 10 000 persons | ||||||||
|
Item |
New enrollment in 2005 |
Total enrollment in 2005 |
Total number of gradates in 2001-2005 |
| ||||
|
Of which: in 2005 | ||||||||
|
|
|
|
|
|
|
|
|
|
|
Postgraduates |
37 |
98 |
60 |
19 | ||||
|
General tertiary education |
505 |
1562 |
971 |
307 | ||||
|
Secondary vocational education |
647 |
1559 |
1919 |
403 | ||||
|
Senior secondary education |
878 |
2409 |
2391 |
662 | ||||
|
Junior secondary education |
1988 |
6215 |
9864 |
2123 | ||||
|
Primary education |
1672 |
10864 |
11171 |
2020 | ||||
|
Special education |
4.9 |
36 |
23 |
4.3 | ||||
|
Pre-school education |
1356 |
2179 |
5470 |
1025 | ||||
|
|
|
|
|
|
|
|
|
|
Expenditure on research and development activities (R&D) was worth 236.7 billion yuan, up 20.4 percent over 2004, accounting for 1.30 percent of GDP. Of this total, 13.5 billion yuan was appropriated for fundamental research programs. The number of technical staff in all fields in state-owned enterprises and institutions stood at 27.2 million at the end of 2005. Some 288 projects under the National Key Technology Research and Development Program and 911 projects under the Hi-tech Research and Development Prog
By the end of 2005, there were altogether 18,932 laboratories for product inspection, including 293 national inspection centers. There were 177 institutions for certification of product quality systems, which accumulatively certified products in 47,000 enterprises. A total of 4,037 authorized measurement institutions enforced compulsory inspection on 34.91 million measurement instruments. Some 1,304 national standards were developed or revised in the year, including 673 new standards. The country has 9,881 meteorology observatories, including 7,246 automatic observatories; 258 radar monitor observatories, and 440 satellite cloud map receiving stations. There are 1,253 seismological monitor stations and 31 seismological remote monitor network stations. The number of oceanic observation and monitor spots reached 8,376. Mapping departments published 1,667 maps and 497 mapping books.
X. Culture, Public Health and Sports
At the end of 2005, there were 2,577 art-performing groups, 2,868 culture centers, 2,736 public libraries, 1,556 museums, 273 radio broadcasting stations, 302 television stations and 50 educational television stations throughout China. Subscribers to cable television programs and digital cable television services numbered 125.69 million and 4.13 million respectively. Radio broadcasting and television broadcasting coverage rates were 94.5 percent and 95.8 percent respectively. The country produced 260 feature movies, 42 science, educational, documentary and cartoon movies and 14 special movies in the year. A total of 40.4 billion copies of newsp
By the end of 2005, there were 300,000 health institutions in China, including 60,000 general hospitals and health centers, 2,964
In 2005, Chinese athletes won 106 world championships on 22 sports events at world championships or world cup games. Eight athletes and 2 teams broke 15 world records on 21 occasions. The national Fit-Keeping Program witnessed more vigorous development.
XI. Population, Living Conditions and Social Security
By the end of 2005, the total number of Chinese population reached 1,307.56 million, an increase of 7.68 million over the previous year (Table 13). The year 2005 saw 16.17 million births, a crude birth rate of 12.40 per thousand, and 8.49 million deaths, or a crude death rate of 6.51 per thousand. The natural growth rate was 5.89 per thousand.
|
Table 13: Composition of Population in 2005 | |||||
|
| |||||
|
Unit: 10,000 persons | |||||
|
|
Population (Year-end figure) |
Percentage (%) | |||
|
|
|
|
|
| |
|
National Total |
130756 |
100.0 | |||
|
Of which: |
Urban |
56212 |
43.0 | ||
|
|
Rural |
74544 |
57.0 | ||
|
Of which: |
Male |
67375 |
51.5 | ||
|
|
Female |
63381 |
48.5 | ||
|
Of which: |
0-14 years |
26504 |
20.3 | ||
|
|
15-64 years |
94197 |
72.0 | ||
|
|
65 years and over |
10055 |
7.7 | ||
|
|
|
|
|
|
|
The annual per capita net income of rural households was 3,255 yuan, or a real increase of 6.2 percent after price factors are considered. The annual per capita disposable income of urban households was 10,493 yuan, a real increase of 9.6 percent. The Engel coefficient (which refers to the proportion of expenditure on food to the total expenditure of households) was 45.5 percent for rural households and 36.7 percent for urban households. The population in absolute poverty in rural areas (with annual per capita net income below 683 yuan) numbered 23.65 million at the end of 2005, a decline of 2.45 million over the previous year. The low-income population in rural areas (with annual per capita net income between 684 and 944 yuan) numbered 40.67 million, a decline of 9.1 million.
|
Table 14: Improvement of Living Conditions in the 10th Five-year Plan Period | ||||||
|
| ||||||
|
Item |
Unit |
2001 |
2002 |
2003 |
2004 |
2005 |
|
|
|
|
|
|
|
|
|
Per capita disposable income of urban households |
yuan |
6860 |
7703 |
8472 |
9422 |
10493 |
|
Per capita net income of rurall households |
yuan |
2366 |
2476 |
2622 |
2936 |
3255 |
|
Engel coefficient in urban areas |
% |
38.2 |
37.7 |
37.1 |
37.7 |
36.7 |
|
Engle coefficient in rural areas |
% |
47.7 |
46.2 |
45.6 |
47.2 |
45.5 |
|
|
|
|
|
|
|
|
By the end of 2005, 174.44 million people participated in basic pension programs, a year-on-year increase of 10.91 million. Of this total, 130.82 million were staff and workers, and 43.62 million were retirees. A total of 137.09 million people participated in urban basic health insurance programs, an increase of 13.05 million, of whom, 99.59 million were staff and workers, 37.5 million were retirees. About 106.48 million people participated in unemployment insurance programs, an increase of 640,000. Some 83.9 million people participated in work accident insurance, an increase of 15.45 million.
All of the 40.02 million enterprise retirees participating in basic pension programs received full pensions on time by the end of the year. All of the laid-off workers registering in re-employment centers received their full subsistence allowances on time, and their social security payment was paid by the centers. The number of people receiving unemployment insurance payment stood at 3.62 million. Some 22.33 million urban residents received the government minimum living allowance, or 278,000 more than the previous year.
Social welfare institutions of various types provided 1.5 million beds by the end of 2005, accommodating 1.16 million inmates. There were 170,000 community service facilities in urban areas, including 9,705 comprehensive community service centers. Some 41.1 billion yuan worth of social welfare lottery tickets were sold, raising about 14.4 billion yuan of social welfare funds. Another 2.9 billion yuan were received from direct donations.
XII. Resources, Environment and Work Safety
Some 139,000 hectares of cultivated land were used for construction purpose, or 4.1 percent less as compared with the previous year. Another 54,000 hectares of cultivated land were destroyed by disasters. A total of 390,000 hectares of farmland were converted into land for ecological preservation. Structural adjustment to agriculture led to a reduction of 12,000 hectares of cultivated land. Non-reported use of 73,000 hectares farmland for construction purposes from previous years was revealed in 2005. Land reclamation and re-development programs added over 307,000 hectares of cultivated land. As a result, the year 2005 witnessed a net reduction of 362,000 hectares of cultivated land.
Total stock of water resources in 2005 was 2,743 billion cubic meters, or 2,098 cubic meters in per capita terms, representing a year-on-year rise of 13.7 percent a
National land surveys and geological explorations discovered a total of 169 new mineral deposits in large or medium size, including 40 energy mineral deposits, 58 metallic mineral mines, 64 non-metallic mineral mines and 7 water or gas mineral deposits. Increased reserves were found for 72 minerals, including 943 million tons of crude oil, 526.3 billion cubic meters of natural gas and 69.8 billion tons of coal.
A total of 6.37 million hectares of forest were planted, of which, 5.43 million were completed through 6 key afforestation projects, accounting for 85.2 percent of the total planted area of the year. Some 166 national ecological demonstration zones were approved. The number of natural reserves reached 2,349, of which 243 are natio
Preliminary estimation indicated that the total energy consumption in 2005 amounted to 2.22 billion tons of standard coal equivalent, up 9.5 percent over 2004. Of this total, consumption of coal was 2.14 billion tons, up 10.6 percent, consumption of crude oil was 300 million tons, up 2.1 percent, that of natural gas 50 billion cubic meters, up 20.6 percent, that of hydro-electric power 401 billion kilowatt hours, up 13.4 percent, and that of nuclear power 52.3 billion kilowatt hours, up 3.7 percent. Consumption of major raw materials include: 400 million tons of rolled steel, up 20.1 percent; 15.61 million tons of aluminum oxide, up 21.7 percent; and 1.05 billion tons of cement, up 9.0 percent. Energy consumption for producing 10,000 yuan worth of GDP was 1.43 tons of standard coal equivalent, maintaining the same level of 2004.
Figure 10: Total energy consumption in the 10th Five-year Plan Period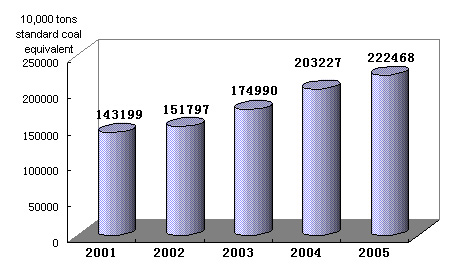
Monitoring of water quality on 411 sections of the 7 major water systems in China showed that 41 percent of the sections met the national quality standard of Grade III for surface water, down by 1 percentage point over the previous year; 32 percent of the sections met the quality standard of Grade IV or V, up 2 percentage points; and 27 percent were below Grade V, down by 1 percentage point.
Monitoring of oceanic water quality at 293 offshore monitoring stations indicated that oceanic water met the national quality standard Grade I and II in 67.3 percent of the stations, up 17.7 percentage points from the previous year; water at 8.9 percent of the stations met Grade III standard, down by 6.5 percentage points; and water with Grade IV or inferior quality was found in 23.8 percent of the stations, down by 11.0 percentage points. A total of 139,000 square kilometers of oceanic water did not meet the quality standard for clean oceanic water, down by 17.8 percent. Of this total, seriously polluted oceanic area occupied 29,000 square kilometers. Monitoring of 18 marine ecology monitoring zones showed that major thalassic, estuarine and wetlands ecosystem were all in quasi-healthy or unhealthy conditions.
In the 523 cities covered by air quality monitoring program, 344 cities reached air quality standard Grade II, accounting for 65.8 percent of all cities under the program; and 133 cities attained Grade III, accounting for 25.4 percent. Air quality in 46 cities was inferior to Grade III, accounting for 8.8 percent. Of the 350 cities subject to noise monitoring program, 0.9 percent of cities suffered serious noise pollution in downtown areas, 1.7 percent experienced medium noise pollution and 33.1 percent had light noise pollution.
The daily treatment capacity of municipal sewage reached 80.91 million cubic meters, up 9.5 percent. Municipal sewage treatment rate was 48.4 percent, up 2.8 percentage points. Areas benefiting from central heating systems amounted to 2.2 billion square meters, up 3.2 percent. Vegetation coverage rate in built-up areas reached 33.0 percent, up 1.4 percentage points.
In 2005, natural disasters caused 204.2 billion yuan worth of direct economic loss, up 27.4 percent. Natural disasters hit 38.82 million hectares of crops, up 4.6 percent, of which, 4.6 million hectares of crops were demolished, up 5.4 percent. Three extra big forest fires in 2005 hit 73,000 hectares of forest, a drop of 48.4 percent. Oceanic disasters caused a direct economic loss of 33.2 billion yuan, 6.1 times that of 2004. The occurrence of 82 red tides in the year (14 times less than in 2004) hit an accumulative area of 27,070 square kilometers, up 1.7 percent.
Death toll from work accidents amounted to 127,000 people, a year-on-year decrease of 7.1 percent. Death toll from work accidents per 100 million yuan worth of GDP was 0.70 person, a decline of 18.5 percent. Work accidents in industrial, mining, trade enterprises caused 3.85 deaths per 100,000 employees, down 6.8 percent; death toll for producing one million tons of coal in coal mines was 2.81 persons, down 8.7 percent. The year 2005 witnessed 450,254 traffic accidents, claiming 99,000 lives, injuring 470,000 people and causing a direct property loss of 1.88 billion yuan. Death toll per 10,000 vehicles was 7.60 persons, down by 23.7 percent.
Notes:
1. All figures in this Communiqué are preliminary statistics.
2. Statistics in this Communiqué do not include Hong Kong SAR, Macao SAR and
3. Gross domestic product (GDP) and value-added in value terms as quoted in this Communiqué are calculated at current prices, whereas their growth rates are calculated at comparable prices.
4. Fruit production in Table 2 includes melons and gourds consumed as fruits.
5. Output and consumption of rolled steel include duplicated counting of rolled steel as intermediate input used for producing other types of rolled steel.
6. Import and export figures by type of trade in Table 6 include, in addition to general trade and processing trade, other types of trade, such as merchandise for transit in bonded warehouses, small-scale trade across borders, import of equipment as component of FDI by foreign invested enterprises, etc.
7. Turnover of post and telecommunication services is calculated at constant prices of 2000.
8. Number of telephones connected to switchboards is counted in the calculation of phone coverage rate.
9. Six key afforestation projects are: project on protection of natural forest resources, grain for green project, project on treatment of sources of sand in Beijing and Tianjin, project on planting of key shelterbelts in north-east, north-west and north China and in the middle and lower reaches of Yangtze River, project on protection of wild flora and fauna and construction of natural reserves, and project on construction of timber bases of fast-growing woods in key areas.
10. Consumption of water and energy for producing 10,000 yuan worth of GDP is calculated at 2000 constant prices.
11. Seven key water systems are: