Energy Production in October 2022
In October, the production of raw coal, crude oil, natural gas and electric power of industries above designated size kept a year-on-year growth. Compared with September, the growth rate of the production of raw coal slowed down, crude oil and natural gas accelerated, and power production changed from decreasing to increasing.
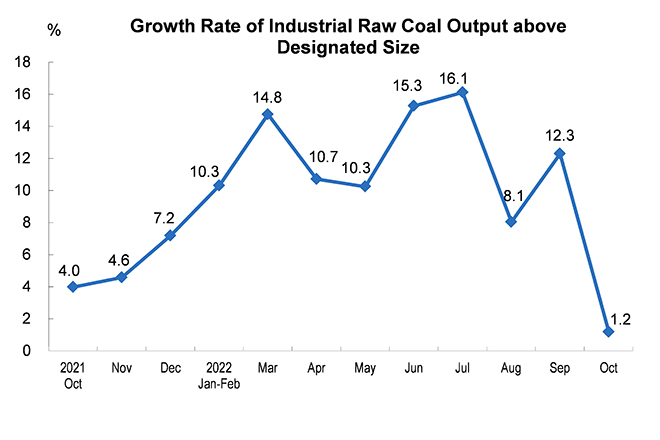
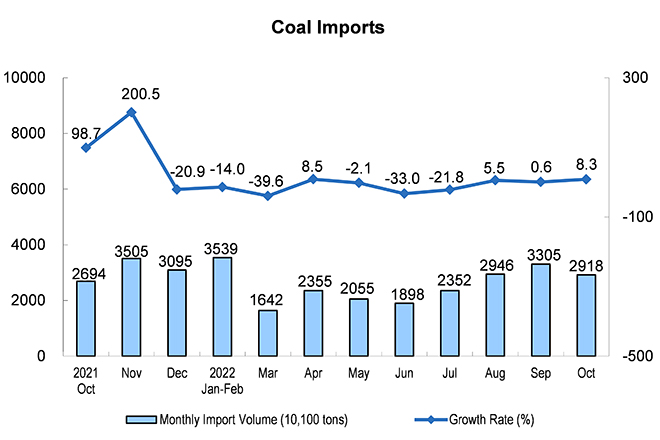
The growth rate of raw coal production slowed down, and the growth rate of import was accelerated. In October, 370 million tons of raw coal were produced, a year-on-year increase of 1.2 percent, 11.1 percentage point lower than that of the previous month, and the average daily output was 11.94 million tons. The import of coal was 29.18 million tons, a year-on-year increase of 8.3 percent, 7.7 percentage points faster than the previous month.
From January to October, 3.69 billion tons of raw coal were produced, a year-on-year increase of 10.0 percent. The imported coal was 230 million tons, a year-on-year decrease of 10.5 percent.
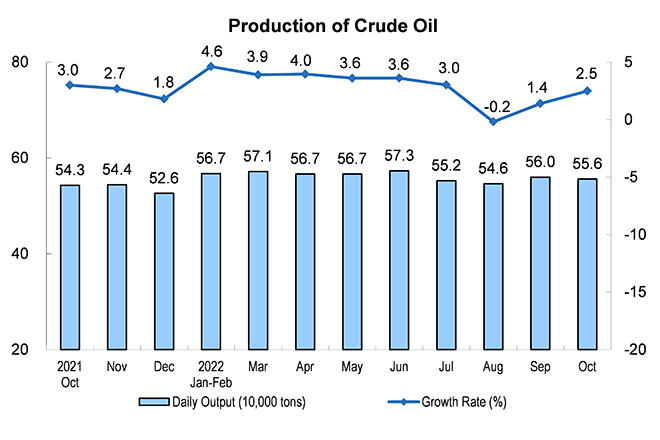
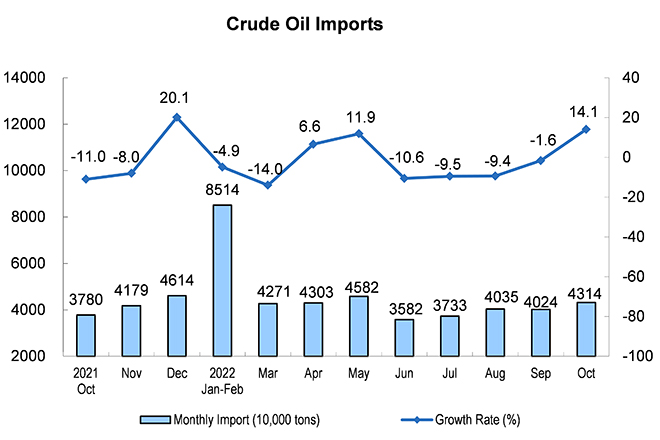
Crude oil production increased steadily, and the import changed from decreasing to increasing. In October, it produced 17.22 million tons of crude oil, a year-on-year increase of 2.5 percent, 1.1 percentage point faster than the previous month, and the average daily output was 556,000 tons. The import of crude oil was 43.14 million tons, a year-on-year increase of 14.1 percent, a decrease of 1.6 percent in the previous month.
From January to October, it produced 170.98 million tons of crude oil, a year-on-year increase of 3.0 percent. The import of crude oil was 413.53 million tons, a year-on-year decrease of 2.7 percent.
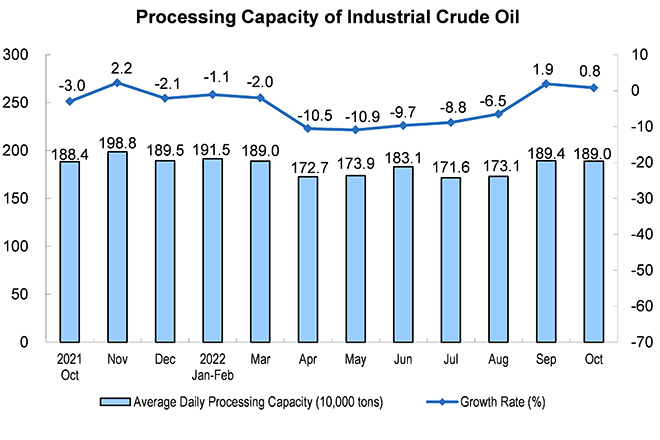
The growth of crude oil processing volume slowed down. In October, 58.62 million tons of crude oil were processed, a year-on-year increase of 0.8 percent, 1.1 percentage point lower than that of the previous month, and the average daily processing was 1.891 million tons. From January to October, 555.88 million tons of crude oil were processed, a year-on-year decrease of 4.5 percent.
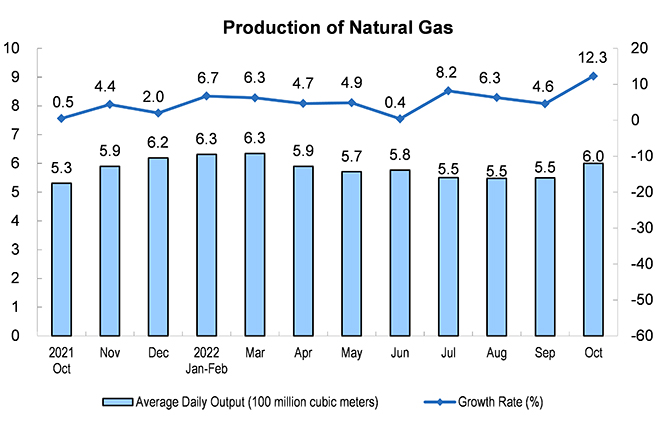
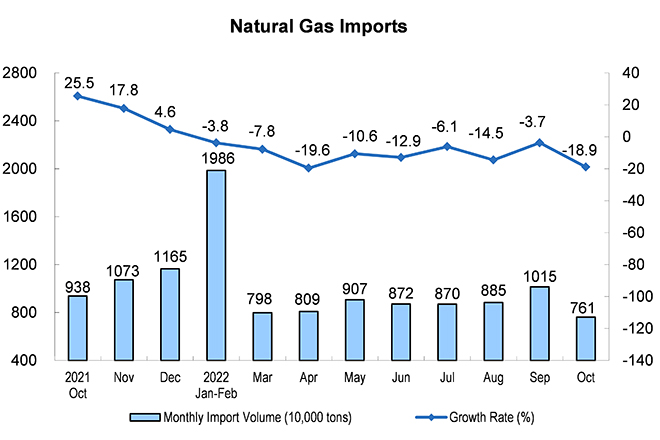
The growth rate of natural gas production was accelerated, and the decrease in imports was enlarged. In October, it produced 18.5 billion cubic meters of natural gas, a year-on-year increase of 12.3 percent, 7.7 percentage points faster than last month, and the average daily output was 600 million cubic meters. The import of natural gas was 7.61 million tons, a year-on-year decrease of 18.9 percent, a decrease of 15.2 percentage points enlarged from the previous month.
From January to October, 178.5 billion cubic meters of natural gas were produced, a year-on-year increase of 6.0 percent. The imported natural gas was 88.74 million tons, a year-on-year decrease of 10.4 percent.
II. Electric Power Production
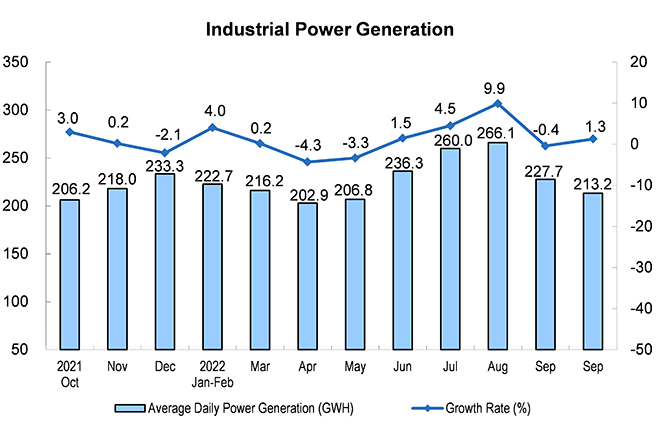
The power production changed from decreasing to increasing. In October, the power generation was 661 billion kwh, a year-on-year increase of 1.3 percent, a decrease of 0.4 percent in the previous month, and the average daily power generation was 21.32 billion kwh. From January to October, the power generation was 7.0 trillion kwh, a year-on-year increase of 2.2 percent.
From the perspective of varieties, in October, the growth of thermal power slowed down, the decline of hydropower narrowed, nuclear power changed from decreasing to increasing, and the wind power and solar power kept a rapid increase. Among them, thermal power increased by 3.2 percent year-on-year, 2.9 percentage points slower than last month; hydropower decreased by 17.7 percent, 12.3 percentage points lower than last month; Among them, nuclear power increased by 7.4 percent year-on-year and decreased by 2.7 percent last month; wind power increased by 19.2 percent; solar power generation increased by 24.7 percent.
Annotations:
1. Explanatory Notes
Average daily product output: It is calculated by dividing the total output of Industrial Enterprises above the designated size announced in that month by the calendar days of that month.
2. Statistical Coverage
The statistical caliber of the output data in the report is above the designated size of industry, and the statistical scope is industrial enterprises with annual main business income of more than 20 million yuan.
Because the scope of Industrial Enterprises above the designated size changes every year, in order to ensure that this year's data is comparable with the previous year's, the same period used to calculate the growth rate of various indicators such as product output is consistent with the statistical scope of enterprises in this period, and there is a caliber difference between the data released last year.
3. Data Source
Import data comes from the General Administration of Customs, of which October data are express data.
4. Conversion relationship of natural gas units: 1 ton is equal to 1380 cubic meters.