Households' Income and Consumption Expenditure in the First Half Year of 2022
I. Households' Income
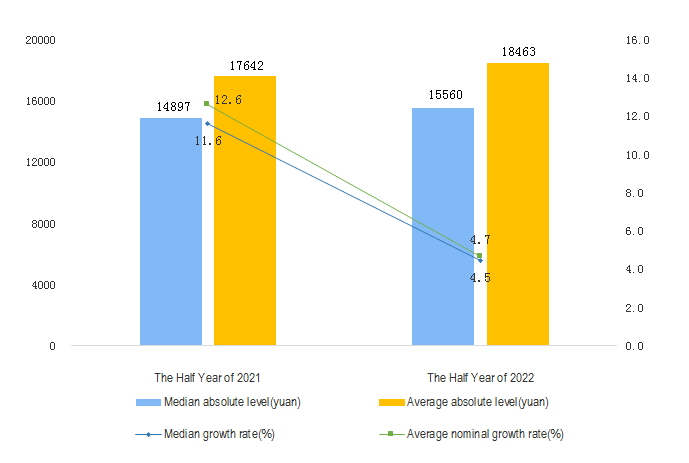
In the first half of the year, the per capita disposable income of residents nationwide was 18,463 yuan, a nominal increase of 4.7 percent over the same period last year, and a real increase of 3.0 percent after deducting price factors. In terms of urban and rural areas, the per capita disposable income of urban residents was 25,003 yuan, an increase of 3.6 percent (unless otherwise specified below, it was a year-on-year nominal increase), and the actual increase was 1.9 percent after deducting price factors; the per capita disposable income of rural residents was 9,787 yuan, an increase of 5.8 percent. After deducting price factors, the actual increase was 4.2 percent.
In the first half of the year, the median per capita disposable income of residents nationwide was 15,560 yuan, an increase of 4.5 percent, and the median was 84.3 percent of the average. Among them, the median per capita disposable income of urban residents was 22,324 yuan, an increase of 3.8 percent, and the median was 89.3 percent of the average; the median per capita disposable income of rural residents was 8,410 yuan, an increase of 5.7 percent, and the median was 85.9 percent of the average.
According to the source of income, in the first half of the year, the per capita wage income of residents nationwide was 10,576 yuan, an increase of 4.7 percent, accounting for 57.3 percent of disposable income; the per capita net operating income was 2,841 yuan, an increase of 3.2 percent, accounting for 15.4 percent of disposable income; the per capita net property income was 1,665 yuan, an increase of 5.2 percent, accounting for 9.0 percent of disposable income; the per capita net transfer income was 3,382 yuan, an increase of 5.6 percent, accounting for 18.3 percent of disposable income.
The Average and median per capita disposable income in the first half of 2022
II. Consumption Expenditure of Households
In the first half of the year, the per capita consumption expenditure of residents nationwide was 11,756 yuan, a nominal increase of 2.5 percent over the same period of the previous year. After deducting the impact of price factors, the actual increase was 0.8 percent. In terms of urban and rural areas, the per capita consumption expenditure of urban residents was 14,677 yuan, an increase of 0.8 percent, and after deducting price factors, the actual decline was 0.9 percent; the per capita consumption expenditure of rural residents was 7,881 yuan, an increase of 5.6 percent. After deducting price factors, the actual growth was 4.0 percent.
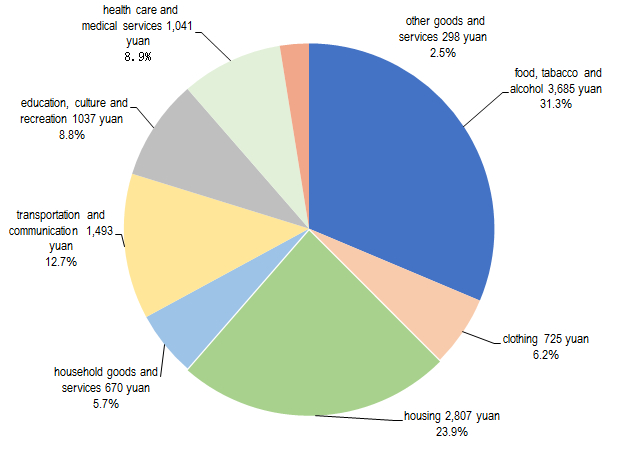
In the first half of the year, the national per capita consumption expenditure on food, tobacco and alcohol was 3,685 yuan, an increase of 4.2 percent, accounting for 31.3 percent of the per capita consumption expenditure; per capita clothing consumption expenditure was 725 yuan, down 2.3 percent, accounting for 6.2 percent of per capita consumption expenditure; the per capita living consumption expenditure was 2,807 yuan, an increase of 6.0 percent, accounting for 23.9 percent of the per capita consumption expenditure; the per capita consumption expenditure on household goods and services was 670 yuan, an increase of 0.1 percent, accounting for 5.7 percent of the per capita consumption expenditure; the per capita consumption expenditure of transportation and communication was 1,493 yuan, an increase of 2.6 percent, accounting for 12.7 percent of the per capita consumption expenditure; the per capita consumption expenditure on education, culture and entertainment was 1,037 yuan, down 7.4 percent, accounting for 8.8 percent of the per capita consumption expenditure; the per capita consumption expenditure on health care was 1,041 yuan, an increase of 2.6 percent, accounting for 8.9 percent of the per capita consumption expenditure; the per capita consumption expenditure on other goods and services was 298 yuan, an increase of 4.5 percent, accounting for 2.5 percent of the per capita consumption expenditure.
Per capita consumption expenditure and composition in the first half of 2022
|
Table 1 Income and Expenditure Nationwide in the First Half Year of 2022
|
|
||||||||||||||||||||||||||||||||||||||||||||||||||||||||||||||||||||||||||||||||||||||||||||||||||||||||||||||||||||||||||||||||||||||||||||||||||||||||||||||||||||||||||||||||||||||||||||||||||||||||||||||||||||||||||||||||||
|
Item |
Absolute Value ( yuan) |
Y/Y(%) Actual Growth in Brackets |
|
||||||||||||||||||||||||||||||||||||||||||||||||||||||||||||||||||||||||||||||||||||||||||||||||||||||||||||||||||||||||||||||||||||||||||||||||||||||||||||||||||||||||||||||||||||||||||||||||||||||||||||||||||||||||||||||||
|
|
|
|
|
|
|
||||||||||||||||||||||||||||||||||||||||||||||||||||||||||||||||||||||||||||||||||||||||||||||||||||||||||||||||||||||||||||||||||||||||||||||||||||||||||||||||||||||||||||||||||||||||||||||||||||||||||||||||||||||||||||||
|
Total Per Capita Income Nationwide |
18463 |
4.7(3.0) |
|||||||||||||||||||||||||||||||||||||||||||||||||||||||||||||||||||||||||||||||||||||||||||||||||||||||||||||||||||||||||||||||||||||||||||||||||||||||||||||||||||||||||||||||||||||||||||||||||||||||||||||||||||||||||||||||||
|
Grouped by Permanent Residence |
|
|
|||||||||||||||||||||||||||||||||||||||||||||||||||||||||||||||||||||||||||||||||||||||||||||||||||||||||||||||||||||||||||||||||||||||||||||||||||||||||||||||||||||||||||||||||||||||||||||||||||||||||||||||||||||||||||||||||
|
Urban Households |
25003 |
3.6(1.9) |
|||||||||||||||||||||||||||||||||||||||||||||||||||||||||||||||||||||||||||||||||||||||||||||||||||||||||||||||||||||||||||||||||||||||||||||||||||||||||||||||||||||||||||||||||||||||||||||||||||||||||||||||||||||||||||||||||
|
Rural Households |
9787 |
5.8(4.2) |
|||||||||||||||||||||||||||||||||||||||||||||||||||||||||||||||||||||||||||||||||||||||||||||||||||||||||||||||||||||||||||||||||||||||||||||||||||||||||||||||||||||||||||||||||||||||||||||||||||||||||||||||||||||||||||||||||
|
Grouped by Income Source |
|
|
|||||||||||||||||||||||||||||||||||||||||||||||||||||||||||||||||||||||||||||||||||||||||||||||||||||||||||||||||||||||||||||||||||||||||||||||||||||||||||||||||||||||||||||||||||||||||||||||||||||||||||||||||||||||||||||||||
|
Income of Wages and Salaries |
10576 |
4.7 |
|||||||||||||||||||||||||||||||||||||||||||||||||||||||||||||||||||||||||||||||||||||||||||||||||||||||||||||||||||||||||||||||||||||||||||||||||||||||||||||||||||||||||||||||||||||||||||||||||||||||||||||||||||||||||||||||||
|
Net Business Income |
2841 |
3.2 |
|||||||||||||||||||||||||||||||||||||||||||||||||||||||||||||||||||||||||||||||||||||||||||||||||||||||||||||||||||||||||||||||||||||||||||||||||||||||||||||||||||||||||||||||||||||||||||||||||||||||||||||||||||||||||||||||||
|
Net Income from Property |
1665 |
5.2 |
|||||||||||||||||||||||||||||||||||||||||||||||||||||||||||||||||||||||||||||||||||||||||||||||||||||||||||||||||||||||||||||||||||||||||||||||||||||||||||||||||||||||||||||||||||||||||||||||||||||||||||||||||||||||||||||||||
|
Net Income from Transfer |
3382 |
5.6 |
|||||||||||||||||||||||||||||||||||||||||||||||||||||||||||||||||||||||||||||||||||||||||||||||||||||||||||||||||||||||||||||||||||||||||||||||||||||||||||||||||||||||||||||||||||||||||||||||||||||||||||||||||||||||||||||||||
|
Total Per Capita Income Nationwide Median |
15560 |
4.5 |
|||||||||||||||||||||||||||||||||||||||||||||||||||||||||||||||||||||||||||||||||||||||||||||||||||||||||||||||||||||||||||||||||||||||||||||||||||||||||||||||||||||||||||||||||||||||||||||||||||||||||||||||||||||||||||||||||
|
Grouped by Permanent Residence |
|
|
|||||||||||||||||||||||||||||||||||||||||||||||||||||||||||||||||||||||||||||||||||||||||||||||||||||||||||||||||||||||||||||||||||||||||||||||||||||||||||||||||||||||||||||||||||||||||||||||||||||||||||||||||||||||||||||||||
|
Urban Households |
22324 |
3.8 |
|||||||||||||||||||||||||||||||||||||||||||||||||||||||||||||||||||||||||||||||||||||||||||||||||||||||||||||||||||||||||||||||||||||||||||||||||||||||||||||||||||||||||||||||||||||||||||||||||||||||||||||||||||||||||||||||||
|
Rural Households |
8410 |
5.7 |
|||||||||||||||||||||||||||||||||||||||||||||||||||||||||||||||||||||||||||||||||||||||||||||||||||||||||||||||||||||||||||||||||||||||||||||||||||||||||||||||||||||||||||||||||||||||||||||||||||||||||||||||||||||||||||||||||
|
Total Per Capita Expenditure Nationwide |
11756 |
2.5(0.8) |
|||||||||||||||||||||||||||||||||||||||||||||||||||||||||||||||||||||||||||||||||||||||||||||||||||||||||||||||||||||||||||||||||||||||||||||||||||||||||||||||||||||||||||||||||||||||||||||||||||||||||||||||||||||||||||||||||
|
Grouped by Permanent Residence |
|
|
|||||||||||||||||||||||||||||||||||||||||||||||||||||||||||||||||||||||||||||||||||||||||||||||||||||||||||||||||||||||||||||||||||||||||||||||||||||||||||||||||||||||||||||||||||||||||||||||||||||||||||||||||||||||||||||||||
|
Urban Households |
14677 |
0.8(-0.9) |
|||||||||||||||||||||||||||||||||||||||||||||||||||||||||||||||||||||||||||||||||||||||||||||||||||||||||||||||||||||||||||||||||||||||||||||||||||||||||||||||||||||||||||||||||||||||||||||||||||||||||||||||||||||||||||||||||
|
Rural Households |
7881 |
5.6(4.0) |
|||||||||||||||||||||||||||||||||||||||||||||||||||||||||||||||||||||||||||||||||||||||||||||||||||||||||||||||||||||||||||||||||||||||||||||||||||||||||||||||||||||||||||||||||||||||||||||||||||||||||||||||||||||||||||||||||
|
Grouped by Consumption Category |
|
|
|||||||||||||||||||||||||||||||||||||||||||||||||||||||||||||||||||||||||||||||||||||||||||||||||||||||||||||||||||||||||||||||||||||||||||||||||||||||||||||||||||||||||||||||||||||||||||||||||||||||||||||||||||||||||||||||||
|
Food, tobacco and liquor |
3685 |
4.2 |
|||||||||||||||||||||||||||||||||||||||||||||||||||||||||||||||||||||||||||||||||||||||||||||||||||||||||||||||||||||||||||||||||||||||||||||||||||||||||||||||||||||||||||||||||||||||||||||||||||||||||||||||||||||||||||||||||
|
Clothing |
725 |
-2.3 |
|||||||||||||||||||||||||||||||||||||||||||||||||||||||||||||||||||||||||||||||||||||||||||||||||||||||||||||||||||||||||||||||||||||||||||||||||||||||||||||||||||||||||||||||||||||||||||||||||||||||||||||||||||||||||||||||||
|
Residence |
2807 |
6.0 |
|||||||||||||||||||||||||||||||||||||||||||||||||||||||||||||||||||||||||||||||||||||||||||||||||||||||||||||||||||||||||||||||||||||||||||||||||||||||||||||||||||||||||||||||||||||||||||||||||||||||||||||||||||||||||||||||||
|
Household facilities, articles and services |
670 |
0.1 |
|||||||||||||||||||||||||||||||||||||||||||||||||||||||||||||||||||||||||||||||||||||||||||||||||||||||||||||||||||||||||||||||||||||||||||||||||||||||||||||||||||||||||||||||||||||||||||||||||||||||||||||||||||||||||||||||||
|
Transportation and telecommunication |
1493 |
2.6 |
|||||||||||||||||||||||||||||||||||||||||||||||||||||||||||||||||||||||||||||||||||||||||||||||||||||||||||||||||||||||||||||||||||||||||||||||||||||||||||||||||||||||||||||||||||||||||||||||||||||||||||||||||||||||||||||||||
|
Education, culture and recreation |
1037 |
-7.4 |
|||||||||||||||||||||||||||||||||||||||||||||||||||||||||||||||||||||||||||||||||||||||||||||||||||||||||||||||||||||||||||||||||||||||||||||||||||||||||||||||||||||||||||||||||||||||||||||||||||||||||||||||||||||||||||||||||
|
Health care and medical services |
1041 |
2.6 |
|||||||||||||||||||||||||||||||||||||||||||||||||||||||||||||||||||||||||||||||||||||||||||||||||||||||||||||||||||||||||||||||||||||||||||||||||||||||||||||||||||||||||||||||||||||||||||||||||||||||||||||||||||||||||||||||||
|
Miscellaneous goods and services |
298 |
4.5 |
|||||||||||||||||||||||||||||||||||||||||||||||||||||||||||||||||||||||||||||||||||||||||||||||||||||||||||||||||||||||||||||||||||||||||||||||||||||||||||||||||||||||||||||||||||||||||||||||||||||||||||||||||||||||||||||||||
|
|
|
|
|||||||||||||||||||||||||||||||||||||||||||||||||||||||||||||||||||||||||||||||||||||||||||||||||||||||||||||||||||||||||||||||||||||||||||||||||||||||||||||||||||||||||||||||||||||||||||||||||||||||||||||||||||||||||||||||||
|
Notes:
|
|||||||||||||||||||||||||||||||||||||||||||||||||||||||||||||||||||||||||||||||||||||||||||||||||||||||||||||||||||||||||||||||||||||||||||||||||||||||||||||||||||||||||||||||||||||||||||||||||||||||||||||||||||||||||||||||||||
|
|||||||||||||||||||||||||||||||||||||||||||||||||||||||||||||||||||||||||||||||||||||||||||||||||||||||||||||||||||||||||||||||||||||||||||||||||||||||||||||||||||||||||||||||||||||||||||||||||||||||||||||||||||||||||||||||||||
Annotations:
1.Explanatory Notes
Disposable income of Households refers to the sum of final consumption expenditure and savings that residents can use, that is, the income that residents can use for free disposal, including both cash income and physical income. According to the source of income, disposable income includes wage and salary income, net business income, net property income and net transfer income.
Consumer spending refers to all the expenditures that residents use to meet their daily needs, including both cash and physical consumption. Consumer spending includes eight categories: food, tobacco and alcohol, clothing, housing, daily necessities and services, transportation and communication, education, culture and recreation, medical care and other supplies and services.
The median of the nationwide per capita disposable income of households refers to the per capita disposable income of households which lies in the middle of all surveyed households ranked from low to high on the basis of per capita disposable income level.
The quarterly income and expenditure data do not include the income and consumption of the self-produced and self-used parts of households, and the annual income and expenditure data includes.
2. Survey Methods
The national and sub urban and rural households' income and expenditure data comes from the household income and expenditure and living conditions survey organized and implemented by the National Bureau of Statistics, which is released quarterly.
Using stratified, multi-stage, probability sampling method proportional to the size of population, the National Bureau of Statistics randomly selected 160000 households in 1800 counties (cities, districts) of 31 provinces (regions, cities) as survey households.
According to the unified system and method, the survey organizations directly under the National Bureau of statistics will organize the household to record and collect the data of households' income, expenditure, family operation, production and investment; meanwhile, according to the unified questionnaire, collect other surveys such as the employment of household members and labor force, the ownership of housing and durable consumer goods, and the enjoyment of households' basic social and public services. After the completion of data collection, the municipal and county survey organizations use unified methods and data processing procedures to code, review and input the original investigation data, and then directly transmit the basic household data to the National Bureau of Statistics for unified summary and calculation.
3. Due to the rounding of some data, there are differences between total and subtotal.