Households' Income and Consumption Expenditure in 2021
I. Households' Income
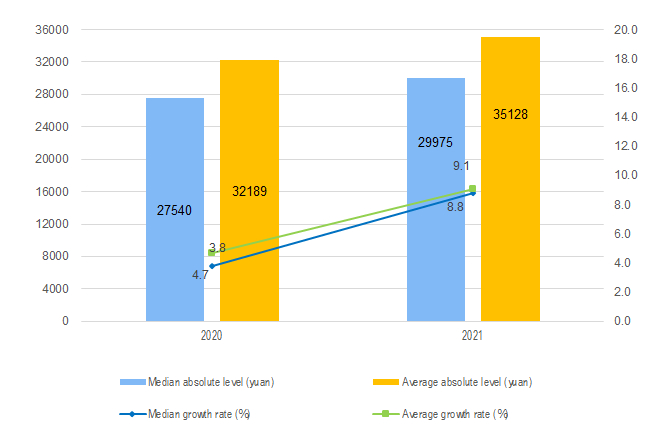
In 2021, the per capita disposable income of residents in China reached 35,128 yuan, a nominal increase of 9.1 percent over the previous year, and a real increase of 8.1 percent after deducting price factors; the growth rate was 14.3 percent higher than that in 2019 (it was the nominal growth rate year-on-year unless otherwise stated). The average growth rate in two years was 6.9 percent. After deducting price factors, the average actual growth rate in two years was 5.1 percent.
In terms of urban and rural areas, the per capita disposable income of urban residents was 47,412 yuan, an increase of 8.2 percent. After deducting price factors, the actual increase was 7.1 percent; the per capita disposable income of rural residents was 18,931 yuan, an increase of 10.5 percent. After deducting price factors, the actual increase was 9.7 percent.
In 2021, the median per capita disposable income of residents in China was 29,975 yuan, an increase of 8.8 percent, and the median was 85.3 percent of the average. Among them, the median per capita disposable income of urban residents was 43,504 yuan, an increase of 7.7 percent, and the median was 91.8 percent of the average; the median per capita disposable income of rural residents was 16,902 yuan, an increase of 11.2 percent, and the median was 89.3 percent of the average.
According to income sources, in 2021, the per capita wage income of residents nationwide was 19,629 yuan, an increase of 9.6 percent, accounting for 55.9 percent of disposable income; the per capita net operating income was 5,893 yuan, an increase of 11.0 percent, accounting for 16.8 percent of disposable income; the per capita net property income was 3,076 yuan, an increase of 10.2 percent, accounting for 8.8 percent of disposable income; the per capita net transfer income was 6,531 yuan, an increase of 5.8 percent, accounting for 18.6 percent of disposable income.
Compared with 2019, the two-year average growth rates of various sources of per capita disposable income of residents in China are as follows: wage income increased by 6.9 percent, net operating income increased by 6.0 percent, net property income increased by 8.4 percent and net transfer income increased by 7.2 percent.
II. Consumption Expenditure of Households
In 2021, the per capita consumption expenditure of national residents was 24,100 yuan, a nominal increase of 13.6 percent over the previous year, and a real increase of 12.6 percent after deducting the influence of price factors; it increased by 11.8 percent over 2019, with an average growth of 5.7 percent in two years. After deducting price factors, the average real growth in two years was 4.0 percent.
In terms of urban and rural areas, the per capita consumption expenditure of urban residents was 30,307 yuan, an increase of 12.2 percent. After deducting price factors, the actual growth was 11.1 percent; the per capita consumption expenditure of rural residents was 15,916 yuan, an increase of 16.1 percent. After deducting price factors, the actual increase was 15.3 percent.
In 2021, the national per capita consumption expenditure on food, tobacco and alcohol was 7,178 yuan, an increase of 12.2 percent, accounting for 29.8 percent of the per capita consumption expenditure; per capita clothing consumption expenditure was 1,419 yuan, an increase of 14.6 percent, accounting for 5.9 percent of per capita consumption expenditure; the per capita residential consumption expenditure was 5,641 yuan, an increase of 8.2 percent, accounting for 23.4 percent of the per capita consumption expenditure; the per capita consumption expenditure on household goods and services was 1,423 yuan, an increase of 13.0 percent, accounting for 5.9 percent of the per capita consumption expenditure; The per capita consumption expenditure on transportation and communication was 3,156 yuan, an increase of 14.3 percent, accounting for 13.1 percent of the per capita consumption expenditure; the per capita consumption expenditure on education, culture and entertainment was 2,599 yuan, an increase of 27.9 percent, accounting for 10.8 percent of the per capita consumption expenditure; the per capita consumption expenditure on health care was 2,115 yuan, an increase of 14.8 percent, accounting for 8.8 percent of the per capita consumption expenditure; the per capita consumption expenditure on other goods and services was 569 yuan, an increase of 23.2 percent, accounting for 2.4 percent of the per capita consumption expenditure.
Compared with 2019, the average growth rate of eight categories of per capita consumption expenditure of residents in China in two years was: food, tobacco and alcohol increased by 8.6 percent, clothing increased by 3.0 percent, residence increased by 5.6 percent, daily necessities and services increased by 5.4 percent, transportation and communication increased by 5.0 percent, education, culture and entertainment increased by 1.7 percent, medical care increased by 5.4 percent, and other supplies and services increased by 4.2 percent.

|
Table 1 Income and Expenditure Nationwide in 2021
|
|
||||||||||||||||||||||||||||||||||||||||||||||||||||||||||||||||||||||||||||||||||||||||||||||||||||||||||||||||||||||||||||||||||||||||||||||||||||||||||||||||||||||||||||||||||||||||||||||||||||||||||||||||||||||||||||
|
Item |
Absolute Value ( yuan) |
Y/Y(%) Actual Growth in Brackets |
|
||||||||||||||||||||||||||||||||||||||||||||||||||||||||||||||||||||||||||||||||||||||||||||||||||||||||||||||||||||||||||||||||||||||||||||||||||||||||||||||||||||||||||||||||||||||||||||||||||||||||||||||||||||||||||
|
|
|
|
|
|
|
||||||||||||||||||||||||||||||||||||||||||||||||||||||||||||||||||||||||||||||||||||||||||||||||||||||||||||||||||||||||||||||||||||||||||||||||||||||||||||||||||||||||||||||||||||||||||||||||||||||||||||||||||||||||
|
Total Per Capita Income Nationwide |
35128 |
9.1(8.1) |
|||||||||||||||||||||||||||||||||||||||||||||||||||||||||||||||||||||||||||||||||||||||||||||||||||||||||||||||||||||||||||||||||||||||||||||||||||||||||||||||||||||||||||||||||||||||||||||||||||||||||||||||||||||||||||
|
Grouped by Permanent Residence |
|
|
|||||||||||||||||||||||||||||||||||||||||||||||||||||||||||||||||||||||||||||||||||||||||||||||||||||||||||||||||||||||||||||||||||||||||||||||||||||||||||||||||||||||||||||||||||||||||||||||||||||||||||||||||||||||||||
|
Urban Households |
47412 |
8.2(7.1) |
|||||||||||||||||||||||||||||||||||||||||||||||||||||||||||||||||||||||||||||||||||||||||||||||||||||||||||||||||||||||||||||||||||||||||||||||||||||||||||||||||||||||||||||||||||||||||||||||||||||||||||||||||||||||||||
|
Rural Households |
18931 |
10.5(9.7) |
|||||||||||||||||||||||||||||||||||||||||||||||||||||||||||||||||||||||||||||||||||||||||||||||||||||||||||||||||||||||||||||||||||||||||||||||||||||||||||||||||||||||||||||||||||||||||||||||||||||||||||||||||||||||||||
|
Grouped by Income Source |
|
|
|||||||||||||||||||||||||||||||||||||||||||||||||||||||||||||||||||||||||||||||||||||||||||||||||||||||||||||||||||||||||||||||||||||||||||||||||||||||||||||||||||||||||||||||||||||||||||||||||||||||||||||||||||||||||||
|
Income of Wages and Salaries |
19629 |
9.6 |
|||||||||||||||||||||||||||||||||||||||||||||||||||||||||||||||||||||||||||||||||||||||||||||||||||||||||||||||||||||||||||||||||||||||||||||||||||||||||||||||||||||||||||||||||||||||||||||||||||||||||||||||||||||||||||
|
Net Business Income |
5893 |
11.0 |
|||||||||||||||||||||||||||||||||||||||||||||||||||||||||||||||||||||||||||||||||||||||||||||||||||||||||||||||||||||||||||||||||||||||||||||||||||||||||||||||||||||||||||||||||||||||||||||||||||||||||||||||||||||||||||
|
Net Income from Property |
3076 |
10.2 |
|||||||||||||||||||||||||||||||||||||||||||||||||||||||||||||||||||||||||||||||||||||||||||||||||||||||||||||||||||||||||||||||||||||||||||||||||||||||||||||||||||||||||||||||||||||||||||||||||||||||||||||||||||||||||||
|
Net Income from Transfer |
6531 |
5.8 |
|||||||||||||||||||||||||||||||||||||||||||||||||||||||||||||||||||||||||||||||||||||||||||||||||||||||||||||||||||||||||||||||||||||||||||||||||||||||||||||||||||||||||||||||||||||||||||||||||||||||||||||||||||||||||||
|
Total Per Capita Income Nationwide Median |
29975 |
8.8 |
|||||||||||||||||||||||||||||||||||||||||||||||||||||||||||||||||||||||||||||||||||||||||||||||||||||||||||||||||||||||||||||||||||||||||||||||||||||||||||||||||||||||||||||||||||||||||||||||||||||||||||||||||||||||||||
|
Grouped by Permanent Residence |
|
|
|||||||||||||||||||||||||||||||||||||||||||||||||||||||||||||||||||||||||||||||||||||||||||||||||||||||||||||||||||||||||||||||||||||||||||||||||||||||||||||||||||||||||||||||||||||||||||||||||||||||||||||||||||||||||||
|
Urban Households |
43504 |
7.7 |
|||||||||||||||||||||||||||||||||||||||||||||||||||||||||||||||||||||||||||||||||||||||||||||||||||||||||||||||||||||||||||||||||||||||||||||||||||||||||||||||||||||||||||||||||||||||||||||||||||||||||||||||||||||||||||
|
Rural Households |
16902 |
11.2 |
|||||||||||||||||||||||||||||||||||||||||||||||||||||||||||||||||||||||||||||||||||||||||||||||||||||||||||||||||||||||||||||||||||||||||||||||||||||||||||||||||||||||||||||||||||||||||||||||||||||||||||||||||||||||||||
|
Total Per Capita Expenditure Nationwide |
24100 |
13.6(12.6) |
|||||||||||||||||||||||||||||||||||||||||||||||||||||||||||||||||||||||||||||||||||||||||||||||||||||||||||||||||||||||||||||||||||||||||||||||||||||||||||||||||||||||||||||||||||||||||||||||||||||||||||||||||||||||||||
|
Grouped by Permanent Residence |
|
|
|||||||||||||||||||||||||||||||||||||||||||||||||||||||||||||||||||||||||||||||||||||||||||||||||||||||||||||||||||||||||||||||||||||||||||||||||||||||||||||||||||||||||||||||||||||||||||||||||||||||||||||||||||||||||||
|
Urban Households |
30307 |
12.2(11.1) |
|||||||||||||||||||||||||||||||||||||||||||||||||||||||||||||||||||||||||||||||||||||||||||||||||||||||||||||||||||||||||||||||||||||||||||||||||||||||||||||||||||||||||||||||||||||||||||||||||||||||||||||||||||||||||||
|
Rural Households |
15916 |
16.1(15.3) |
|||||||||||||||||||||||||||||||||||||||||||||||||||||||||||||||||||||||||||||||||||||||||||||||||||||||||||||||||||||||||||||||||||||||||||||||||||||||||||||||||||||||||||||||||||||||||||||||||||||||||||||||||||||||||||
|
Grouped by Consumption Category |
|
|
|||||||||||||||||||||||||||||||||||||||||||||||||||||||||||||||||||||||||||||||||||||||||||||||||||||||||||||||||||||||||||||||||||||||||||||||||||||||||||||||||||||||||||||||||||||||||||||||||||||||||||||||||||||||||||
|
Food, tobacco and liquor |
7178 |
12.2 |
|||||||||||||||||||||||||||||||||||||||||||||||||||||||||||||||||||||||||||||||||||||||||||||||||||||||||||||||||||||||||||||||||||||||||||||||||||||||||||||||||||||||||||||||||||||||||||||||||||||||||||||||||||||||||||
|
Clothing |
1419 |
14.6 |
|||||||||||||||||||||||||||||||||||||||||||||||||||||||||||||||||||||||||||||||||||||||||||||||||||||||||||||||||||||||||||||||||||||||||||||||||||||||||||||||||||||||||||||||||||||||||||||||||||||||||||||||||||||||||||
|
Residence |
5641 |
8.2 |
|||||||||||||||||||||||||||||||||||||||||||||||||||||||||||||||||||||||||||||||||||||||||||||||||||||||||||||||||||||||||||||||||||||||||||||||||||||||||||||||||||||||||||||||||||||||||||||||||||||||||||||||||||||||||||
|
Household facilities, articles and services |
1423 |
13.0 |
|||||||||||||||||||||||||||||||||||||||||||||||||||||||||||||||||||||||||||||||||||||||||||||||||||||||||||||||||||||||||||||||||||||||||||||||||||||||||||||||||||||||||||||||||||||||||||||||||||||||||||||||||||||||||||
|
Transportation and telecommunication |
3156 |
14.3 |
|||||||||||||||||||||||||||||||||||||||||||||||||||||||||||||||||||||||||||||||||||||||||||||||||||||||||||||||||||||||||||||||||||||||||||||||||||||||||||||||||||||||||||||||||||||||||||||||||||||||||||||||||||||||||||
|
Education, culture and recreation |
2599 |
27.9 |
|||||||||||||||||||||||||||||||||||||||||||||||||||||||||||||||||||||||||||||||||||||||||||||||||||||||||||||||||||||||||||||||||||||||||||||||||||||||||||||||||||||||||||||||||||||||||||||||||||||||||||||||||||||||||||
|
Health care and medical services |
2115 |
14.8 |
|||||||||||||||||||||||||||||||||||||||||||||||||||||||||||||||||||||||||||||||||||||||||||||||||||||||||||||||||||||||||||||||||||||||||||||||||||||||||||||||||||||||||||||||||||||||||||||||||||||||||||||||||||||||||||
|
Miscellaneous goods and services |
569 |
23.2 |
|||||||||||||||||||||||||||||||||||||||||||||||||||||||||||||||||||||||||||||||||||||||||||||||||||||||||||||||||||||||||||||||||||||||||||||||||||||||||||||||||||||||||||||||||||||||||||||||||||||||||||||||||||||||||||
|
|
|
|
|||||||||||||||||||||||||||||||||||||||||||||||||||||||||||||||||||||||||||||||||||||||||||||||||||||||||||||||||||||||||||||||||||||||||||||||||||||||||||||||||||||||||||||||||||||||||||||||||||||||||||||||||||||||||||
|
Notes:
|
|||||||||||||||||||||||||||||||||||||||||||||||||||||||||||||||||||||||||||||||||||||||||||||||||||||||||||||||||||||||||||||||||||||||||||||||||||||||||||||||||||||||||||||||||||||||||||||||||||||||||||||||||||||||||||||
|
|||||||||||||||||||||||||||||||||||||||||||||||||||||||||||||||||||||||||||||||||||||||||||||||||||||||||||||||||||||||||||||||||||||||||||||||||||||||||||||||||||||||||||||||||||||||||||||||||||||||||||||||||||||||||||||
Annotations:
1. Explanatory Notes
Disposable income of Households refers to the sum of final consumption expenditure and savings that residents can use, that is, the income that residents can use for free disposal, including both cash income and physical income. According to the source of income, disposable income includes wage and salary income, net business income, net property income and net transfer income.
Consumer spending refers to all the expenditures that residents use to meet their daily needs, including both cash and physical consumption. Consumer spending includes eight categories: food, tobacco and alcohol, clothing, housing, daily necessities and services, transportation and communication, education, culture and recreation, medical care and other supplies and services.
The median of the nationwide per capita disposable income of households refers to the per capita disposable income of households which lies in the middle of all surveyed households ranked from low to high on the basis of per capita disposable income level.
The quarterly income and expenditure data do not include the income and consumption of the self-produced and self-used parts of households, and the annual income and expenditure data includes.
The two-year average growth rate refers to the growth rate calculated by geometric average method based on the corresponding number of the same period in 2019.
2. Survey Methods
The national and sub urban and rural households' income and expenditure data comes from the household income and expenditure and living conditions survey organized and implemented by the National Bureau of Statistics, which is released quarterly.
Using stratified, multi-stage, probability sampling method proportional to the size of population, the National Bureau of Statistics randomly selected 160000 households in 1800 counties (cities, districts) of 31 provinces (regions, cities) as survey households.
According to the unified system and method, the survey organizations directly under the National Bureau of statistics will organize the household to record and collect the data of households' income, expenditure, family operation, production and investment; meanwhile, according to the unified questionnaire, collect other surveys such as the employment of household members and labor force, the ownership of housing and durable consumer goods, and the enjoyment of households' basic social and public services. After the completion of data collection, the municipal and county survey organizations use unified methods and data processing procedures to code, review and input the original investigation data, and then directly transmit the basic household data to the National Bureau of Statistics for unified summary and calculation.
3. Description of Two-year Average Growth Rate
The two-year average growth rate refers to the growth rate calculated by geometric average method based on the corresponding number in the same period in 2019.